Abstract
We develop a viscoelastic generalization of the elastic Eshelby inclusion solution, where the inclusion and surrounding matrix are two different viscoelastic solids and the inclusion’s eigenstrain is a time-periodic oscillatory input. The solution exploits the Correspondence Principle of Linear Viscoelasticity and a Discrete Fourier Transform to efficiently capture the steady-state oscillatory behavior of the 3-D mechanical fields. The approach is illustrated here in the context of the recently-developed in vitro Cell-in-Gel system, where an isolated live cardiomyocyte (the inclusion) is paced to contract periodically within a soft hydrogel (the matrix), for the purpose of studying the effect of mechanical load on biochemical signals that regulate contractility. The addition of viscoelasticity improves the fidelity of our previous elastic Eshelby inclusion analysis of the Cell-in-Gel system by accounting for the time-varying fields and the resulting hysteresis and dissipated mechanical energy. This mathematical model is used to study the parametric sensitivities of the relative stiffness of the inclusion, the inclusion’s aspect ratio (slenderness), and the cross-link density of the hydrogel matrix.
Keywords: Viscoelastic, Eshelby, Inclusion, Cell-in-Gel, Cardiomyocyte, Contractility
1. Introduction
One of the most seminal boundary value problems in linear elasticity is the classical Eshelby inclusion problem (Eshelby, 1957; 1959). The inclusion, embedded in an infinite elastic matrix, is assumed to undergo an eigenstrain (spontaneous inelastic strain) that generates a residual stress field in the inclusion and the matrix. In the context of 3-D linear elasticity, Eshelby provided the exact solution for the mechanical fields inside and outside the inclusion. Interestingly, if the inclusion shape is an ellipsoid, Eshelby showed that the stress and strain fields within the inclusion are uniform. (The stress in the matrix is still very nonuniform, decaying away from the inclusion asymptotically to zero). Practical applications of the Eshelby inclusion analysis have been numerous, either (1) to analyze solids that undergo actual eigenstrains due to elasto-plasticity, thermal expansion, or phase changes, or (2) more often, to calculate effective (homogenized) elastic properties of particle- or fiber-reinforced composites by exploiting the eigenstrain as a mathematical artifice (Hori & Nemat-Nasser, 1993; Mura, 1991; Tandon & Weng, 1984; Withers, Stobbs, & Pedersen, 1989). This paper takes the former view where the eigenstrain in the inclusion is an actual inelastic strain, but of biochemical origin.
Our work is motivated by the need for a computational tool for our recently-developed in vitro Cell-in-Gel system that is being used to experimentally study the mechano-chemo-transduction (MCT) mechanisms in single cardiac muscle cells (Jian et al., 2014). In the Cell-in-Gel system, freshly isolated live cardiomyocytes (typically adult mouse or rabbit heart cells) are embedded in a constraining hydrogel and then electrically stimulated to undergo excitation-Ca2+ signaling-contractions. The hydrogel is a 3-D polymer matrix that imposes mechanical resistance during cardiomyocyte contraction, and this is immersed in a physiological solution to keep the cardiomyocytes alive. While it is extremely difficult to mimic the exact in vivo conditions in the whole heart, the Cell-in-Gel system enables us to study the impact of mechanical stresses on a single cardiomyocyte in a controlled way. Independently, other researchers developed an alternative method to apply mechanical load to a single cardiomyocyte, consisting of uniaxial stretching of cardiomyocytes by MyoTak-coated micro-rods attached to a load transducer while monitoring reactive oxygen species production and Ca2+ signals (Prosser, Khairallah, Ziman, Ward, & Lederer, 2013). Until both of these advancements, excitation-contraction experiments on a single cardiac cell could only be studied load-free. In Cell-in-Gel experiments, normal and overload conditions can be simulated by using hydrogels of various cross-link densities to systematically vary the mechanical resistance (afterload) during cardiomyocyte contraction. These ongoing experiments are being used to study MCT signaling of the cell and how it autoregulates contractility in the presence of afterload (Chen-Izu & Izu, 2017; Izu et al., 2020). Although the mechanical strains during cell contractions can be measured by optical microscopy and various ionic currents can be measured by the patch-clamp-in-Gel method (Shimkunas et al., 2021), the mechanical stresses in the cell cannot be directly measured. In the Cell-in-Gel system, these must be inferred by analysis.
Our first attempt to quantify the cell stress in the Cell-in-Gel system was a direct application of the Eshelby inclusion solution. Cell-in-Gel experiments were analyzed by treating the gel as a purely elastic matrix and the cell as an elastic inclusion that undergoes an eigenstrain to simulate contraction (Shaw, Izu, & Chen-Izu, 2013). While useful insights were gained, we recognized that neither the cell nor the hydrogel (both of which are quite soft and viscous) are purely elastic objects.
To improve the accuracy of the analysis, we seek to account for the viscoelasticity of the constituents in this work. The Correspondence Principle of Linear Viscoelasticity (CPLV) was first used to extend the Eshelby solution in Hashin (1965). It was, however, used for a very different purpose, i.e. to estimate the effective mechanical properties of synthetic particulate composites. The CPLV is also used here, but the focus is to quantify the explicit mechanical fields subject to an arbitrary time-varying periodic eigenstrain.
Many of the assumptions in Shaw et al. (2013) are adopted herein, and their advantages and limitations warrant mentioning. The eigenstrain of the inclusion is interpreted here as the muscle cell’s contractility, and the analysis treats the cell as an isotropic continuum object. Neglecting the details of the internal structure of the myocyte means that the average stress and strain of the cell are calculated in a homogenized (spatially-averaged) sense. The cardiomyocyte is approximated as an ellipsoid, since it is a rather versatile geometry that can capture a range of geometries, from oblate-spheroids to prolate-ellipsoids to fiber-like geometries. Certainly, the brick-like shape of an actual cardiomyocyte is more irregular than an ellipsoid, but even in the viscoelastic case, the internal cell stress and strain fields are uniform so these correspond to the spatially-averaged values we seek. Also, the homogenized properties of the cell may be anisotropic, but no such data currently exists to our knowledge. Accounting for the cell’s anisotropy, if it turns out to be significant, would not be difficult to implement. Finally, one may argue that the strains observed in a typical myocyte (10–20%) are too large to use in a linear analysis. We choose not to use nonlinear elasticity theory, since for our purposes the advantages of the linear theory outweigh its disadvantages. The CPLV, which can only be used in a linear theory, leads to a very efficient computational tool. The kinematic error is about the same order as the strain (10–20% error), which is acceptable considering the geometry approximation (ellipsoid), the homogenization assumptions, and the uncertainties and variability in the viscoelastic characterization of the hydrogels and cardiomyocytes. In other words, the linear theory is acceptable, since the strains are “moderate” but not too large. In any event, the Cell-in-Gel data provides a convenient opportunity to illustrate the viscoelastic Eshelby inclusion model.
This paper begins with an overview of the Cell-in-Gel experiments in The Cell-in-Gel system, followed by a brief review of linear viscoelasticity theory and the mechanical characterization of both gel and cell materials in Materials characterization. In Eshelby analysis, the boundary value problem is defined in the context of the elastic Eshelby inclusion problem. Its analytical solution is leveraged to solve the corresponding viscoelastic problem by exploiting the CPLV and a Discrete Fourier Transform (DFT) analysis to enable fast computations of periodic time-dependent mechanical fields. Simulation results provides an example simulation of a baseline case, followed by a parameter study to investigate the influence of material properties and cell geometry. Each simulation predicts the interior (cell) and exterior (hydrogel) displacement fields that can be compared to experimental measurements. The model is used to calculate the multiaxial stress state inside the cell, the traction distribution on the cell surface, and the mechanical work and power generated by the cell. Finally, a summary and conclusions are provided in Conclusions & Perspectives.
2. The Cell-in-Gel system
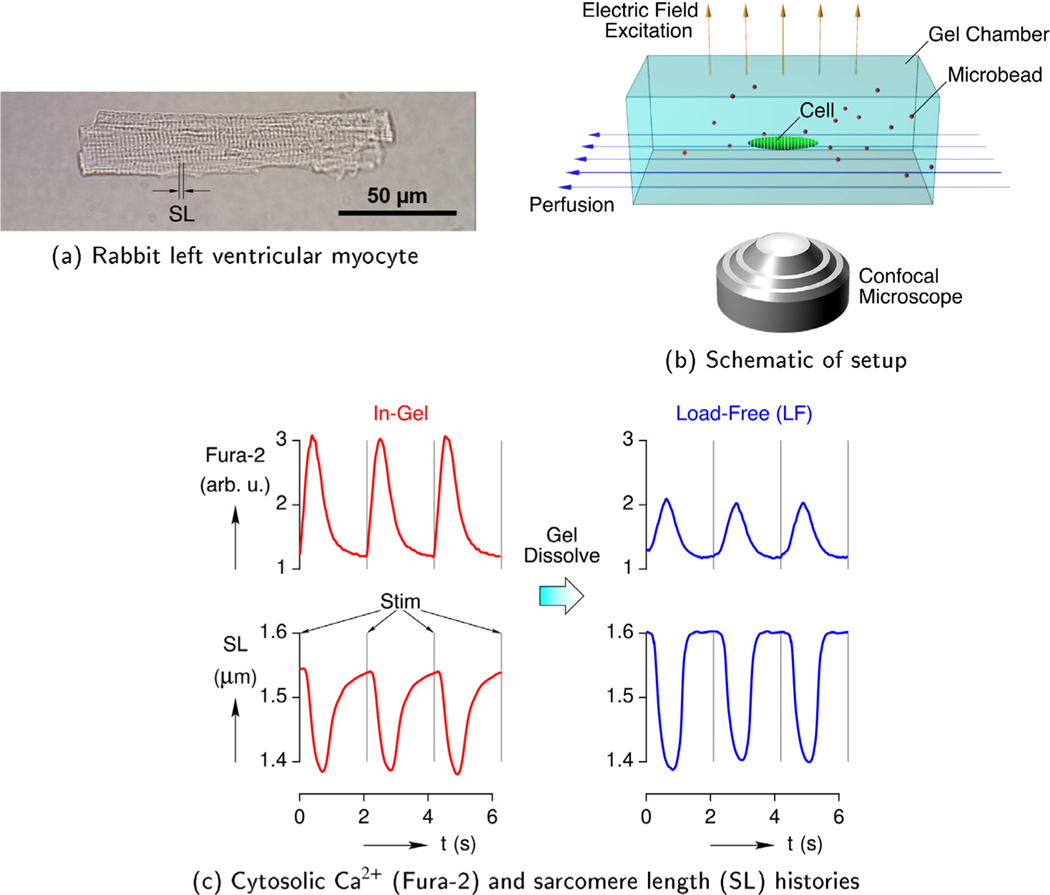
The Cell-in-Gel system was developed by us as an experimental tool (see Fig. 1) to apply controlled 3-D mechanical loading on a single cardiomyocyte to enable an in-depth investigation at the cellular and molecular levels. Ventricular myocytes (Fig. 1a) were freshly isolated from a healthy rabbit heart (Hegyi et al., 2018) and loaded with the fluorescent Ca2+ indicator Fura-2 (Jian et al., 2014). The cells were then embedded in the hydrogel and continuously perfused with Tyrode’s solution (Fig. 1b). The hydrogel consisted of polyvinyl alcohol (PVA) and polyethylene glycol (PEG)-boronate cross-linked polymer matrix immersed in an aqueous solution. It provided a soft and viscous medium, against which the contracting cell encountered mechanical resistance. The boronate-base crosslinker also binds to the glycosylated molecules on the cell surface to attach the cell to the polymer matrix. As the cell contracted and relaxed, the hydrogel deformation could also be tracked via confocal microscopy by the motion of embedded microbeads.
Fig. 1.
The Cell-in-Gel system and typical results.
The in-gel cardiomyocyte was paced at approximately 0.5 Hz frequency using electric field excitation pulses (suprathreshold, 4 ms) to undergo excitation-Ca2+ signaling-contraction cycles. As depicted in Fig. 1c, intracellular cytosolic Ca2+ transients (, shown in upper panel) and cell contractions (shortening of sarcomere length, shown in lower panel) were measured simultaneously using epi-fluorescence microscopy. Measurements on a single cardiomyocyte were first performed when the cell was contracting in-gel under mechanical load (left panel). The gel was then dissolved to release the cell inside the solution, and contraction of the same cell was measured again under load-free conditions (right panel). Such self-control experiments clearly showed that the cardiomyocyte had significantly larger Ca2+ transients under mechanical load than when load-free. Hence, the mechanical load exerted by the surrounding hydrogel was sensed by the cell and transduced to biochemical signal to upregulate the Ca2+ transients. This MCT mechanism led to a MCT-Ca2+ gain that enhanced the contractility of the cardiomyocyte in response to increased load. (It will be shown in Section 5 that a smaller change in SL would have occurred without this gain.)
In the classical paradigm of cardiac excitation-contraction coupling, the action potential causes the Ca2+ transient which in turn results in muscle contraction. Previous mechanistic studies mostly focused on the forward action from the electrical system to the Ca2+ signaling system, and then to the contractile system. The Cell-in-Gel method enables one to control the afterload on a single cardiomyocyte and provides new information on how mechanical load feedback affects the Ca2+ signaling system. For more than a century it is known that the heart has the remarkable ability to autoregulate contractility to compensate for mechanical load changes in order to maintain constant cardiac output. However, the molecular structures responsible for the autoregulation observed at the heart and tissue level remain unclear. The Cell-in-Gel technique provides a modern tool for in-depth investigation of MCT mechanisms at the single cell, sarcomere, and molecular levels. Ongoing Cell-in-Gel experiments, which will be reported elsewhere in experimental papers, have generated extensive structural and functional data to probe the origins of MCT mechanisms. The main focus of this modeling paper is to illustrate how a 3-D mechanical analysis of the strain and stress fields of the cardiomyocyte in a viscoelastic environment can be determined, thereby interpreting the experimental data, in order to better understand the MCT mechanisms in a quantitative way.
3. Materials characterization
The mechanical analysis of Section 4 requires that the constitutive behaviors of the hydrogel and the cardiomyocycte be known. Both are treated here as viscoelastic materials. Our hydrogel consists of three main constituents: PVA, PEG-boronate cross-linker, and physiological solution (e.g. Tyrode’s or phosphate-buffered saline). Each of these components has a considerable effect on the viscoelastic properties of the hydrogel, so the magnitude of the applied mechanical load can be fine-tuned by adjusting the concentrations of these constituents. Hydrogels of various cross-link densities are used in the Cell-in-Gel experiments to systematically vary the mechanical resistance to cardiomyocyte contraction. This section provides a brief review of linear viscoelasticity theory, followed by the mechanical characterizations of the hydrogel and the cardiomyocyte.
3.1. Linear viscoelasticity
According to the theory of linear viscoelasticity, the constitutive (stress-strain) response of the material can be expressed as a convolution integral in terms of a relaxation modulus and a prescribed strain history. That is, for a given shear strain history γ(t), the shear stress τ(t) history is expressed in terms of the relaxation shear modulus G(t) as
| (1) |
where is the strain rate. If the strain input is a step function at time t = 0 according
| (2) |
where γ0 is a constant, the response is simply . Thus, the relaxation modulus is the stress response to a unit step strain input. For a typical viscoelastic solid the stress jumps to an initial value G0 at time t = 0+ and then decays monotonically as to a smaller positive value G∞.
To capture the viscoelastic behavior of real hydrogels from rheology data with reasonable accuracy, the relaxation modulus G(t) is approximated here by a generalized Maxwell viscoelastic model, consisting of a spring of stiffness G∞ assembled in parallel with multiple Maxwell elements. The relaxation modulus is then mathematically represented by a Prony series according to (Wineman & Rajagopal, 2000)
| (3) |
where G∞ is the asymptotic value as , , are relaxation time constants (not to be confused with the shear stress), and ξj represent ‘phase fractions’ that apportion the amount of material that relaxes according to each time constant τj. To ensure it is physically reasonable and to preserve the interpretation of G0 and G∞ as instantaneous short-term and long-term values, respectively, the fractions must be non-negative (for all ) and satisfy .
If strain input is oscillatory, say where ω is a prescribed angular frequency, the resulting shear stress history, by Eq. (1), is
| (4a) |
| (4b) |
| (4c) |
After a sufficiently long time the decaying part in Eq. (4a) can be neglected, leaving the steady oscillatory response
| (5) |
The quantity that characterizes the in-phase portion of the response G′ is called the storage modulus, while that for the out-of-phase portion G″ is called the loss modulus. These are frequency-dependent functions which can be measured in a modern dynamical mechanical analyzer. To see the phase δ explicitly, one can rewrite Eq. (5) as , where and .
Alternatively, using complex variables1, suppose the input strain history is oscillatory according to (by Euler’s relation) with and the complex relaxation function is . Repeating the convolution integration Eq. (1) and neglecting the decaying part, gives the response as
| (6) |
The real part is the response to a cosine input, and the imaginary part is the response to a sine input. Moreover, the convolution integral Eq. (1) can now be replaced by
| (7) |
in terms of complex variables, when one is only interested in the limit cycle response after transients have died out.
3.2. Hydrogel characterization
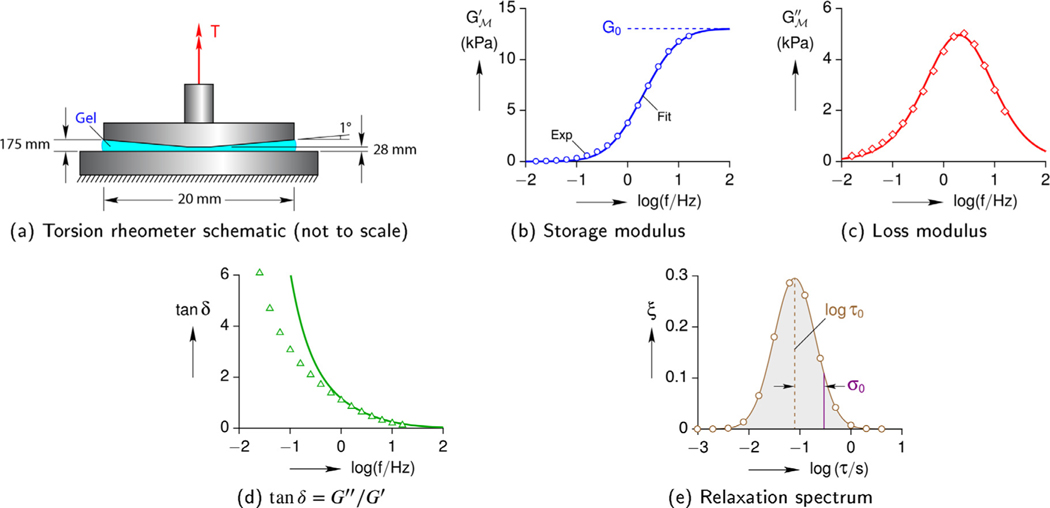
Rheometry measurements were performed on PVA-PEG-boronate hydrogels using a torsional dynamical mechanical analyzer with cone and plate platens (Fig. 2a). In all cases the shear strain γ amplitude was 2 %, and frequency scans were performed between 0.1 and 100 rad/s. Hydrogels of 10 % PVA (89–98 kDa) for several different cross-linker (CL) concentrations C = {2.5, 5, 7.5, 10, 12.5, 15}% were examined. Each case was run on three or four samples at 25 °C.
Fig. 2.
Example torsion rheology measurements on a C = 10 % cross-linked hydrogel. Solid lines are fits using a Gaussian relaxation spectrum.
As an example, the results of a 10% CL hydrogel sample are shown in Fig. 2b to e. The angular frequency was converted to cyclic frequency (f in Hz) according to ω = 2π f, and frequency results are shown on a logarithmic scale for clarity. In Fig. 2b and c, the open symbols mark experimental data, and the solid lines are fits according to Eqs. (4b) and (4c). In this case, and all others, G∞ = 0 was prescribed, since the G′ was quite small at low frequencies (see the lefthand tail in Fig. 2b). This means the hydrogel actually behaves more like a viscoelastic fluid than a viscoelastic solid.
The fits for G′ and G″ are reasonably good. This was achieved by selecting time constants at equal increments along a logarithmic scale, , and then fitting the parameters ξj (j = 1, 2,..., 13) and ΔG. For most of the hydrogel samples, an unconstrained fit resulted in a distribution of ξ versus log τ (relaxation spectrum) that resembled a Gaussian distribution. Consequently, the relaxation spectra for all of the results herein were constrained to lie along a Gaussian distribution according to
| (8) |
where τ0 is the mean time constant, σ0 is the standard deviation (characteristic width) of the distribution, and ξ0 is a normalizing constant to make . The resulting spectrum is shown in Fig. 2e. This reduced the number of fitting parameters down to only three for each hydrogel sample. The only tradeoff is that tan δ is somewhat over-predicted at very low frequencies (see Fig. 2d).
A summary is provided in Fig. 3, showing the trends of the three fitting parameters across all CL cases. The data points shown were obtained by fitting each frequency scan, similar to Fig. 2. The elastic shear modulus G0 generally increases with CL concentration in a non-linear manner, although the scatter between samples becomes progressively larger. The mean time constant τ0 also increases with CL concentration but trends almost linearly. The width of the relaxation spectrum σ0 is nearly constant, except at the smallest CL concentration.
Fig. 3.
Summary of hydrogel viscoelastic parameters at different cross-link concentrations (C).
The lines in Fig. 3 are CL-dependent fits of the fitting parameters according to
| (9a) |
| (9b) |
| (9c) |
Values of the fitting constants are provided in Table 1. This resulted in master fit functions for the complex shear moduli as a function of frequency and CL concentration.
Table 1.
Fitting parameters.
| G 0 | τ 0 | σ 0 |
|---|---|---|
| g0 = 14.7 (kPa) | h0 = 0.00486 (s) | s0 = 0.58 |
| g1 = 34.4 | h1 = 1.17 (s) | s1 = 55 |
| g2 = 0.0866 | h2 = −2.62 (s) |
3.3. Cardiomyocyte characterization
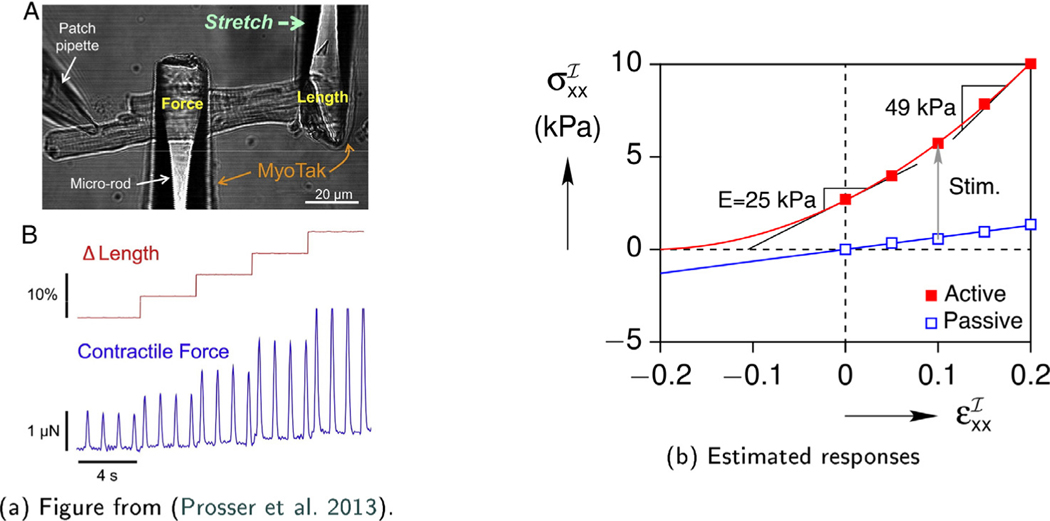
The elastic modulus of the cardiomyocyte was estimated using available data from the literature. (Prosser et al., 2013) performed uniaxial force-stretch measurements on a single ventricular myocyte stimulated at 1.0 Hz frequency using coated micro-rods (Fig. 4a). The cross-sectional area (A0) of the gauge section of the myocyte between the rods was estimated from the micrograph assuming the out-of-plane depth was the same as the cell width, allowing the axial stress (σxx = Fx/A0) to be calculated from the axial force (Fx). According to the extracted stress-strain response curve shown in Fig. 4b, the cell had an approximate Young’s modulus of when electrically stimulated. Assuming the cell is an incompressible linear elastic solid, the effective shear modulus was . To our knowledge, unfortunately, no viscoelastic data on a single cardiomyocyte currently exists in the literature.
Fig. 4.
Single cell uniaxial response.
4. Eshelby analysis
This section provides an analysis of the mechanical response of a live cardiomyocyte embedded in a viscoelastic hydrogel and paced to perform periodic beat-to-beat contraction. Our previous mechanical analysis of Cell-In-Gel experiments (Shaw et al., 2013) was based on the Eshelby inclusion problem (Eshelby, 1957), where the cell was treated as an ellipsoidal inclusion that undergoes an eigenstrain (transformation strain) inside an infinite elastic matrix. The present work extends the Eshelby boundary value problem (BVP) to account for viscoelasticity of the constituents. Before the viscoelastic analysis is presented, however, a brief review is provided of the purely elastic Eshelby BVP.
4.1. Elastic Eshelby analysis
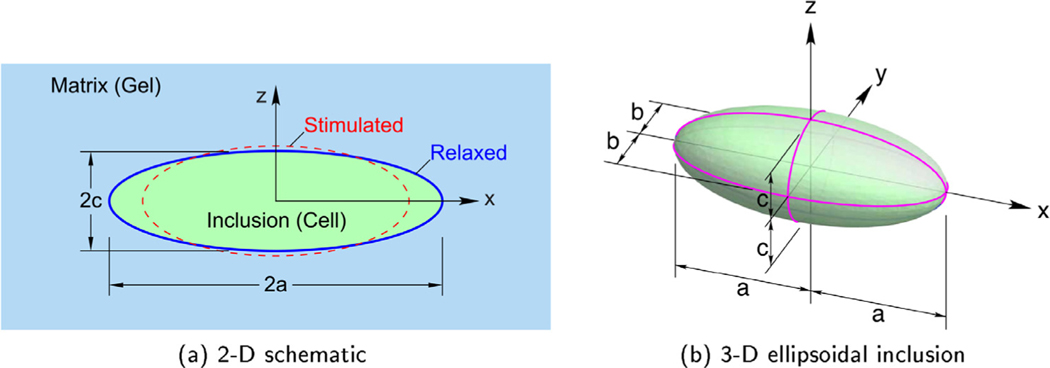
When the elastic properties in the inclusion and matrix are the same, the boundary value problem is called the homogeneous inclusion problem (Eshelby, 1957). The inclusion occupies a subvolume , assumed here to have the shape of an ellipsoid, and is embedded and bonded to the matrix at its periphery (Fig. 5). The matrix, occupying the complementary volume , is assumed to be of infinite extent, so the remote boundaries are traction and displacement free. The inclusion (here, the cell) is assumed to undergo an inelastic strain β, called the eigenstrain. This simulates the strain of the cell when it contracts load-free (unconstrained by any matrix). The mechanical resistance of the matrix (here, the gel), however, causes the magnitude of the inclusion strain ε to be somewhat less. This tug-of-war causes self-equilibrated residual stress fields in the inclusion and the matrix.
Fig. 5.
The Cell-in-Gel boundary value problem.
With respect to the Cartesian coordinate system2 shown in Fig. 5b, the displacements ui, strains εij, and stresses σij for the elasto-static problem are
| (10a) |
| (10b) |
| (10c) |
| (10d) |
where is the position vector with Cartesian components and orthonormal base vectors . Cijkl are the constant components of the 4th-order elastic stiffness tensor C. The quantities Bijk (x) and Dijkl (x) are position-dependent components of 3rd-order and 4th-order tensors, respectively, originally defined in (Eshelby, 1957; 1959). Within an ellipsoidal inclusion, the solution is
| (11) |
where are the components of the classical Eshelby tensor S. are constants, computed from elliptic integrals, which for isotropic material depend only on Poisson’s ratio ν and the dimensions of the ellipsoid {a, b, c}. Thus, although strain and stress fields are quite non-uniform in the matrix, they are uniform within an ellipsoid inclusion (the only known shape for which this is true).
If the elastic properties of the inclusion and matrix are different, the BVP is called the inhomogeneous inclusion problem. It is solved by introducing an equivalent eigenstrain β* that satisfies
| (12) |
The equivalent eigenstrain components , calculated from Eq. (12), ensure the correct stresses are recovered after the inclusion elastic properties are replaced by those of the matrix . As shown in (Eshelby, 1957), this clever mathematical artifice converts any inhomogeneous inclusion problem to the homogeneous Eshelby problem (with its known analytical solution), and one just proceeds as before after replacing the actual eigenstrain by the equivalent eigenstrain (β → β*).
Eq. (10) then becomes
| (13a) |
| (13b) |
| (13c) |
For the Cell-in-Gel problem, the hydrogel (matrix) and cell (inclusion) are treated as isotropic and incompressible materials. The Young’s modulus E and shear modulus G are related by 2G = E/(1 + ν), so in the limit ν → 1/2 the shear modulus is G = E/3. The dilatation in this case is zero (εkk = 0), and the deformation is isochoric (volume preserving). The eigenstrain components are taken as β11 = β, β22 = −β33 = −β/2, and β12 = β23 = β31 = 0, where β is the eigenstrain along the cell’s long axis. Explicit formulas for the computed equivalent eigenstrains can be found in (Shaw et al., 2013). The nonzero equivalent eigenstrains are proportional to β and depend nonlinearly on the ellipsoid dimensions and the shear modulus ratio . They are isochoric , and . The stresses then become
| (14) |
where the mean stresses in the inclusion and matrix are
| (15) |
and expressions for I1(λ), Λ(λ), α1(λ) and λ(x) are provided in Shaw et al. (2013).
The use of an ellipsoidal inclusion is reasonable, despite the fact that a typical cardiac cell is brick-like with jagged narrow ends in geometry. Using high-resolution finite element simulations, Kazemi-Lari et al. (2018) recently showed that the strain and stress fields within a brick-shaped inclusion are no longer uniform (as expected), gently varying mostly along the inclusion’s long axis. However, it was verified that the volume-averaged values of the stress components were quite similar between ellipsoidal and brick-shaped inclusion of the same aspect ratios.
4.2. Viscoelastic Eshelby analysis
Now we wish to account for the viscosity of the cell and gel in the framework of the Eshelby inclusion analysis. This causes all mechanical field quantities to become dependent on time t. According to correspondence principle of linear viscoelasticity (CPLV), if the linear elastic solution is known for a body that undergoes quasi-static motion, the solution to the corresponding problem in linear viscoelasticity can be constructed by substituting constitutive and load parameters with their time-dependent counterparts (see Wineman & Rajagopal, 2000). The correspondence principle takes advantage of time-space separability by solving the time-dependent portion of the problem in the Laplace or Fourier domain. The principle however, is restricted to linear problems where the boundary location remains fixed in the reference configuration and boundary conditions do not change type over time. That is, while the surface tractions or displacements may be time-dependent, points on the surface must remain traction-specified, or displacement-prescribed, or displacement-traction coupled for all time. Ours is the last type.
The application of the correspondence principle has been used before to obtain the solution to the viscoelastic Eshelby inclusion problem in order to estimate the properties of composite materials. A recent paper (Barthélémya, Giraudb, Lavergnea, & Sanahuja, 2016) contains a summary of relevant papers. The application of the viscoelastic Eshelby problem to cardiomyocytes in this paper is new.
Taking the Fourier transform of the field equations in Eq. (13b), the pseudo-elastic solution is solved in the frequency domain by
| (16a) |
| (16b) |
| (16c) |
An arbitrary eigenstrain history can be expressed as the Complex Fourier Series
| (17) |
where the coefficients are complex valued . Since β(t) are real valued, the coefficients and are complex conjugates.
The stress response to Eq. (17) is just the superposition of responses at each individual frequency, since the viscoelastic constitutive relations and kinematics are linear. Thus, the generalization of Eq. (16c) is the stress tensor (suppressing the spatial arguments)
| (18a) |
| (18b) |
where the complex relaxation moduli of the matrix at each frequency. This relation provides the steady state oscillatory response to a periodic eigenstrain input. The coefficient is found in the usual way by multiplying Eq. (17) through by with , integrating across the period of the interval , and exploiting orthogonality of integrals involving exp(i2π(n − m)t/T), resulting in
| (19) |
If the eigenstrain input is measured at N equal time increments () within the period, the discrete sequence is
| (20) |
which assumes N is even3. This leads to the Discrete Fourier Transform (DFT), where Eq. (19) is approximated by
| (21) |
and the inverse DFT, replacing Eq. (17), is
| (22) |
Finally, using Eq. (18b) the stress response at discrete times becomes
| (23) |
Note that the ordering of frequencies needs to be done with care to ensure the complex modulus is summed over complex conjugate pairs. That is, we need and when using Eq. (4) with real frequency ωn = 2πn/T, which is why we prefer the quasi-symmetric summation about n = 0 (rather than the often used n = 0,..., N − 1).
Once the stress in the inclusion is known, the mechanical power output of the cell (inclusion) can be calculated. This is related to the product of the instantaneous stress σ(t) and strain rate in the cell, as
| (24a) |
and the work done per cycle is
| (25a) |
The volume of the ellipsoidal inclusion is (see Fig. 5b), and t0 is the start time of a cycle. One should recognize that is the net mechanical work done by the cell on the gel, which is apart from other internal energy expenditures of the cell to maintain metabolic homeostasis, ionic homeostasis, and Ca2+ signaling.
The internal stress, strain, and strain rate provide volume-averaged values of relevant mechanical quantities that may be felt by interior mechano-sensors in the cell. Notably, the 3-D mechanical analysis also provides important clues to the locations of various mechano-sensors in the cell (Chen-Izu & Izu, 2017). The mechanical loading sensed by surface mechano-sensors of the cell can be estimated by calculating the traction vector te on the surface of the ellipsoid (interface of the cell and gel, ). The traction components are
| (26) |
where nj are the components of the surface unit normal n.
5. Simulation results
In this section, the results of our mechanical analysis are interpreted and compared to Cell-in-Gel data. The viscoelastic Eshelby model is used to calculate the multiaxial stress and strain states and the time-dependent mechanical responses of the cardiomyocyte contractions in the Cell-in-Gel experiments. First, simulation results are shown for a baseline case in the absence of MCT gain, which focuses on characterizing the mechanical field distributions inside and outside the cell. Next, a parameter study is performed to examine the influence of the hydrogel’s viscoelastic properties, the cell’s aspect ratio, and the cell’s stiffness, on the cell’s mechanical response. Finally, the inverse problem is solved to compute the eigenstrain history that would account for the MCT gain in the live cell. This is shown to achieve good agreement between the simulations and the Cell-in-Gel measurements.
5.1. Baseline case
Consistent with the cardiomyocyte in the Cell-in-Gel experiment (Fig. 1), the ellipsoidal inclusion has dimensions 2a = 131.2 μm and 2b = 18.4 μm, resulting in an aspect ratio of a/b = 7.13. From here on, in the absence of an out-of-plane measure, we assume c = b for simplicity. This is a reasonable estimate for many myocytes, and our results are not greatly affected even if c = 1.5b (as measured in certain myocytes.) The cell is treated as a contractile, elastic object with a shear modulus of (consistent with Fig. 4b) inside a viscoelastic hydrogel with at a CL density of C = 7.6 %.
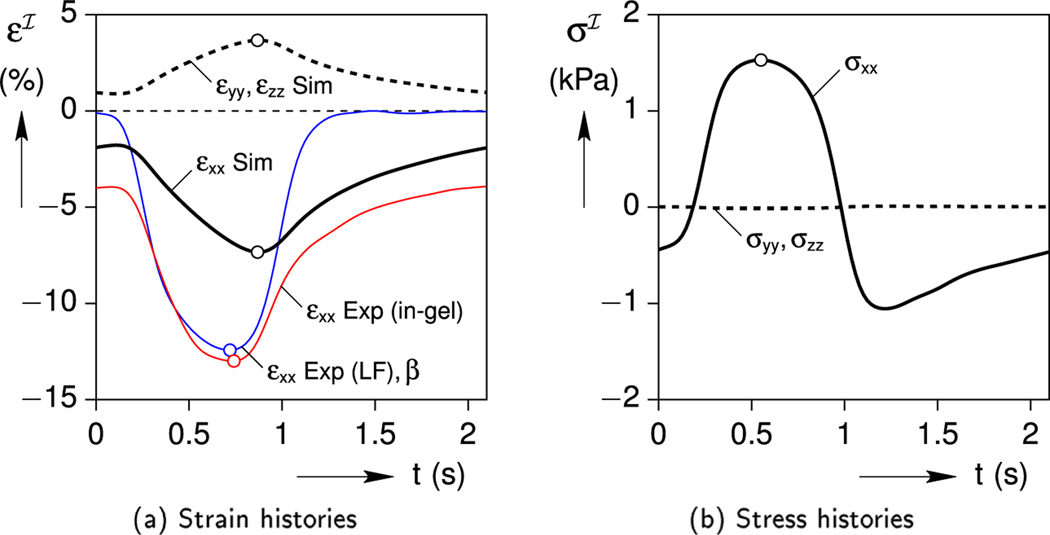
The Cell-in-Gel experiment recorded the axial strain history of a cardiomyocyte electrically stimulated at about 0.5 Hz after many cycles while embedded in the gel. A representative cycle, where t = 0 is the time of electrical stimulation, is shown in Fig. 6a. The thin red line shows the in-gel strain history of the cell, with a maximum contraction near strain. The gel was then dissolved away (leaving a nearly inviscid saline solution), and the strain history of the same myocycte was measured under nearly load-free conditions (thin blue line in Fig. 6a). The maximum contraction in this case was slightly smaller, about −12.4 % strain. This load-free strain history is used as the eigenstrain input β(t) in the viscoelastic Eshelby analysis of Section 4.
Fig. 6.
Baseline case: cell strain and stress responses.
The predicted in-gel axial strain history (simulated εxx, shown by the bold black line in Fig. 6a) has the right qualitative character, but the peak contraction (−7.3 % strain) is less than the experimental value (−13 %). As was shown in Fig. 1c, the actual myocyte significantly upregulates its intracellular Ca2+ transient by the MCT mechanism to increase contractility in response to the mechanical load. This adaptive feature is not captured here in the Eshelby model which treats the cell as an MCT-free passive entity, but will be included in Section 5.3. Also, as expected for a contractile inclusion inside a viscoelastic gel, the times of peak eigenstrain, peak inclusion strain, and peak inclusion stress are somewhat different. The minimum eigenstrain β occurs at t = 0.72 s, while the maximum axial stress occurs about 0.17 s earlier and the minimum axial strain occurs about 0.15 s later. The minimum strain measured in the myocyte reaches its minimum value at t = 0.74 s which happens 0.13 s earlier than the simulated minimum axial strain . The stress state in the inclusion is multi-axial, but the peak lateral stresses are quite small (minimum kPa) due to the slenderness of the ellipsoid.
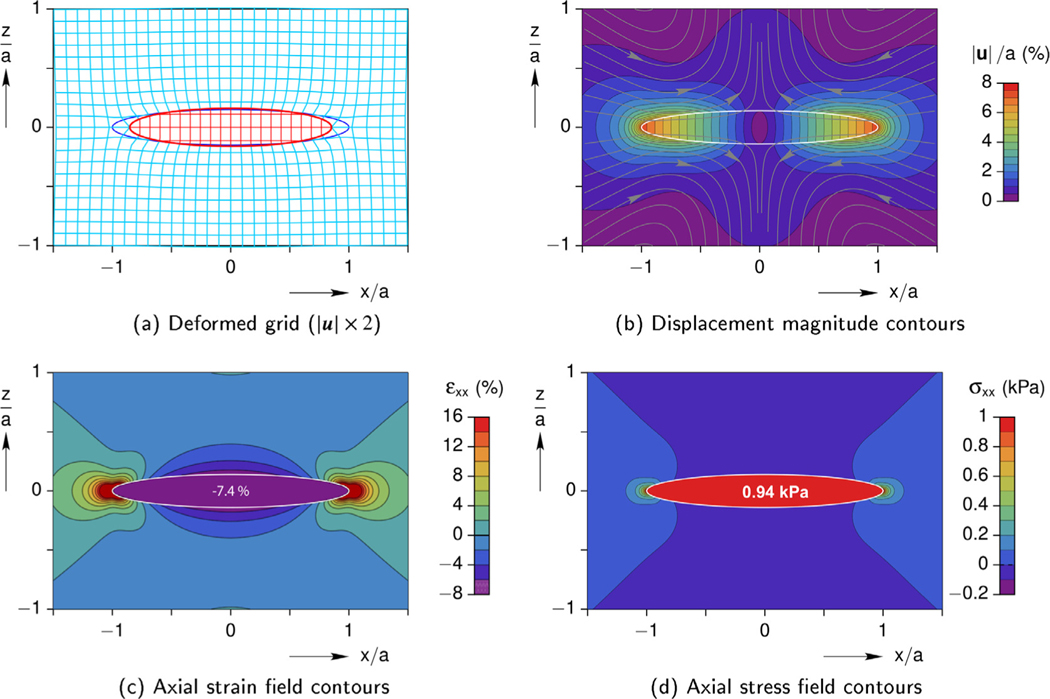
Selected field quantities in the cell and gel, including the displacements, longitudinal strain, and longitudinal stress, are shown in Fig. 7 at the time of maximum contraction within the symmetry plane y = 0. The problem is also symmetric with respect to the plane x = 0 (mid-span) and axisymmetric about the x-axis (since b = c). The stress and strain fields inside the cell (inclusion) are uniform at any given time instant. The fields in the gel (matrix), however, are non-uniform with a local strain and stress concentration just outside the cell’s ends (x = ±a), but these decay quickly to zero away from the cell.
Fig. 7.
Baseline case: interior and exterior mechanical fields in the y = 0 plane at the time of minimum cell strain (t = 1.1 s).
Fig. 7a shows a deformed grid, where the displacements have been magnified two-fold to clearly show the constrained cell which pulls on the surrounding hydrogel along the axial direction (x) yet pushes outward on the gel along the transverse direction (z). Fig. 7b presents a contour plot of the magnitude of the displacement (|u|) normalized by the cell’s half-length (a). Streamlines are overlaid to show the directions of displacements during contraction, again showing how the gel is drawn inward toward the ends of the cell at (x, y, z) = (±a, 0, 0), yet is pushed away from the cell at the mid-span (0, 0, ±c). The contour plot also shows that non-zero displacements in the gel are localized to the vicinity of the cell, and rapidly approach zero by |x| > 2a, or so. Thus, the map provides useful information about the expected displacements in the gel, which can be compared to the displacements of the micro-beads in the Cell-in-Gel experiments. Contour plots of the axial strain (εxx) and axial stress (σxx) are provided in Fig. 7c and d, respectively, showing uniform strain and stress fields inside the cell. In the gel, both plots exhibit ‘hot spots’ near the cell ends and at the mid-span (although much less severe). The maximum stresses and strains in the gel are quite local, less than a/4 in extent near the cell ends.
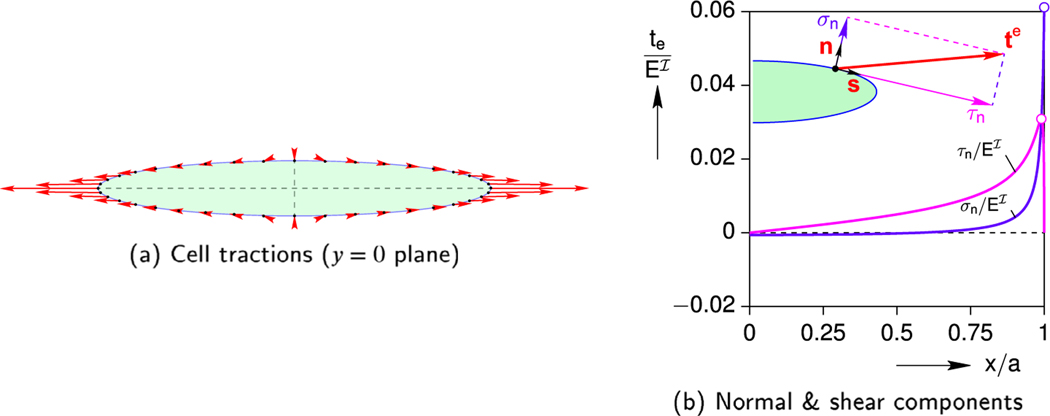
To give a sense of the magnitude and direction of the traction along the boundary points, a scaled schematic of the traction vector distribution along the entire cell’s boundary is provided in Fig. 8a. A more quantitative view of the traction distribution is provided in Fig. 8b, taken at the moment (t = 0.55 s) of peak cell stress ( kPa). The traction vector te on the surface of the ellipsoid is decomposed into normal σn and shear τn components relative to the surface (see inset schematic), and these are normalized by the Young’s modulus of the cell . Because of the symmetry with respect to x = 0 and z = 0 planes, the traction components are only plotted in the positive quadrant of the y = 0 plane.
Fig. 8.
Baseline case: traction distribution along the cell boundary at the time of peak stress (t = 0.55 s).
The outward unit normal to the cell surface is n, the tangential unit vector is s, and they are orthogonal (sini = 0). Fig. 8b shows that the normal component of the traction , acting perpendicular to the surface, changes from slight compression (over about 50 % of the length) to rapidly increasing tension, reaching a maximum value of about 0.061 at the cell end (x = a). The shear component of the traction , acting tangent to the cell’s surface, starts zero at the mid-span (x = 0) and rises across the length until it reaches a maximum of about 0.031 , before dropping sharply to zero at the cell end. Since the ellipsoid here is axisymmetric (c/b = 1), the same results would have been obtained if the tractions were plotted in the positive quadrant of any other plane that includes the x-axis.
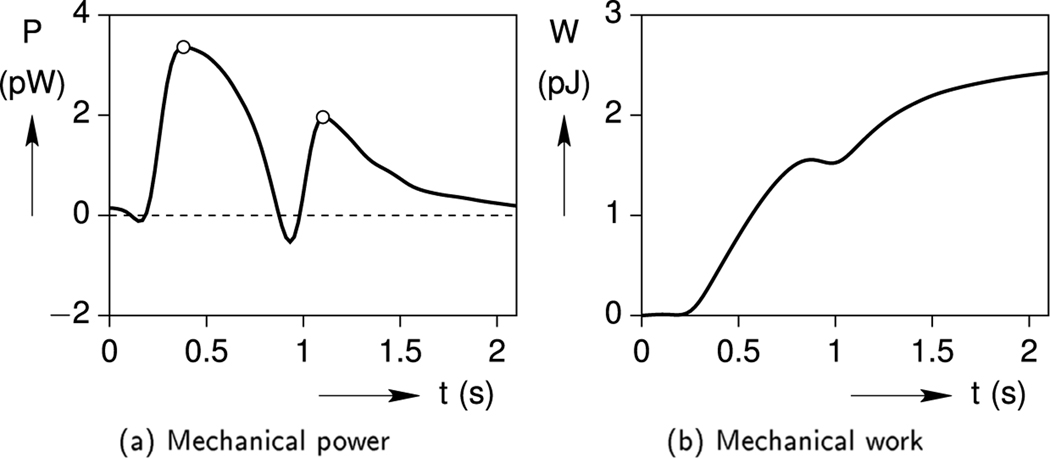
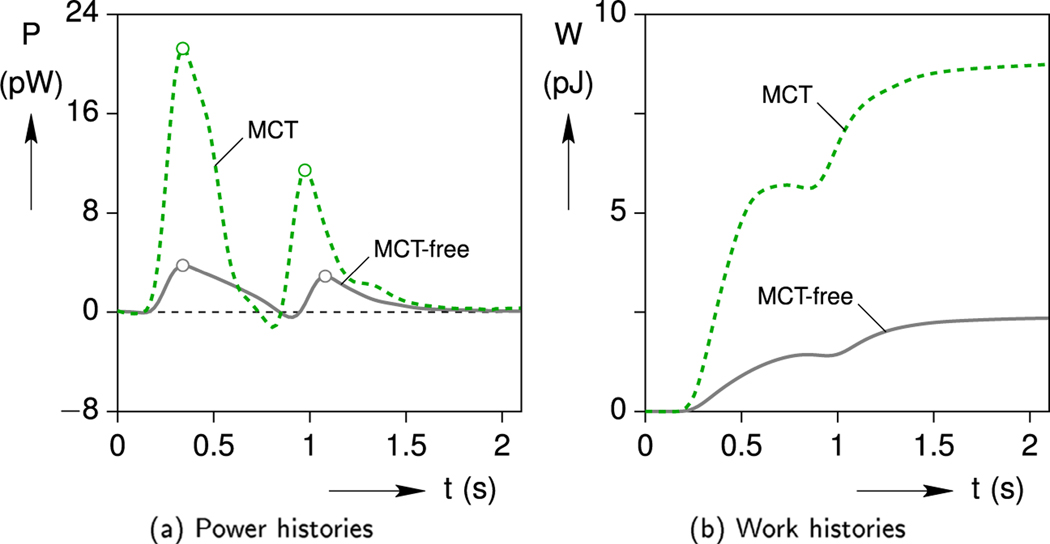
Using Eq. (24a), the output power and work of the cell during one contraction cycle are quantified in Fig. 9. Interestingly, the power history in Fig. 9a exhibits two local maxima near t = 0.38 s at 3.36 pW (picowatts) and t = 1.10 s at 1.96 pW, due to the out-of-phase stress and strain histories. Integrated from the power, the corresponding mechanical work history is provided in Fig. 9b. After a latency of about 0.2 s, the cell does positive work on the gel during systole, the gel momentarily does work against the cell as it decelerates, and then the cell again does work on the gel as the cell elastically lengthens during diastole. Overall, the (MCT-free) cardiomyocyte outputs a total work of W = 2.42 pJ/cycle during beat-to-beat contraction inside the viscoelastic hydrogel.
Fig. 9.
Baseline case: cell output power and work histories.
5.2. Parametric study
Numerous simulations were performed to understand the parametric sensitivities of the Cell-in-Gel system with respect to the gel crosslink (CL) concentration, the cell aspect ratio, and the cell stiffness. Each parameter is varied one at a time, while holding the other parameters fixed at their base case values. The viscosity of the cell itself was also investigated, but it had a relatively minor influence on the response so it is not shown. All cases calculated below use the same load-free eigenstrain history β(t) as before.
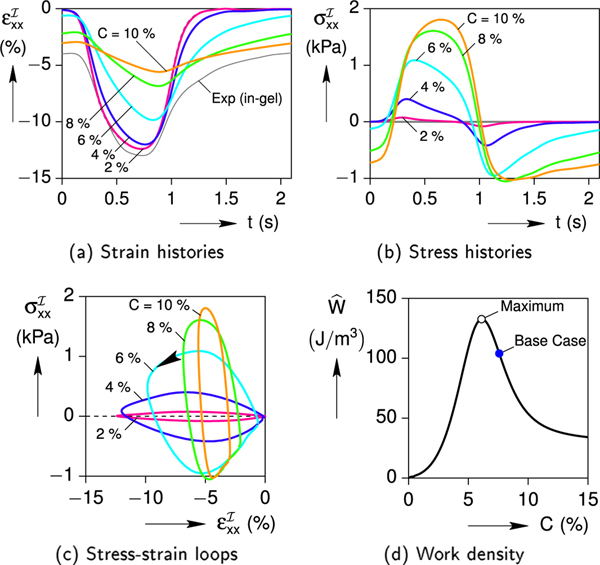
As demonstrated in Fig. 10a, the hydrogel’s CL concentration (C) has a strong effect on the cell contraction. As C is increased, the predicted magnitude of cell’s axial strain is significantly reduced and the phase difference between the stimulus signal and the contraction response is increased. In addition, Fig. 10b shows how the magnitude of the axial stress increases and the stress recovery becomes delayed with increasing C. Cross-plots of the corresponding stress-strain responses are provided in Fig. 10c. Each response is a hysteretic loop, where the enclosed area is related to the (output) mechanical work done by the cell on the gel. The hysteresis is small at low CL concentration (C = 2 %), large at intermediate concentrations (6 %), and small again at large concentrations (10 %). The calculated output work per cycle is plotted in Fig. 10d after normalizing by the cell volume to give a work density ( = W/). This shows that the work density starts at zero for C = 0, grows to a maximum value near 132 J/m3 at C = 6 %, and then decreases for larger C. This non-monotonic trend is to be expected, since W = 0 at the two extremes, C = 0 (no gel, zero cell stress) and C → 1 (nearly rigid gel, zero cell strain).
Fig. 10.
Effect of gel’s cross-link concentration C on the cell response (a/b = 7.13, = 8.3 kPa).
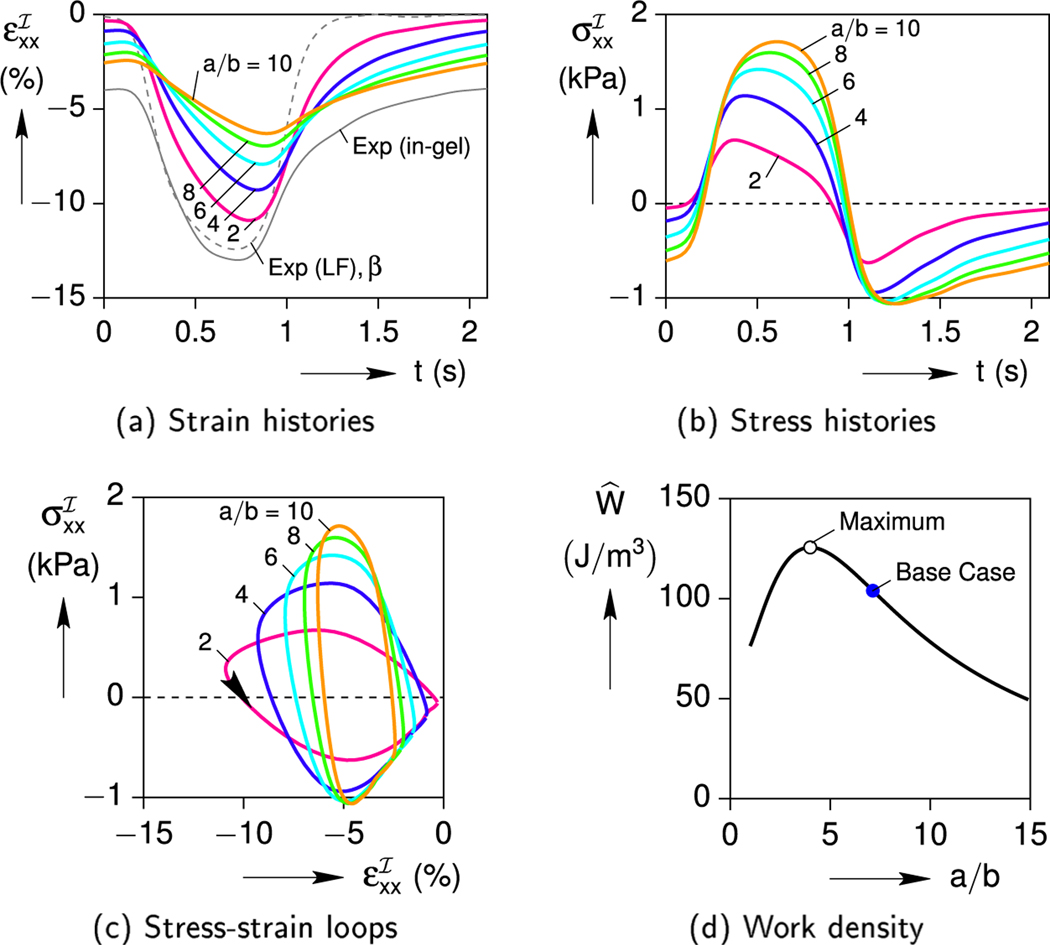
The effect of cell’s aspect ratio has a similar non-monotonic effect on the cell response as shown in Fig. 11. As the cell becomes more slender (larger a/b), reduced contractions and larger stresses are predicted (Fig. 11a and b). This trend can also be understood by examining the extreme cases. A spherical inclusion (a/b = 1) is the most able to contract, but its short length generates only a small displacement (for a fixed eigenstrain). A thin needle (a/b → ∞) would not be able to contract at all, since its axial cross-sectional area tends to zero. Likewise, the axial force would become very small, and the cell’s attempted contraction would be supressed by the resisting gel. As seen in Fig. 11c and d, increasing the cell’s aspect ratio from a small value (a/b ≈ 1) initially causes the stress-strain hysteresis and work density to increase. The work density reaches a peak at about 125 J/m 3 at a/b = 4, and then decreases thereafter.
Fig. 11.
Effect of cell aspect ratio a/b on the cell response (C = 7.6 %, = 8.3 kPa).
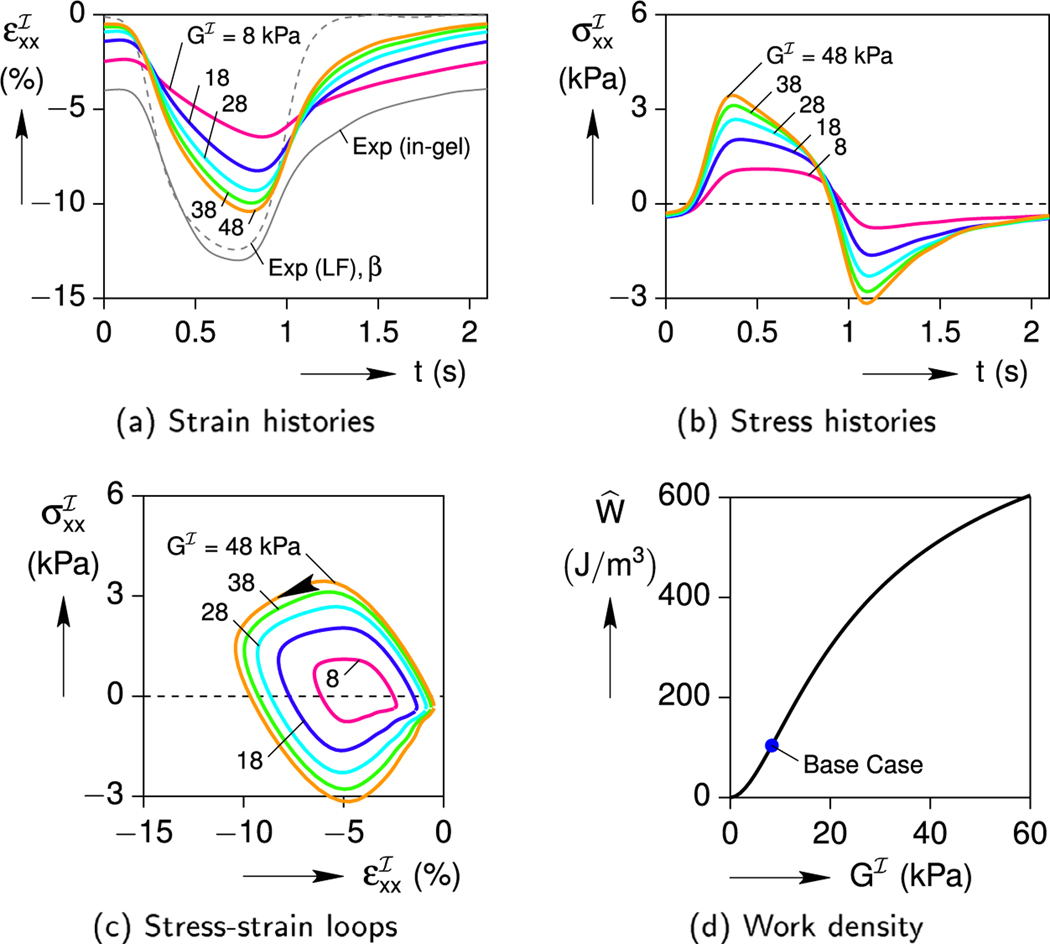
The cell’s shear modulus (), by contrast, has a monotonic influence as shown in Fig. 12. A stiffer cell is able to contract more (Fig. 12a), and this generates larger stresses (Fig. 12b). The stress-strain loops (Fig. 12c) and the work density (Fig. 12d) become larger. This makes sense, as a relatively compliant cell () could not contract much against the gel, while a nearly rigid cell’s contraction would approach the eigenstrain history, .
Fig. 12.
Effect of cell stiffness on the cell response (a/b = 7.13, C = 7.6 %).
Despite the wide range of parameters examined, none of the responses appear to approach the measured in-gel strain history of the actual cell. Admittedly, each parameter C, a/b, and has an uncertainty. The crosslink concentration was measured carefully, but the viscoelastic properties do have some scatter (see again Fig. 3). We also note that in the Cell-in-Gel experiment, the crosslinker had to be mixed in gently to avoid killing the myocytes, so it is possible that some spatial nonuniformity in CL concentration could have existed in the chamber. That, if anything, would have likely decreased the effective CL concentration, not increased it. The aspect ratio of the cell was measured optically, so we expect the in-plane aspect ratio is known reasonably accurately, although we could not measure the out-of-plane dimension. Based on the dimensions of many myocytes measured, one would not expect c to be much different than b, and even if it was 50 % different calculations show that it would not matter much. The elastic modulus of the cell is perhaps the parameter with the largest uncertainty, since we did not actually measure it (estimated from literature data (Prosser et al., 2013) for a rodent ventricular myocyte) and is subject to unknown variability between myocyte isolations and animal species. Nevertheless, the range of we considered appears to be extreme, and even in the case → ∞ the calculation still did not trend to the experimental result.
The missing feature in our (MCT-free) simulations so far is that the actual myocyte clearly has an autoregulation in response to afterload (as observed in the intact heart). We can envision two possible mechanical manifestations, either the cell increases its elastic stiffness and/or the cell adapts its eigenstrain. Based on our results above, the discrepancy between our predictions and the actual myocyte’s in-gel response cannot be explained by changes in the cell stiffness alone. The cell stiffness cannot change the delay in the peak contraction compared to the experimental in-gel strain history, and the calculation does not match the prolonged contraction decay in the actual strain history. It appears, therefore, that the autoregulation in response to afterload at the single cell level is primarily associated with an altered eigenstrain history.
5.3. Enhanced eigenstrain
We hypothesize that the MCT mechanism effectively alters the eigenstrain history in response to the mechanical load on the cell. That is, the real cell can sense the increased load and upregulates the Ca2+ transient to enhance contractility. The MCT-Ca2+ gain is clearly observed in our experiments, but the exact MCT mechanism is incompletely understood. A well-calibrated mechanical analysis should provide clues that will inform the ongoing investigation of MCT mechanisms and functional consequences in cardiomyocytes. The question arises, what enhanced (or MCT) eigenstrain history, βMCT(t), would be needed for the cell to achieve the as-measured in-gel strain history of Fig. 6a?
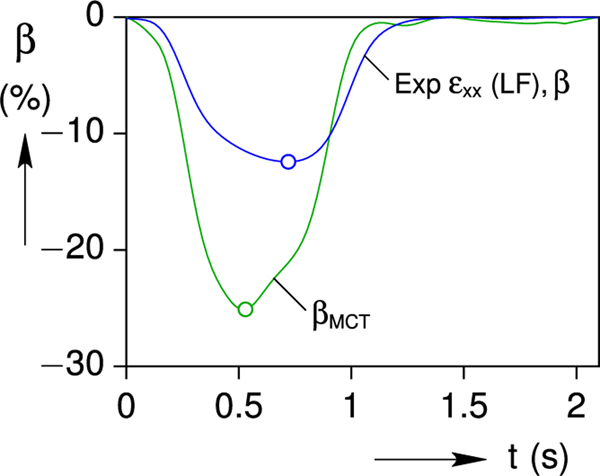
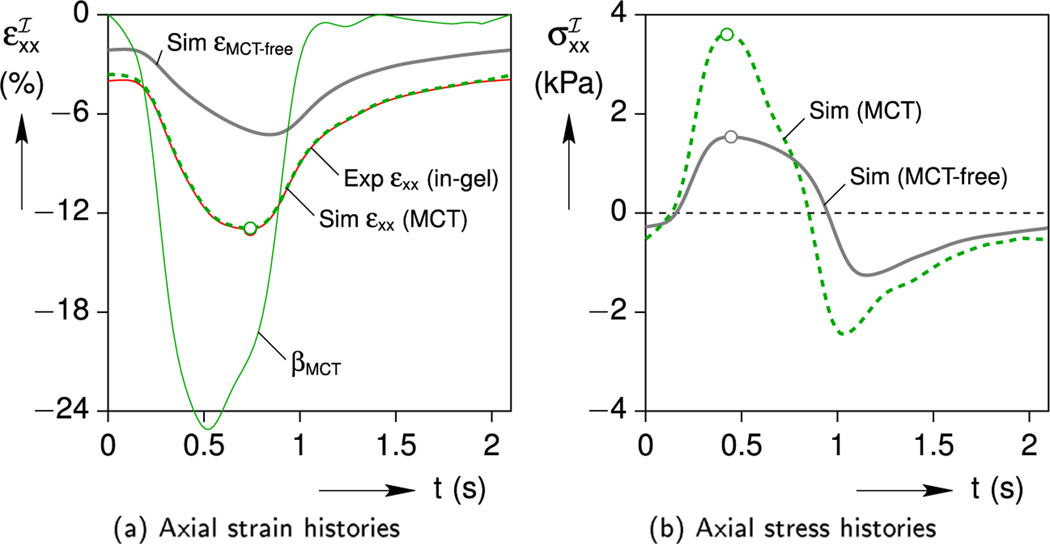
This final section answers the question by an inverse calculation, using the viscoelastic generalization of Eqs. (12) and (16b), subject to the constraints that the enhanced eigenstrain be periodic with βMCT (0) = βMCT (T) = 0 and remain non-positive (βMCT(t) ≤ 0, for 0 < t < T). Good agreement can be achieved with a purely elastic inclusion (results not shown here), but even better agreement is achieved by allowing the inclusion to be slightly viscous. Accounting for viscoelasticity of the cell (inclusion) is of secondary importance compared to upregulation of the cell’s contractility, and it is somewhat speculative since viscosity of the cell could not be measured directly. Nevertheless, in the absence of better information, we choose the simplest possible viscoelastic constitutive model, a three-parameter viscoelastic solid (Eq. 3 with Nτ = 1) with = 9.6 kPa, = 4.0 kPa, and = 0.6 s. The resulting enhanced eigenstrain is plotted in Fig. 13, showing a nearly two-fold enhancement in the peak MCT eigenstrain (−25 %) compared to the peak load-free (MCT-free) case (−13 %). It also produces a faster transient, with the peak βMCT occurring about 0.2 s sooner. Thus, the contractility of the cell is enhanced in both its amplitude and rate.
Fig. 13.
Comparison of the load-free (MCT-free) and calculated enhanced (MCT) eigenstrain histories.
Using the hypothesized MCT eigenstrain (βMCT), the simulation is repeated to capture the influence of Ca2+ upregulation on the cell deformation and stress. Fig. 14 shows the simulated upregulated (εMCT) axial strain and stress histories during a periodic cycle. Peak strains and stresses are identified with unfilled circles. The previous MCT-free simulated results (gray lines) are shown for reference. As seen in Fig. 14a, the simulation produces an excellent match to the measured strain response of the cell, such that the calculated peak strain is identical to the measured value of −13.0 % and the time lag discrepancy is eliminated. Importantly, the maximum predicted axial stress resulting from the MCT eigenstrain is almost twice the MCT-free case in Fig. 14b. The fact that the simplest possible viscoelastic model generates such good agreement provides us confidence that the assumed parameter values are reasonable and the important effects of the cell’s viscosity are captured. Accordingly, Fig. 14b provides our best estimate of the MCT cell’s axial stress history during the in-gel portion of the Cell-in-Gel experiment. The peak stress of = 3.27 kPa occurs at t = 0.40 s, and the minimum stress (maximum compression) of = −2.8 kPa occurs at t = 1.06 s.
Fig. 14.
Simulated upregulated MCT cell strain and stress responses (in-gel) including cell viscoelasticity, showing good agreement with the measured cell strain response.
Considering the mechanical energy, the effect of MCT upregulation is even more significant. A comparison of the mechanical power and work histories between the MCT and MCT-free simulations are plotted in Fig. 15.
Fig. 15.
Simulated mechanical power and work output of the cell with (MCT) and without (MCT-free) upregulation of contractility.
The increases in mechanical power and work are quite large, since the strain magnitude, strain rate, and stress magnitudes are all enhanced in the MCT model. The calculated mechanical work delivered by the upregulated cell at the end of a cycle is W = 8.53 pJ, which is about 3.5× larger than the MCT-free cell (W = 2.42 pJ).
6. Conclusions and perspectives
In this study we develop a mathematical model to analyze all mechanical fields associated with the contraction of an ellipsoidal inclusion in an infinite viscoelastic medium. Our mathematical model is based on the inhomogeneous Eshelby inclusion problem, a classical 3-D elasticity boundary value problem with a known exact analytical solution. By exploiting the Correspondence Principal of Viscoelasticity, the model is extended here, for the first time, to account for the viscoelastic properties of the inclusion and the surrounding matrix and produces an exact solution of the time-dependent mechanical fields. The model is used to help interpret ongoing Cell-in-Gel experiments, where a single cardiac muscle cell is paced to contract within a constraining hydrogel, aimed at better understanding the impact of mechanical afterload on biochemical signaling.
The model treats the cardiomyocyte as a viscoelastic contractile inclusion embedded in an infinite 3-D viscoelastic matrix (the hydrogel). The contractility of the cell is interpreted as a time-dependent eigenstrain.
The existence of an analytical solution, along with a discrete Fourier transform of steady periodic contractions, provides an efficient computational tool to quantify the periodic time histories of displacement, strain, and stress fields inside and outside of the cell. In particular, the stresses in the cell and gel, not directly measurable in the Cell-in-Gel experiments, are provided by analysis. The ability to accurately quantify the mechanical stress in the cell now makes it feasible to answer the important question “how much stress in a cardiomyocyte is a lot?” It also allows the mechanical energy and output power requirements of the myocyte under afterload to be quantified. A parametric study shows that the strain, stress, and mechanical work of the cell are significantly influenced by the viscoelastic properties of the gel and the aspect ratio of the cell (slenderness). While the internal strain and stress fields within an ellipsoidal cell are uniform (or nearly so in an actual myocyte) at any time instant, the surface traction is strongly non-uniform with a distinct maximum near the ends (near intercalated discs).
The viscoelastic inclusion model can provide first-order estimates of the mechanical properties and contractility of live muscle cells and their active upregulation mechanisms in the Cell-in-Gel system. For example, the geometry and stiffness of the cardiomyocytes vary by cell type and pathophysiological state. Mammalian ventricular myocytes are stout; whereas, atrial myocytes tend to be slender (Chen-Izu et al., 2006; Kirk et al., 2003). The cell’s stiffness may change during development, aging, or with genetic mutations (Granzier & Irving, 1995; Jacot et al., 2010; Zile, Baicu, & Gaasch, 2004). The multiaxial strains and stresses inside the cell are expected to influence internal mechanosensors such as titin (Granzier & Labeit, 2004), while surface tractions are expected to influence surface mechanosensors such as dystroglycans and integrins (Anastasi et al., 2009). Genetic mutations of some mechanosensors, such as dystroglycans, are known to cause muscular dystrophy cardiomyopathy (Reed, 2009a; 2009b). The mechanical analysis of the 3-D strains and stresses in cardiomyocytes provides a useful companion tool to the Cell-in-Gel experiments to ultimately better understand how the cell might sense multiaxial stresses, activate various mechanosensors, and transduce the strains and stresses to biochemical signals to regulate the heart’s function.
Cell-in-Gel experiments show that a healthy cardiomyocyte can adapt to increased afterload (gel mechanical resistance) by upregulating the cytosolic Ca2+ transient to enhance contractility (mechano-chemo-transduction, MCT). The viscoelastic Eshelby model initially assumed the cell to be a contractile but otherwise passive (MCT-free) elastic inclusion, and it analyzed the in-gel cell response based on the load-free cell strain history (eigenstrain). Discrepancies between the simulated and measured strain timing, amplitude, and rate, however, led us to propose a hypothesized enhanced MCT-eigenstrain and to assume viscoelastic properties for the cell. The MCT-eigenstrain history was obtained by solving the inverse Eshelby inclusion problem to find the corresponding eigenstrain that would recover the experimentally measured in-gel strain history. Using this two-fold upregulated eigenstrain, the viscoelastic Eshelby model then accurately predicts the enhanced contractility of the cell in response to afterload.
The important contributions of this work are the discovery of an exact solution to the viscoelastic Eshelby inclusion problem subject to a time-periodic eigenstrain history and its application to the Cell-in-Gel system. Overall, the viscoelastic inclusion model developed here provides a rigorous 3-D analysis of the Cell-in-Gel system to aid in the interpretation of experimental results and ultimately to inform biological studies of the cellular and molecular mechanisms that underly the heart’s ability to autoregulate contractility under physiological and pathological conditions. Perhaps, other applications of the viscoelastic Eshelby inclusion solution will be found in the future.
Acknowledgments
This work is supported by grants R01 HL123526, R01 HL141460, and R01 HL 149431 from the U.S. National Institutes of Health (NIH). The authors gratefully acknowledge our colleagues and collaborators who have made this research possible.
Footnotes
Supplementary material
Supplementary material associated with this article can be found, in the online version, at 10.1016/j.ijengsci.2021.103489
Declaration of Competing Interest
The authors declare that they have no known competing financial interests or personal relationships that could have appeared to influence the work reported in this paper.
Complex-valued quantities are denoted with a hat, such as γ.
Scalar quantities are denoted in normal type, while bold-face symbols denote vector or higher-order tensor quantities. The Einstein summation convention is used for repeated lower case latin subscripts within a term, as in xiei = x1e1 + x2e2 + x3e3.
If N is odd,
References
- Anastasi G, Cutroneo G, Gaeta R, Di Mauro D, Arco A, Consolo A, . . . Favaloro A. (2009). Dystrophin-glycoprotein complex and Vinculin-Talin-Integrin system in human adult cardiac muscle. International Journal of Molecular Medicine, 23 (2), 149–159. [PubMed] [Google Scholar]
- Barthélémya J-F, Giraudb A, Lavergnea F, & Sanahuja J. (2016). The Eshelby inclusion problem in ageing linear viscoelasticity. International Journal of Solids and Structures, 97–98, 530–542. [Google Scholar]
- Chen-Izu Y, & Izu LT (2017). Mechano-chemo-transduction in cardiac myocytes. The Journal of Physiology, 595 (12), 3949–3958. [DOI] [PMC free article] [PubMed] [Google Scholar]
- Chen-Izu Y, McCulle SL, Ward CW, Soeller C, Allen BM, Rabang C, . . . Izu LT (2006). Three-dimensional distribution of ryanodine receptor clusters in cardiac myocytes. Biophysical Journal, 91 (1), 1–13. [DOI] [PMC free article] [PubMed] [Google Scholar]
- Eshelby JD (1957). The determination of the elastic field of an ellipsoidal inclusion, and related problems. Proceedings of the Royal Society A, 241 (1226), 376–396. [Google Scholar]
- Eshelby JD (1959). The elastic field outside an ellipsoidal inclusion. Proceedings of the Royal Society London Series A, 252 (1271), 561–569. [Google Scholar]
- Granzier HL, & Irving TC (1995). Passive tension in cardiac muscle: Contribution of collagen, titin, microtubules, and intermediate filaments. Biophysical Journal, 68 (3), 1027–1044. [DOI] [PMC free article] [PubMed] [Google Scholar]
- Granzier HL, & Labeit S. (2004). The giant protein titin: A major player in myocardial mechanics, signaling, and disease. Circulation Research, 94 (3), 284–295. [DOI] [PubMed] [Google Scholar]
- Hashin Z. (1965). Viscoelastic behavior of heterogeneous media. Journal of Applied Mechanics, 32 (3), 630–636. [Google Scholar]
- Hegyi B, Bányász T, Izu LT, Belardinelli L, Bers DM, & Chen-Izu Y. (2018). β-adrenergic regulation of late Na+ current during cardiac action potential is mediated by both PKA and CaMKII. Journal of Molecular and Cellular Cardiology, 123, 168–179. [DOI] [PMC free article] [PubMed] [Google Scholar]
- Hori M, & Nemat-Nasser S. (1993). Double-inclusion model and overall moduli of multi-phase composites. Mechanics of Materials, 14 (3), 189–206. [Google Scholar]
- Izu LT, Kohl P, Boyden PA, Miura M, Banyasz T, Chiamvimonvat N, . . . Chen-Izu Y. (2020). Mechano-electric and mechano-chemo-transduction in cardiomyocytes. The Journal of Physiology, 598 (7), 1285–1305. [DOI] [PMC free article] [PubMed] [Google Scholar]
- Jacot JG, Kita-Matsuo H, Wei KA, Chen HV, Omens JH, Mercola M, & McCulloch AD (2010). Cardiac myocyte force development during differentiation and maturation. Annals of the New York Academy of Sciences, 1188, 121. [DOI] [PMC free article] [PubMed] [Google Scholar]
- Jian Z, Han H, Zhang T, Puglisi J, Izu LT, Shaw JA, . . . Chen-Izu Y. (2014). Mechanochemotransduction during cardiac contraction is mediated by localized nitric oxide signaling. Science Signaling, 7 (317), 1–9. [DOI] [PMC free article] [PubMed] [Google Scholar]
- Kazemi-Lari MA, Shaw JA, Wineman AS, Shimkunas R, Izu LT, & Chen-Izu Y. (2018). Viscoelastic Eshelby analysis of cardiomyocyte contraction in the Cell-In-Gel system. In Conference on smart materials, adaptive structures and intelligent systems (SMASIS 2018): 2: Mechanics and Behavior of Active Materials; Integrated System Design and Implementation; Bioinspired Smart Materials and Systems; Energy Harvesting. San Antonio, TX: ASME. [Google Scholar]
- Kirk MM, Izu LT, Chen-Izu Y, McCulle SL, Wier WG, Balke CW, & Shorofsky SR (2003). Role of the transverse-axial tubule system in generating calcium sparks and calcium transients in rat atrial myocytes. The Journal of Physiology, 547 (2), 441–451. [DOI] [PMC free article] [PubMed] [Google Scholar]
- Mura T. (1991). Micromechanics of defects in solids (2nd). Kluwer Academic Publishers. [Google Scholar]
- Prosser BL, Khairallah RJ, Ziman AP, Ward CW, & Lederer WJ (2013). X-ROS signaling in the heart and skeletal muscle: Stretch-dependent local ROS regulates [Ca2+]i. Journal of Molecular and Cellular Cardiology, 58, 172. [DOI] [PMC free article] [PubMed] [Google Scholar]
- Reed UC (2009a). Congenital muscular dystrophy. Part I: A review of phenotypical and diagnostic aspects. Arquivos de Neuro-psiquiatria, 67 (1), 144–168. [DOI] [PubMed] [Google Scholar]
- Reed UC (2009b). Congenital muscular dystrophy. Part II: A review of pathogenesis and therapeutic perspectives. Arquivos de Neuro-psiquiatria, 67 (2A), 343–362. [DOI] [PubMed] [Google Scholar]
- Shaw JA, Izu LT, & Chen-Izu Y. (2013). Mechanical analysis of single myocyte contraction in a 3-D elastic matrix. PloS One, 8 (10), e75492. [DOI] [PMC free article] [PubMed] [Google Scholar]
- Shimkunas R, Hegyi B, Jian Z, Shaw JA, Kazemi-Lari MA, Mitra D, . . . Balardi N, et al. (2021). Mechanical load regulates excitation-ca2+ signaling–contraction in cardiomyocyte. Circulation Research, 128 (6), 772–774. [DOI] [PMC free article] [PubMed] [Google Scholar]
- Tandon GP, & Weng GJ (1984). The effect of aspect ratio of inclusions on the elastic properties of unidirectionally aligned composites. Polymer Composites, 5 (4), 327–333. [Google Scholar]
- Wineman AS, & Rajagopal KR (2000). Mechanical response of polymers. Cambridge University Press. [Google Scholar]
- Withers P, Stobbs W, & Pedersen O. (1989). The application of the Eshelby method of internal stress determination to short fibre metal matrix composites. Acta Metallurgica, 37 (11), 3061–3084. [Google Scholar]
- Zile MR, Baicu CF, & Gaasch WH (2004). Diastolic heart failure—abnormalities in active relaxation and passive stiffness of the left ventricle. New England Journal of Medicine, 350 (19), 1953–1959. [DOI] [PubMed] [Google Scholar]


