Abstract
Inertial cavitation induced by pulsed high intensity focused ultrasound (pHIFU) has previously been shown to successfully permeabilize tumor tissue and enhance chemotherapeutic drug uptake. In addition to HIFU frequency, peak rarefactional pressure (p−), and pulse duration, the threshold for cavitation-induced bioeffects has recently been correlated with asymmetric distortion caused by nonlinear propagation, diffraction and formation of shocks in the focal waveform, and therefore with the transducer F-number. To connect previously observed bioeffects with bubble dynamics and their attendant physical mechanisms, the dependence of inertial cavitation behavior on shock formation was investigated in transparent agarose gel phantoms using high-speed photography and passive cavitation detection (PCD). Agarose phantoms with concentrations ranging from 1.5–5% were exposed to 1-ms pulses using three transducers of the same aperture but different focal distances (F-numbers of 0.77, 1.02, and 1.52). Pulses had central frequencies of 1 MHz, 1.5 MHz, or 1.9 MHz and a range of p− at the focus varying within 1–18 MPa. Three distinct categories of bubble behavior were observed as the acoustic power increased: stationary near-spherical oscillation of individual bubbles, proliferation of multiple bubbles along the pHIFU beam axis, and fanned-out proliferation towards the transducer. Proliferating bubbles were only observed under strongly nonlinear or shock-forming conditions regardless of frequency, and only where the bubbles reached a certain threshold size range. In stiffer gels with higher agarose concentrations, the same pattern of cavitation behavior was observed, but the dimensions of proliferating clouds were smaller. These observations suggest mechanisms that may be involved in bubble proliferation: enhanced growth of bubbles under shock-forming conditions, subsequent shock scattering from the gel-bubble interface, causing an increase in the repetitive tension created by the acoustic wave and the appearance of a new growing bubble in the proximal direction. Different behaviors corresponded to specific spectral characteristics in the PCD signals: broadband noise in all cases, narrow peaks of backscattered harmonics in the case of stationary bubbles, and broadened, shifted harmonic peaks in the case of proliferating bubbles. The shift in harmonic peaks can be interpreted as a Doppler shift from targets moving at speeds of up to 2 m/s, which correspond to the observed bubble proliferation speeds.
Keywords: pulsed high intensity focused ultrasound (HIFU), nonlinear waves, shock front, inertial cavitation, high-speed photography, drug delivery
I. INTRODUCTION
MECHANICAL effects produced in tissue by ultrasound-induced cavitation have been proposed for use in a number of clinical procedures involving drug or gene delivery to tumors or diseased tissue [1], [2]. In particular, pulsed high intensity focused ultrasound (pHIFU) has been shown to induce inertial cavitation throughout target tissue, thereby disrupting the stromal and cellular structures and permeabilizing the tissue to systemically administered drugs [3–5]. pHIFU uses short (microseconds to milliseconds) pulses delivered at low duty cycle (<2%), within a 1–2 MHz frequency range, at moderate peak intensity, chosen such that the peak negative focal pressure, p−, exceeds the cavitation threshold. The cavitation threshold has been reported to range within 3–30 MPa depending on tissue type, pulsing parameters (primarily pulse duration), and the way it was defined in a study [6]–[9]. In addition to the aforementioned exposure parameters, it has recently been demonstrated for relatively long, 1 ms duration pulses, that the threshold for consistent inertial cavitation activity and the associated tissue effects is also correlated with the formation of shocks at the focus of a pHIFU transducer due to nonlinear propagation effects [8], [10]. The output acoustic power and p− at which shock formation occurs are determined almost solely by the transducer F-number, with less focused transducers (i.e., higher F-number) achieving shock forming conditions at lower p− and acoustic power compared to more focused transducers [11]. The F-number is defined as the ratio of the focal length of the source and its aperture diameter. It is therefore also related to the focusing angle of the source.
The dependence of inertial cavitation dynamics on shock formation has previously only been observed using passive cavitation detection (PCD), which does not permit determination of the underlying physical mechanisms [10]. The objective of this study was to observe inertial cavitation activity simultaneously using both high-speed photography and PCD in transparent tissue mimicking agarose gel phantoms. pHIFU conditions were varied to elucidate the mechanism by which shock formation affects cavitation dynamics in pHIFU. The parameters varied include the transducer F-number, ultrasound frequency, p− at the focus, and the phantom’s stiffness and viscosity.
II. MATERIALS AND METHODS
A. HIFU Transducers and Drive Electronics
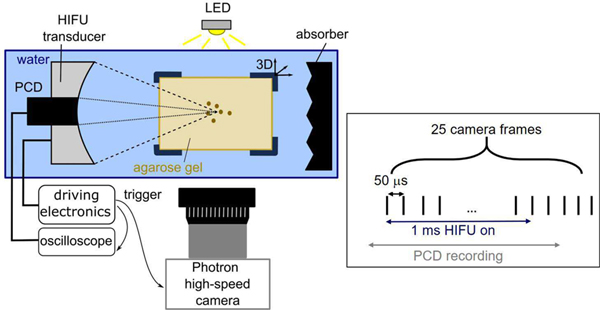
The overall experimental arrangement is shown in Fig. 1. The HIFU sources used in this study were spherically focused, 12-element sector array transducers with F-numbers of 0.77, 1.02, and 1.52, and with center frequency of 1.5 MHz. The transducers were made in-house using a process described in detail elsewhere [12], [13]. They had nearly identical apertures (73 mm, 75 mm, and 78 mm, respectively), and a central opening of 20 mm in diameter to allow for in-line passive cavitation detection. The transducers were also operable at 1 MHz and 1.9 MHz with the use of different electrical matching network boards [14]. They were powered by a custom-built class D amplifier with the input waveform generated by a computer-controlled field-programmable gate array (FPGA) board [13]. The total acoustic output power for all three transducers, operating at each of these three frequencies, was measured using an acoustic radiation force balance while varying the source voltage over the relevant power range [15].
Fig. 1.
Schematic diagram of the experimental setup. A single 1 ms HIFU pulse was delivered to each location in the agarose gel, and the ensuing cavitation bubble activity was observed using coaxial passive cavitation detection (PCD) and high-speed photography with backlighting. The relative timing of the HIFU pulse, high-speed camera recording, and PCD recording are illustrated on the right.
Hydrophones were used to acoustically characterize these three HIFU sources at 1.5 MHz, in both linear and nonlinear regimes, as described in detail elsewhere [10], and the procedure will be briefly summarized here. The least focused transducer with F-number = 1.52 was also characterized in the same way at the two other operating frequencies, 1 MHz and 1.9 MHz. Specifically, measurements of acoustic pressure amplitude at low power (linear propagation regime) were performed along the beam axis and in the focal plane using a calibrated capsule hydrophone(HGL-0200 hydrophone with an AH-2020 preamplifier set at 0 dB gain, Onda Corp., Sunnyvale, CA). The dimensions of the focal areas at −6 dB level were determined for each case and are provided in Table I.
Table I.
Parameters of the pHIFU fields. f –operating frequency; LxW – focal area dimensions at −6 dB level; Eds – acoustic power corresponding to developed shock formation with amplitude As at the focus, with associated p+ and p.
| F-number | f(MHz) | L×W(mm) | Eds,(W) | P+(MPa) | P−(MPa) | As(MPa) |
| 0.77 | 1.5 | 7×1.2 | 400 | 94 | 17 | 94 |
| 1.0 | 1.5 | 14.5×1.6 | 170 | 55 | 9 | 55 |
| 1.52 | 1.0 | 40×3.4 | 268 | 28 | 5 | 28 |
| 1.52 | 1.5 | 27×2.2 | 127 | 25 | 5 | 25 |
| 1.52 | 1.9 | 21×1.7 | 104 | 29 | 5 | 29 |
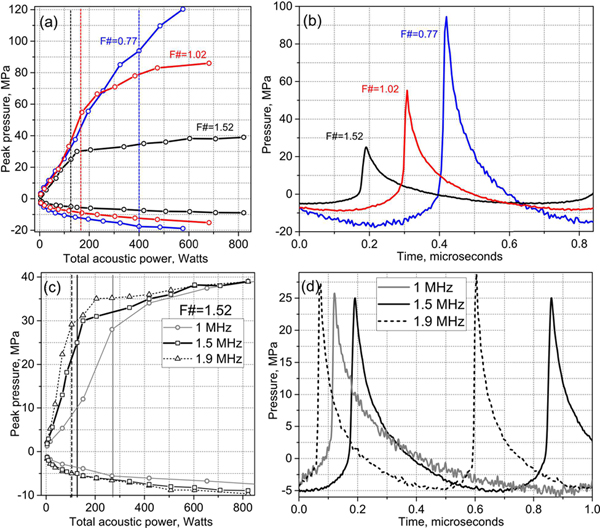
In a second set of measurements, pHIFU focal pressure waveforms were recorded at increasing source outputs starting from the low power level used in the linear beam scans using a fiber-optic probe hydrophone (FOPH2000, 100 μm fiber tip diameter, 100 MHz bandwidth, RP Acoustics, Leutenbach, Germany). The measured peak focal pressures, p+ and p−, are presented in Fig. 2 for the three transducers operating at 1.5 MHz, along with the waveforms containing the developed shock, i.e., with shock amplitude equal to the peak positive pressure [11]. The same measurements are also shown for the transducer with F-number of 1.52 at the three frequencies − 1MHz, 1.5 MHz, and 1.9 MHz. The peak pressures, p+ and p−, and acoustic output power corresponding to the waveforms with developed shocks shown in Figs. 2b,d are also listed in Table I for convenience.
Fig. 2.
HIFU transducer focal pressure levels for the transducers with F-numbers of 0.77, 1.02, and 1.52 operating at 1.5 MHz (a) and the transducer with F-number 1.52 operating at 1 MHz, 1.5 MHz, and 1.9 MHz (c). Dashed vertical lines indicate transducer output levels corresponding to fully developed shock front in the focal waveform. (b),(d) Focal pressure waveforms with fully developed shock front for the three transducers in (a) and the transducer with F-number of 1.52 at three different frequencies in (c), respectively.
B. Experimental Arrangement and Procedures
The schematic of the experimental setup is presented in Fig. 1. A single-element, spherically focused 5 MHz transducer with 13 mm aperture and 63 mm radius of curvature (Olympus NDT) was inserted in the central opening of the HIFU transducer and served as a PCD. The HIFU transducer and the PCD were mounted in a tank filled with degassed and deionized water. The signals received by the PCD were amplified by 20 dB using a pulser receiver (Panametrics PR5072, Waltham, MA, USA) and recorded by a digital oscilloscope at a sampling frequency of 50 MHz, and 10-bit resolution. Note that the PCD and the HIFU transducers were aligned coaxially, but not confocally, due to the difference in the focal distances of the three HIFU transducers. The geometric focus of the PCD was closest to that of the most focused HIFU transducer with F-number = 0.77. To evaluate cavitation-associated broadband noise level, the recorded PCD signals were filtered in the frequency domain by a combination of a 2.3–7.6 MHz band-pass filter and a notch-shaped comb filter suppressing the backscattered harmonics of the HIFU frequency as described previously [8]. Inertial cavitation was considered present during the HIFU pulse if the peak filtered PCD signal value exceeded the peak value of background noise by √5 – the Rose criterion, as used in our prior work [3],[8].
Agarose gel was used as the tissue-mimicking material due to its optical transparency and ease of fabrication. Agarose powder (UltraPure Agarose; Invitrogen) was added to deionized water at a concentration of 1.5%, 3%, or 5% w/v agarose/water. The majority of experiments were performed with 1.5% agarose, and the two higher concentrations were only used in one separate exposure set. The agarose solution was degassed by boiling it for 5 minutes in a microwave oven. The solution was then immediately poured into a rectangular acrylic mold (2 cm ×5 cm ×8 cm) and rapidly cooled down by placing the mold into a large reservoir filled with chilled water. The small-strain Young’s modulus of the samples was measured with micro-indentometry [16] to be, in average, 109±3 kPa, 429±23 kPa, and 515±23 kPa for 1.5%, 3%, and 5% agarose concentrations, respectively. After polymerization, the phantom was transferred into a sample holder with acoustic windows on four sides and positioned using a computer-controlled 3D positioning stage in the glass water tank. The HIFU transducer focus was placed 12 mm deep in the phantom, and the acoustic window edges were well outside of the beam path to avoid reflections. A large ultrasound absorber made of neoprene rubber was positioned behind the sample to prevent the reverberations within the water tank.
A Photron Fastrax APS-RX high-speed camera (monochrome, Photron, San Diego, CA) with a Nikon 105 mm lens and bellows extension was positioned on the side of the tank, perpendicular to the HIFU transducer axis. A 12-W white LED with a collimating lens was used for continuous backlighting in all exposures. Immediately prior to exposures the objective was focused on and field of view was centered relative to the fiber tip of FOPH positioned at the HIFU focus. The majority of exposures were filmed with 4-μs shutter speed and 20 kfps at spatial resolution ranging within 7–18 microns/pixel, with the field of view 768 × 192 pixels, i.e., 5.3 mm×1.3 mm to 13.8 mm×3.5 mm. Selected exposures were also filmed at the maximum frame rate practically feasible with this camera: 250 kfps or 150 kfps, with the same shutter speed, 9 microns/pixel resolution and field of view 87×16 pixels or 128×16 pixels, respectively.
All HIFU exposures in this study consisted of a single 1 ms long pulse, consistent with our prior studies [3],[8],[10]. High-speed camera frames and the PCD signal were acquired during, and for a few milliseconds after, each HIFU pulse, as illustrated in Fig. 1. After a HIFU exposure was delivered to a location within the gel, the sample was moved vertically by 3 mm, and the next exposure was delivered to the new location. For each combination of acoustic parameters considered here (p−, F-number, frequency) the exposures were repeated 5–10 times.
C. High speed video processing
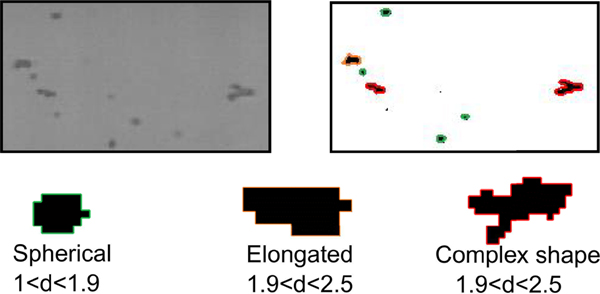
The automated procedure for high-speed video recording segmentation used to determine the distribution of bubble sizes and shapes is illustrated in Fig. 3. The gray levels in the first frame, taken before the HIFU was turned on, were subtracted from all subsequent frames to minimize noise. Within each frame, the bubbles were identified using binary gray level thresholding segmentation, as groups of dark pixels. The exterior boundary of each bubble was traced using the Moore-Neighbor algorithm [17]. The perimeter L and cross-sectional area S of each bubble were determined using these boundaries, and bubble shape was classified as nearly spherical, elongated, or complex according to the relation between L and S. Specifically, the following shape parameter d was introduced:
| (1) |
Fig. 3.
Illustration of the automated high speed video processing. Top left pane shows a section of an originally recorded frame. Bubbles identified in each frame using binary gray level segmentation, were classified for shape and correspondingly color-coded in the output frame (top right pane). The three shape categories are: nearly spherical, elongated, or complex, based on the parameter d = L2/4πS where L is the perimeter of the bubble outline, and S is its surface area. For a spherical shape d = 1.
For a perfectly spherical shape, d = 1. Bubbles for which 1< d <1.9 were considered to be spherical; if 1.9< d <2.5 the bubbles were considered elongated; if d >2.5 the bubbles were considered to be of complex shape (Fig 3). For bubbles that were classified as nearly spherical, the effective diameter, D, was calculated from their cross-sectional area:
| (2) |
III. RESULTS
A. Qualitative dependence of cavitation dynamics on HIFU transducer F-number and frequency
Across all the pHIFU exposures, three qualitatively distinct types of cavitation behavior were observed. Figure 4 shows representative examples of each at different time points within a 1 ms pulse. At the lower acoustic powers, stationary, nearly spherical bubbles distributed within the focal region appeared immediately after the HIFU wave reached the focus (Supplemental Video 1). The bubbles, as captured on high-speed photography frames, maintained their sizes, spherical shape, and position. Note that the shutter speed was 4 μs, and therefore included several HIFU periods, and probably, therefore, multiple associated bubble collapses. This behavior will be referred to as “stationary bubbles”. At increased acoustic power, stationary bubbles continued to be observed, primarily at the periphery of the focal area. In addition, a second behavior type occurred only along the acoustic axis, and close to the focus (Supplemental Video 2). Initially spherical bubbles became elongated along the acoustic axis and appeared to move along the beam axis towards the transducer over the duration of the HIFU pulse. This behavior will be referred to as “axial proliferation”. The third behavior type was observed at the highest acoustic powers, also primarily along the acoustic axis and within focal area: the originally spherical bubbles appeared to split over 1–2 frames (i.e. 50–100 μs) into several bubbles or bubble clusters located proximally and sideways, in a fanned-like pattern relative to the original bubble (Supplemental Video 3). The newly formed bubbles, in turn, split into several new bubbles in the same way, and the process continues until the end of the HIFU pulse. This behavior will be referred to as “fanned-out proliferation”.
Fig. 4.
Representative high-speed photography frames (top) and magnified regions thereof (bottom) illustrating the three types of cavitation activity at the beginning, middle and end of a 1 ms HIFU pulse. These images were obtained with a 1 MHz transducer with F# = 1.52, at the following levels of peak negative focal pressure: p− = 3 MPa, 5 MPa, and 7 MPa for left, middle and right, respectively. The scale bar is 1 mm. HIFU is incident from the left side of the images.
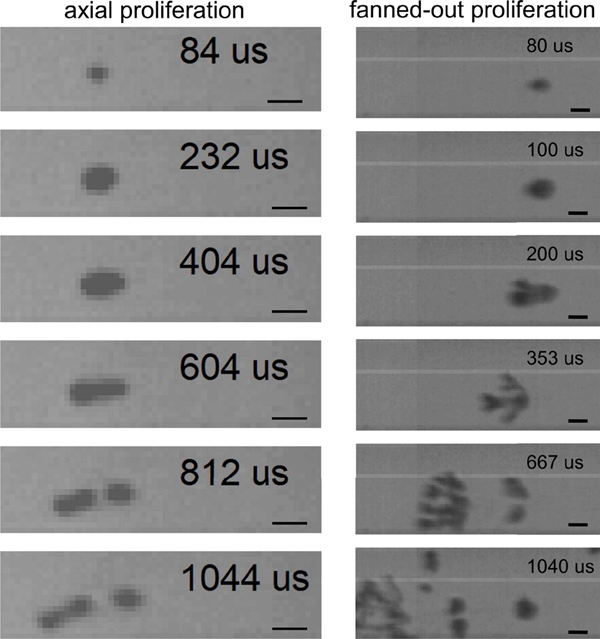
The axial and fanned-out proliferation behaviors of a single bubble have been documented at finer temporal resolution with ultra-high-speed photography, and are shown in Fig. 5 and in Supplemental Videos 4 and 5. During axial proliferation, a spherical bubble was nucleated within 4 microseconds of the HIFU wave reaching the focus, and grew, while maintaining spherical shape for about 150 microseconds. Afterwards, the transition into elongated shape occurred gradually over about 400 microseconds, followed by the production of new spherical bubbles proximal to the original bubble towards the end of the HIFU pulse. During fanned-out proliferation, the initial spherical bubble grew more rapidly (within 20 microseconds) before transitioning into a complex shape: two distinct bubbles were produced at the proximal side of the original bubble and split off within the next 100 microseconds. Each of the split-off bubbles rapidly split into two more bubbles, also located proximally. This process was repeated at the proximal side of the bubble group until the end of the HIFU pulse, while at the distal end of the group bubbles were alternately merging and splitting near the location of the original bubble.
Fig. 5.
Representative ultra-high speed photography (left 250 kfps, right 150 kfps) frames documenting axial proliferation and fanned-out proliferation behaviors of a cavitation bubble produced by a 1 MHz transducer with F-number=1.52. The scale bar is 100 microns; HIFU is incident from the left.
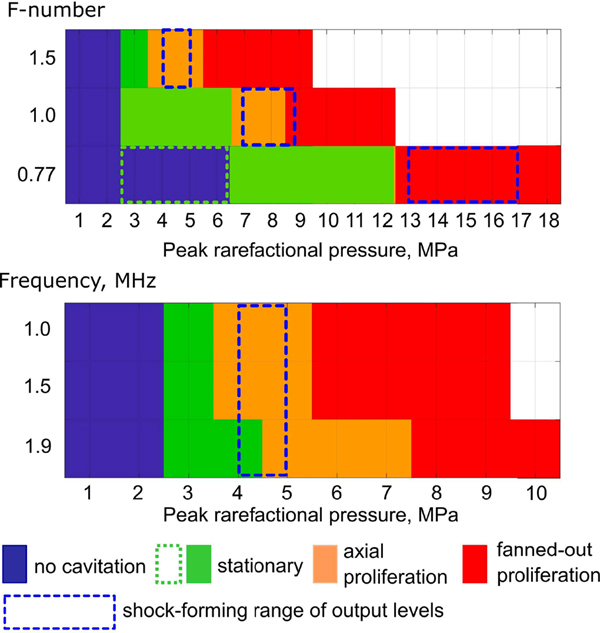
All the recorded high-speed videos were automatically processed to extract the numbers of spherical stationary bubbles, elongated bubbles (corresponding to axial proliferation), and bubbles of complex shape (corresponding to fanned-out proliferation). At 1.5 MHz, the p− levels at which each of the three behaviors were observed at least once were different for the transducers with different F-numbers (Fig. 6). Specifically, less focused transducers (higher F-number) produced proliferating behavior (axial or fanned-out) at noticeably lower p− and acoustic power levels than the most focused transducer (lowest F-number). The output levels at which proliferative behaviors were first observed corresponded to the formation of a shock in the HIFU focal waveform. Interestingly, for the most focused transducer (F-number = 0.77) the only proliferative behavior observed was fanned-out, but not axial.
Fig. 6.
Dependence of observed cavitation behavior on peak rarefactional pressure for transducers with different F-numbers at 1.5 MHz (top) and for the transducer with F-number of 1.52 at different frequencies (bottom). Specific behaviors were assigned if they were observed at least once for corresponding acoustic parameters. Dashed blue boxes indicate the range of output levels from the start of shock front formation to formation of the developed shock at the focus. Dotted green box indicates that cavitation activity was detected with PCD, but not with high-speed photography.
The output threshold for observing stationary bubbles in high-speed photography was the same for the two less focused transducers, but higher for the most focused transducer. However, the recorded PCD signals (not shown) indicated that cavitation activity also occurred at lower levels for that transducer (in one of ten exposures at p−= 3 MPa, and three out of ten at p− = 5 MPa). This discrepancy between PCD and high-speed photography observations most probably was due to the bubble size being below the spatial resolution provided by the high-speed photography in this set of exposures. In addition, the spatial alignment between PCD and HIFU foci is best for this most focused transducer [8], which may have contributed to enhanced PCD sensitivity for this case vs the two others.
When the operating frequency of the transducer with F-number = 1.5 was varied, there was a small difference in the p− thresholds for the proliferating behavior types only at 1.9 MHz frequency. Additionally, there were differences in the number of initially nucleated spherical bubbles and their size: the bubbles were smaller and fewer in number at the higher frequencies, for the same focal pressure levels. Note that the range of p− corresponding to shock formation conditions at the focus is the same for the three frequencies, while the threshold acoustic power is smaller for higher frequencies (Table I), as expected [11].
B. Dependence of spherical bubble size on acoustic output levels for the three cavitation behaviors
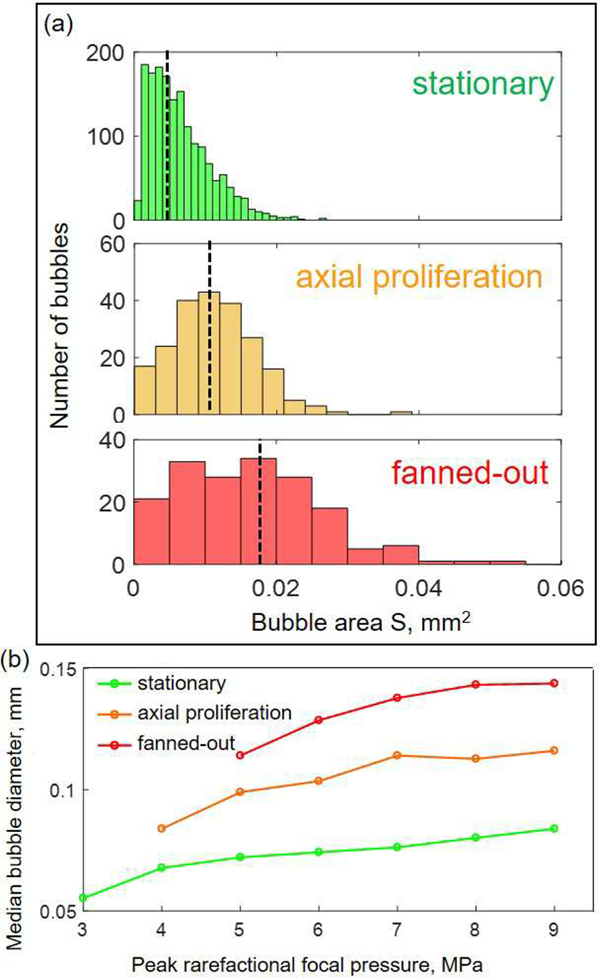
A high-speed video processing algorithm was used to quantify the diameters of the spherical bubbles that either remained stationary, or proliferated in an axial or fanned-out manner. In the case of stationary bubble behavior throughout the exposure, the cross-sectional area of each bubble in each frame was recorded and sorted into a “stationary” group. Note that if the same spherical bubble was observed within several frames during the exposure, its area was recorded multiple times. For proliferating behavior, the areas of spherical bubbles in the video frame immediately preceding their transition to proliferating behavior (i.e., being classified as elongated or complex shape) were recorded, removed from the “stationary” group and sorted into the appropriate “axial” or “fanned-out proliferation” group. The size measurements were then pooled together for all exposures performed with the same acoustic parameters, and the median bubble area was determined for each behavior group. A representative example of the bubble area distribution for the set of exposures by the transducer with F-number = 1.52, at the frequency of 1 MHz and p− of 7 MPa, is shown in Fig. 7a. The distribution of the bubble areas that remained stationary throughout the exposure is noticeably shifted down relative to the ones that subsequently proliferated. The size distribution of axially proliferating bubbles is in turn shifted down relative to that of the fanned-out proliferating ones. The median bubble areas shown in Fig. 7a reflect these shifts in bubble size distribution.
Fig. 7.
Distribution of sizes of spherical bubbles produced by a specific HIFU transducer (F-number = 1.52, frequency 1 MHz) at different peak rarefactional focal pressures. For proliferating behaviors, the bubble size immediately preceding the shape transition from spherical was recorded. (a) Representative bubble size distribution observed during a single pHIFU exposure at p− = 7 MPa. Dashed black lines correspond to median bubble size. (b) Dependence of median bubble size on peak rarefactional focal pressure for all bubble behaviors. Bubbles that will proliferate within the pulse are, in average, larger than bubbles that will remain stationary.
Median bubble diameters were determined from the median bubble areas for each set of exposures with the same acoustic parameters. Figure 7b shows the dependence of the median bubble diameter on p− for the three behavior groups. As seen, the median size differences between the three behavior groups were maintained at all output power levels: stationary bubbles were smallest, followed by axially proliferating and fanned-out proliferating ones. Within each behavior group the median initial spherical bubble size increased and then saturated with increasing p−. These observations held for all sets of acoustic parameters tested and indicate that proliferating behavior is associated with larger initial bubble diameters. Taken together with the requirement of shock formation for proliferating behavior described above, as well as the positions of the proliferating bubbles only on the acoustic axis and within the focal area, i.e. where the shocks exist, these observations suggest the involvement of a shock-scattering mechanism in initiating the proliferating behavior of bubbles. This mechanism has previously been reported for the formation of dense bubble clouds during histotripsy – a technique producing mechanical tissue fractionation down to the subcellular level [18].
C. Dependence of spherical bubble size on F-number and frequency
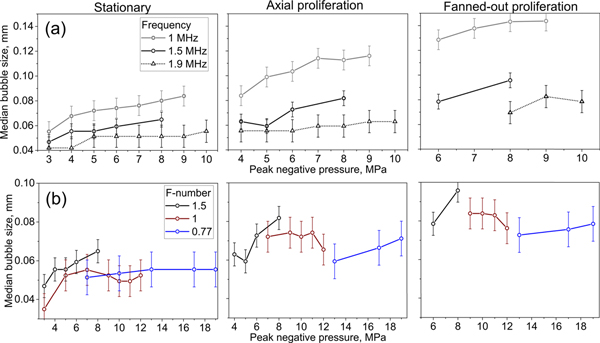
Figure 8a shows the dependence of the median spherical bubble diameter on p− for exposures performed using the transducer with F-number = 1.52 at the different frequencies. For all three behavior types and output levels, the median bubble size is smaller for higher frequencies, which corroborates the qualitative observations presented earlier. In contrast, no appreciable differences were observed between median bubble sizes within behavior groups for transducers with different F-numbers operating at the same frequency (Figure 8b). This is consistent with the lack of bubble size dependence on transducer F-number reported for individual bubbles within microtripsy clouds [19]. Note that proliferating bubble behaviors occur at very different focal pressures and output levels for the three transducers. This indicates that initiation of proliferating behavior is not dependent on specific peak acoustic pressure levels, as long as p− exceeds the threshold for nucleation of the initial spherical bubble, and the waveform contains a shock to facilitate shock-scattering.
Fig. 8.
Dependence of the median diameters of spherical bubbles that undergo the three cavitation behaviors on the peak rarefactional focal pressures during pHIFU exposures using (a) transducer with F-number = 1.52 at three different frequencies and (b) transducers with different F-numbers operating at 1.52 MHz.. Error bars correspond to the size of a single pixel and are provided as a reference.
D. Dependence of cavitation dynamics on agarose stiffness
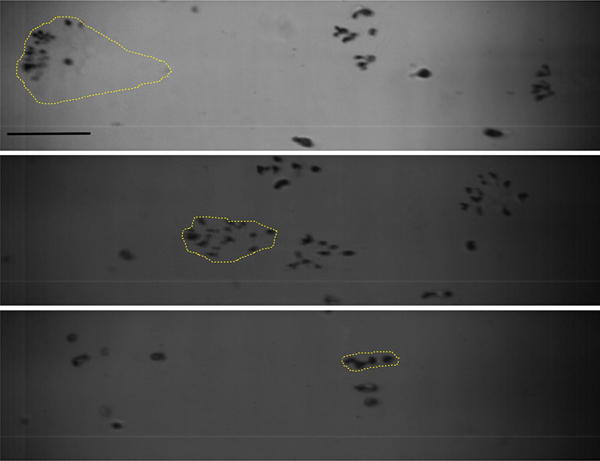
Exposures of gel phantoms with higher concentrations of agarose (3% and 5% ) were performed using the F-number = 1.52 transducer operating at 1 MHz at escalating output power levels. The p− threshold levels for proliferating behaviors were found to be the same for all gel phantoms; also, there was no difference between spherical bubble sizes in either behavior group for the different agarose concentrations (data not shown). However, with increasing agarose concentration, the spatial distribution of bubble clouds originating from a single proliferating bubble became more confined, in both transverse and axial directions, as illustrated in Fig. 9. The reduction in maximum axial length of the cloud suggests that the process of proliferation occurs more slowly over the course of the 1 ms pulse in the higher concentration agarose gels.
Fig. 9.
Representative high speed photography frames illustrating fanned-out proliferating cavitation bubbles observed at the end of a single 1 ms HIFU pulse produced by a 1 MHz transducer with F-number=1.52, p− = 9 MPa at increasing concentrations of agarose gel: 1.5%, 3% and 5% (top to bottom). The spatial distribution of new bubbles originating from each proliferating bubble, outlined with dotted yellow lines, became smaller with increasing agarose concentration, and therefore increasing elastic modulus and viscosity. Scale bar is 1 mm.
E. Spectral features of PCD signals specific to proliferating cavitation behaviors
Representative examples of filtered PCD signals representing broadband noise emissions from cavitation bubbles, corresponding to the different cavitation behaviors, are shown in Fig. 10a. These signals were recorded at different output levels of the F-number = 0.77 transducer operating at 1.5 MHz. In the absence of cavitation, the recorded signal shows background electrical noise, that did not change throughout the length of the recording. When stationary cavitation behavior was observed using high-speed photography, the amplitude of the filtered PCD signal exceeded that of the background noise for the duration of the HIFU pulse, after the time of flight to the HIFU focus. When fanned-out proliferation was observed, the PCD-recorded broadband noise emissions were higher in amplitude. The frequency spectra of the three PCD signals before filtering out HIFU harmonics are shown in Fig. 10b. The level of broadband noise is elevated when cavitation occurs, and is higher in the case of proliferating behavior than for stationary behavior, mostly at the high-frequency end of the spectrum. As expected, the backscattered HIFU harmonics are present in all signals, whether cavitation occurs or not. Importantly, if the harmonic peaks are examined in more detail (second harmonic peaks are shown in Fig. 10c), it can be appreciated that the peaks are wider (19 kHz vs 2 kHz at −10 dB level) and shifted in frequency by up to 10 kHz in the case of proliferating behavior compared to stationary behavior. The shift, Δf, is greater for higher harmonics. This is consistent with a Doppler shift caused by the motion of bubbles towards the transducer:
| (3) |
where f is the frequency of the harmonic peak, c is the sound speed and v is the velocity of the scatterers, in this case – cavitation bubbles. The shift of 10 kHz at the second harmonic frequency of 3 MHz would thus correspond to the speed of 2.5 m/s. This estimation is confirmed by the corresponding high-speed video recording of the two bubble clouds shown in Fig. 10d. The distances from the original nucleated bubbles to the outermost edges of the bubble clouds are 2.1 mm and 1.8 mm. These distances were covered by the cloud fronts over the duration of 1 ms HIFU pulse, resulting in average cloud front speeds of 2.1 m/s and 1.8 m/s, respectively. Note that these speeds are averaged over the entire pulse and over multiple bubbles, that are moving with different speeds within the cloud. This is the probable origin of the overall harmonic peak broadening.
Fig. 10.
(a) Representative filtered PCD signals showing cavitation broadband noise obtained during pHIFU exposures, which induced no cavitation, stationary cavitation, and fanned-out bubble proliferation. Exposures performed with the transducer of F-number = 0.77 operating at 1.5 MHz are shown. (b) Frequency spectrum of the unfiltered PCD signals from (a) showing both broadband noise and backscattered HIFU harmonics. (c) Close up view of the dashed box from (b) shows the backscattered HIFU second harmonic (3 MHz). Broadening of the peak and Doppler shift of 10 kHz (corresponding to speed of 2.5 m/s) is observed for the signal corresponding to proliferating bubbles compared to stationary bubbles. (d) First (top) and last (bottom) high-speed camera frames corresponding to the PCD signal in (a) showing proliferating cavitation bubbles. Over the 1 ms pHIFU duration, the two bubbles have shifted axially by 2.1 mm and 1.8 mm.
The spectral shift and spectral broadening of the second harmonic peak were extracted from PCD signals for all exposure levels and transducer parameters in the 1.5% agarose gels and correlated to the bubble behaviors automatically classified from the high-speed video recordings. For exposures resulting in axial proliferation, the second harmonic peak was only slightly shifted (by 1–6 kHz) due to the relatively small bubble front displacement over the 1 ms pulse. The peak remained fairly narrow (spectral width at 0.1 level ranged within 2–10 kHz), consistent with axially directional motion of the bubbles. For exposures resulting in fanned-out proliferation, both the spectral shift and width were substantially larger, 6–10 kHz and 10 – 30 kHz, respectively. These ranges can be considered as metrics for determining cavitation behavior from PCD signals in other media, e.g. tissue.
IV. DISCUSSION AND CONCLUSIONS
As demonstrated in our prior work, the metrics of pHIFU-induced inertial cavitation activity in agarose gels obtained from coaxial PCD signals - cavitation probability, persistence, and broadband noise level - were dependent on not only p−, but also on the transducer F-number and on the degree of nonlinear distortion of the focal waveform [8],[10]. In vivo, formation of a shock in the focal HIFU waveform correlated with the intended bioeffect – tissue permeabilization [3]. In this work, we have sought to elucidate the physical mechanisms that may be responsible for the prior findings by observing bubble activity directly in the transparent agarose phantoms with high-speed photography under a range of pHIFU exposure conditions. The difference in pHIFU exposures in the current study was that only a single HIFU pulse was used at a given location in the gel, as opposed to sixty pulses, as used previously. This choice of exposure was dictated by prior observations that, especially at lower output levels, the strongest cavitation activity in a gel, liquid, or ex vivo tissue was induced by the first (or the first few) HIFU pulses, and then decreased or disappeared due to “liquid strengthening” or “nuclei conditioning” [20]. This is generally not observed in vivo, where cavitation sporadically initiates and disappears throughout the exposure, potentially due to the renewal of nuclei with circulation and other physiological processes. Thus, the intent in this work was to examine the response of “unconditioned” nuclei to a HIFU pulse.
The first key observation was that cavitation behavior was qualitatively distinct for quasi-linear and shock-containing waveforms: isolated, stationary, nearly spherical bubbles that grow to up to 90 microns in size, versus, proliferating bubbles that either translate up to hundred microns towards the transducer (axial proliferation), or form sparse bubble clouds up to 2 mm in size (fanned-out proliferation). This difference in behavior is very relevant to the ability for inducing mechanical tissue damage, the proliferating bubbles clearly being more destructive than the stationary ones due to the larger area that they cover. According to prior work on histotripsy-induced damage in agarose phantoms embedded with a thin layer of red blood cells (RBCs), the area of lysed RBCs corresponded well with the cross-sectional area of bubbles observed on high-speed photography, and was comparable to the damage produced subsequently in ex vivo kidney samples using the same exposure parameters [21]. In addition, due to the fact that the cumulative volume of proliferating bubbles is substantially larger than that of the isolated stationary ones, the bubbles are less likely to dissolve completely between HIFU pulses. This would provide cavitation nuclei for the subsequent pulses, thus enhancing cavitation persistence. It therefore appears important to ensure proliferating behavior in exposures used for pHIFU-based drug delivery, and to understand the underlying physical mechanism.
The candidate mechanism previously hypothesized as playing a role in the cavitation dynamics induced by shock-containing waveforms is the inversion of shock wave polarity during its reflection from bubbles acting as a pressure-release interface [18]. This effect has previously been demonstrated for histotripsy exposures that use very high peak negative pressures (20–25 MPa) and much shorter, microsecond long HIFU pulses [16]. The initiation of a histotripsy bubble cloud was shown to be contingent on the diameter of the initial bubble reaching ~50 μm - 100 μm and the presence of a high amplitude (over 80 MPa) shock front. Recently, this effect was also demonstrated to be responsible for prefocal cavitation cloud formation in another histotripsy approach – boiling histotripsy, which uses longer bursts of HIFU shock waves lasting a few milliseconds and of somewhat lower pressure amplitudes [22, 23]. Enhanced absorption at the shocks leads to local heating of tissue and creating a vapor bubble at the focus, which then acts as the pressure release interface. Similarly, the bubble cloud tends to form only if the vapor bubble size exceeds a certain threshold.
In the present work, both HIFU exposure parameters and the resulting bubble clouds were different from both shock-scattering and boiling histotripsy: the bubble clouds were sparse, i.e. individual bubbles did not merge into the dense, millimeter-sized cloud typical for histotripsy. Further, the clouds grew slowly in the present study, over the duration of the millisecond-long HIFU pulse, as opposed to transient cloud formation within a microseconds-long histotripsy pulse. However, the requirements for proliferating behavior that could be gleaned from high-speed photography observations, specifically Figs. 6, 7b, and 8, were remarkably similar to those of histotripsy cloud formation: growth of the originally nucleated bubble to a sufficiently large size (~60 μm – 120 μm depending on the frequency) and presence of a shock front in an asymmetrically distorted waveform (albeit of lower amplitude) at the focus. The two requirements, and associated implications for the mechanism, are discussed in more detail below, and the overall hypothesized mechanism is illustrated in Fig. 11.
Fig. 11.
Conceptual diagram of the hypothesized mechanism for bubble proliferation behavior.
The sizes of the originally nucleated, nearly spherical bubbles just before axial or fanned-out proliferation occurred were, on average, larger than those for the bubbles that remained stationary, according to Figs. 7–9. Importantly, from the measurements presented here it is not possible to define an exact bubble diameter threshold, beyond which proliferation will occur for a certain set of pHIFU parameters. Rather, the median bubble sizes presented here are statistical measures derived from overlapping size distributions of stationary and proliferating bubbles. However, they do appear to capture a trend that is consistent across all transducer parameters tested. Note that the observed range of bubble sizes (40–140 microns) significantly exceeds the resonant bubble sizes for the HIFU frequencies considered here (3–6 microns). The bubbles reach this size not within a single rarefactional phase of the HIFU wave (as is the case in shock-scattering histotripsy and microtripsy [18],[7]), but within tens to hundreds of HIFU cycles, with the growth being faster at higher acoustic output levels. One contributing mechanism to such gradual bubble growth could be the rectifying effect of a distorted HIFU waveform on bubble oscillations, wherein the bubble is more responsive to the longer-duration rarefactional phase than the shorter-duration compressional phase, and grows over each acoustic cycle as a result [24]. Bubble growth may also be caused by rectified diffusion of non-condensable gases, which can be enhanced by aspherical bubble motions that involve streaming of the surrounding fluid [25]. Moreover, aspherical collapses and jetting in response to an incident shock front typically involve less dissipation from acoustic radiation [26], which lead to larger bubble rebounds that would also enhance rectified diffusion. Notably, we observed that stiffer agarose gels were associated with prolonged growth phases but no changes in threshold pressure or bubble size just before proliferation. Because stiffer gels reduce bubble oscillation amplitudes, the prolonged growth phases suggest that some form of rectified growth may play a role in this stage of bubble proliferation with the rate of rectified growth positively correlated to the amplitude of bubble motion.
Shock wave scattering by the grown spherical bubble is the second important step of the proliferation process. After being reflected from the bubble, the shock wave’s polarity is inverted, thus effectively increasing p− immediately near the bubble and the possibility of nucleating additional bubbles. However, the shock amplitudes considered here were mostly (with the exception of the largest output exposures with the F- number = 0.77 transducer) insufficient to nucleate a histotripsy-like proximal layer of bubbles within a single acoustic cycle [7],[18], [22]. Instead, we speculate that repetitive shock scattering is increasing the local tension immediately adjacent to the bubble, which raises the probability of exceeding the cavitation threshold. Thus, even if initially low, the probability increases over time, i.e. over many acoustic cycles, and eventually an adjacent bubble is nucleated. Further, given that shock waves in this context represent sharp pressure changes over length scales very short relative to the size of the initial bubble, shocks will tend to induce aspherical bubble motions and behaviors such as jetting (with jets roughly aligned with the acoustic axis). Consequently, shocks may be associated with stresses and strains at the bubble wall that are directionally localized, thereby promoting damage to the gel proximal to the bubble gradually over multiple acoustic cycles and the formation of a proximal void in the gel into which the original bubble expands [27]. Thereafter, the deformed bubble splits into two or more bubbles and the process repeats itself on the proximal sides of the new bubbles. The activity of the original bubble (that remains distal) is influenced by the diffraction and/or shielding of the incident HIFU waves by the proximal bubbles: in some cases they disappear, in others they stay in place and may grow in size and merge with other proximal bubbles [28].
Interestingly, at higher HIFU frequencies, smaller bubbles were observed to initiate proliferative behavior (Fig. 8). Several confounding mechanisms could be responsible for this effect. Firstly, within the output range corresponding to shock formation, the harmonics contained in nonlinearly distorted waves are higher for the higher fundamental frequency, and smaller bubbles could act as pressure release interfaces for these harmonic components. Secondly, the pHIFU beam width is reduced at higher fundamental frequency, and the beam could potentially be more effectively reflected by smaller bubbles. Further, because the incident wave at higher frequency contains proportionately more shock fronts per unit time compared, it would contribute more efficiently to increasing local tension in front of the bubble after being reflected by it. In practical terms, one may think that higher HIFU frequencies would therefore be preferable for exposures aimed at tissue permeabilization, because shock formation would require lower output power (Table I), and bubbles would not need to grow as large to initiate proliferating behavior. However, at higher frequencies, the number of nucleated bubbles in any exposure was lower, and the bubbles within proliferating clouds were smaller and therefore less likely to induce tissue damage.
Proliferating bubble behavior could be identified optically in transparent tissue phantoms, but in order to enable the detection of such behavior in tissues, corresponding metrics for the PCD signal had to be identified. Because proliferating bubbles are shifting their position along the beam axis during the HIFU pulse with velocities reaching as high as 2.5 m/s, it was reasonable to assume that the HIFU harmonics backscattered from the bubbles would undergo Doppler shift. This was confirmed by detecting an overall high frequency shift in HIFU harmonic peaks, along with peak broadening due to a distribution in bubble velocities. These two spectral signatures of the PCD signal may be useful in identifying proliferating bubble behavior in in vivo tissue, as the shift far exceeds those associated with physiological motion.
The main limitation of this study is that, due to the frame rate and shutter speed achievable with the high-speed camera, the individual bubble collapses and their details (e.g. jetting, asymmetry) could not be temporally resolved. Thus the hypothesized mechanism for proliferating cavitation behaviors, although indirectly supported by the observations presented here, remains speculative. Further, how the observed cavitation behaviors will translate to tissue and tissue damage is an important open question that will be addressed in future studies. The Doppler shift of the backscattered pHIFU harmonics appears to represent a convenient metric for identifying bubble behavior types, but should be applied in tissue with caution. The agarose gel has minimal absorption and scattering compared to tissue, and tissue in the focal region is likely to undergo noticeable displacement due to radiation force, which could obscure the shift of the bubbles towards the transducer.
In conclusion, pHIFU waves containing shock fronts, even of moderate amplitude, can induce qualitatively distinct, more destructive cavitation behavior – gradual proliferation. This behavior was observed at lower acoustic output powers and peak focal pressures with less focused transducers (i.e., higher F-number) and attributed to the modified shock-scattering mechanism combined with rectified bubble growth when driven by a nonlinear HIFU wave and asymmetric bubble motions. The shift in backscattered HIFU harmonics detected by PCD allows detection of proliferating behavior within each HIFU pulse and thus provides a feedback parameter for treatment efficiency in applications such as drug delivery.
Supplementary Material
Acknowledgments
Manuscript received Day; accepted Day. The work was supported by the National Institutes of Health (R01 R01EB023910, K01DK104854, and R01EB7643) and Russian Science Foundation (RSF 20-12-00145).
Biography

Christopher R. Bawiec earned a B.S. degree in Electrical and Computer Engineering in 2005 at the University of Colorado at Boulder and a Ph.D. in Biomedical Engineering in 2015 at Drexel University in Philadelphia. He completed postdoctoral training as a Whitaker Scholar at the Laboratory of Therapeutic Applications of Ultrasound (LabTAU) in Lyon, France. He is currently a senior fellow at the University of Washington’s School of Medicine where he is pursuing his research interests in therapeutic and diagnostic ultrasound. phenomena.

Pavel B. Rosnitskiy received the M.S. degree in physics and Ph.D. degree in acoustics in 2016 and 2019, respectively, from Moscow State University (MSU), Moscow, Russia, where he is currently a Junior Research scientist in the Department of Medical Physics of the Physics Faculty. He was recognized for the best undergraduate student project (2013), the best M.S. thesis (2016), and as the best student of the Physics Faculty at MSU (2015). His current research interests include nonlinear acoustics and therapeutic applications of high intensity focused ultrasound waves with shocks.

Alex T. Peek earned a B.S. degree in Physics in 2014 at the University of California, Santa Barbara and a M.S. degree in Material Science and Engineering in 2017 at the University of Washington (UW). He is currently an ultrasound engineer at the Applied Physics Lab (APL) where he is pursuing interests in imaging and therapeutic ultrasound.

Adam D. Maxwell is currently a Research Assistant Professor in the Department of Urology at the University of Washington. He received a B.S. degree in electrical engineering from University of Washington in 2006, an M.S. degree in electrical engineering in 2007, and a Ph.D. in biomedical engineering in 2012, both from the University of Michigan. From 2012 to 2014, he was a postdoctoral fellow in the Department of Urology at the University of Washington. His research involves development of image-guided ultrasound therapies including focused ultrasound for mechanical tissue ablation (histotripsy) and lithotripsy.

Wayne Kreider Wayne Kreider earned B.S. and M.S. degrees in engineering mechanics at Virginia Tech, Blacksburg, VA, in 1993 and 1995, respectively. He is a licensed Professional Engineer in the Commonwealth of Virginia and has worked as an engineer at the Naval Surface Warfare Center (Dahlgren, VA) and at Dominion Engineering Inc. (Reston, VA). Since 2001, he has worked at the Center for Industrial and Medical Ultrasound in the Applied Physics Laboratory (APL) at the University of Washington in Seattle, completing a Ph.D. in bioengineering in 2008. His research interests include acoustic cavitation, transport processes in oscillating bubbles, therapeutic ultrasound, and ultrasound metrology.

Gail ter Haar is Professor of Therapy Ultrasound at The Institute of Cancer Research, London. She studied for her PhD in Physics at Guy’s Hospital, in London, holds a D.Sc. in clinical medicine from Oxford. Gail is founding President of the International Society for Therapy Ultrasound (ISTU). She is an honorary member of BMUS, honorary fellow of the American Institute for Ultrasound in Medicine, and fellow of the Acoustical Society of America and IPEM. Gail’s research interests have always lain primarily in understanding the way in which medical ultrasound interacts with tissue, especially the physical mechanisms involved in producing bio-effects (primarily heating & acoustic cavitation) with a view to understanding its safety when used in diagnosis, and to harnessing these effects for therapeutic benefit. Most recently her research has concentrated on developing devices and protocols for ultrasound based treatments of cancer.

Oleg A. Sapozhnikov received his M.S. degree in physics in 1985 and Ph.D. and D.Sc. degrees in acoustics in 1988 and 2008, respectively, from Moscow State University (MSU), Moscow, Russia. He is currently a Professor in the Department of Acoustics of the Physics Faculty of MSU. Since 1996, he is also affiliated with the Center for Industrial and Medical Ultrasound in the Applied Physics Laboratory at the University of Washington. His research interests are physical acoustics, nonlinear wave phenomena, medical ultrasound including shock wave lithotripsy, high intensity focused ultrasound, and ultrasound-based imaging.

Vera A. Khokhlova received the M.S. degree in physics in 1986 and Ph.D. and D.Sc. degrees in acoustics in 1991 and 2012, respectively, from Moscow State University (MSU), Moscow, Russia. After graduation from the Ph.D. program she was appointed by the Moscow State University and currently is an Associate Professor at the Department of Acoustics of the Physics Faculty of MSU. Starting from 1995 she is also affiliated with the Center for Industrial and Medical Ultrasound of the Applied Physics Laboratory (APL) at the University of Washington in Seattle. Her research interests are in the field of nonlinear acoustics, therapeutic ultrasound including metrology and bioeffects of high intensity focused ultrasound fields, shock wave focusing, nonlinear wave propagation in inhomogeneous media, and nonlinear modeling.

Tatiana D. Khokhlova received her Ph.D. degree in physics in 2008 from Moscow State University (MSU), Moscow, Russia. After graduation from the Ph.D. program Dr. Khokhlova moved to the University of Washington (UW) in Seattle for postdoctoral training at Applied Physics Laboratory, and then completed a research fellowship at the Department of Medicine, UW. Dr. Khokhlova is currently Research Associate Professor at the Department of Medicine, UW. Her research interests are in physical acoustics, therapeutic ultrasound and photoacoustic imaging.
Contributor Information
Christopher R. Bawiec, University of Washington School of Medicine, Division of Gastroenterology, Seattle, WA
Pavel B. Rosnitskiy, Physics Faculty, Moscow State University, Moscow, Russia
Alex T. Peek, Center for Industrial and Medical Ultrasound, Applied Physics Laboratory, University of Washington, Seattle WA
Adam D. Maxwell, Center for Industrial and Medical Ultrasound, Applied Physics Laboratory, University of Washington, Seattle WA
Wayne Kreider, Center for Industrial and Medical Ultrasound, Applied Physics Laboratory, University of Washington, Seattle WA.
Gail R ter Haar, Division of Radiotherapy and Imaging, The Institute of Cancer Research, London, UK.
Oleg A. Sapozhnikov, Physics Faculty, Moscow State University, Moscow, Russia Center for Industrial and Medical Ultrasound, Applied Physics Laboratory, University of Washington, Seattle WA.
Vera A. Khokhlova, Physics Faculty, Moscow State University, Moscow, Russia Center for Industrial and Medical Ultrasound, Applied Physics Laboratory, University of Washington, Seattle WA.
Tatiana D. Khokhlova, University of Washington School of Medicine, Division of Gastroenterology, Seattle, WA
REFERENCES
- [1].Lammers T, Kiessling F, Hennink WE, and Storm G, “Drug targeting to tumors: principles, pitfalls and (pre-) clinical progress,” J. Control. Release, vol. 161, no. 2, pp.175–87, 2012. [DOI] [PubMed] [Google Scholar]
- [2].Tran DM, Zhang F, Morrison KP, Loeb KR, Harrang J, Kajimoto M, Chavez F, Wu L, and Miao CH. “Transcutaneous Ultrasound-Mediated Nonviral Gene Delivery to the Liver in a Porcine Model,” Mol Ther Methods Clin Dev., vol.26, no.14, pp. 275–284, 2019. [DOI] [PMC free article] [PubMed] [Google Scholar]
- [3].Li T, Wang YN, Khokhlova TD, D’Andrea S, Starr F, Chen H, McCune JS, Risler LJ, Mashadi-Hossein A, and Hwang JH “Pulsed high-intensity focused ultrasound enhances delivery of doxorubicin in a preclinical model of pancreatic cancer,” Cancer Res., vol. 75, no. 18, pp. 3738–3746, 2015. [DOI] [PMC free article] [PubMed] [Google Scholar]
- [4].Zhou Y, Wang YN, Farr N, Zia J, Chen H, Ko BM, Khokhlova T, Li T, and Hwang JH “Enhancement of Small Molecule Delivery by Pulsed High-Intensity Focused Ultrasound: A Parameter Exploration,” Ultrasound Med. Biol, vol. 42, no.4, pp. 956–63, 2016. [DOI] [PMC free article] [PubMed] [Google Scholar]
- [5].Bollen V, Hendley SA, Paul JD, Maxwell AD, Haworth KJ, Holland CK, Bader KB “In Vitro Thrombolytic Efficacy of Single- and Five-Cycle Histotripsy Pulses and rt-PA,” Ultrasound Med Biol. vol.46, no.2, pp. 336–349, 2020. [DOI] [PMC free article] [PubMed] [Google Scholar]
- [6].Haller J, and Wilkens V “Determination of Acoustic Cavitation Probabilities and Thresholds Using a Single Focusing Transducer to Induce and Detect Acoustic Cavitation Events: II. Systematic Investigation in an Agar Material,” Ultrasound Med. Biol vol 44, no.2, pp. 397–415, 2018. [DOI] [PubMed] [Google Scholar]
- [7].Maxwell AD, Cain CA, Hall TL, Fowlkes JB, and Xu Z “Probability of cavitation for single ultrasound pulses applied to tissues and tissue-mimicking materials,” Ultrasound Med. Biol, vol.39, pp.449–465, 2013. [DOI] [PMC free article] [PubMed] [Google Scholar]
- [8].Li T, Chen H, Khokhlova T, Wang Y-N, Kreider W, He X, and Hwang JH, “Passive cavitation detection during pulsed HIFU exposures of ex vivo tissues and in vivo mouse pancreatic tumors,” Ultrasound Med. Biol. vol. 40, no.7, pp. 1523–34, 2014. [DOI] [PMC free article] [PubMed] [Google Scholar]
- [9].Lin KW, Hall TL, McGough RJ, Xu Z, Cain CA. “Synthesis of monopolar ultrasound pulses for therapy: the frequency-compounding transducer”, IEEE Trans Ultrason Ferroelectr Freq Control, vol. 61, no. 7, pp.1123–36, 2014. [DOI] [PubMed] [Google Scholar]
- [10].Khokhlova T, Rosnitskiy P, Hunter C, Maxwell A, Kreider W, Ter Haar G, Costa M, Sapozhnikov O, and Khokhlova V “Dependence of inertial cavitation induced by high intensity focused ultrasound on transducer F-number and nonlinear waveform distortion,” J Acoust Soc Am, vol 144, no.3, pp.1160–1169, 2018. [DOI] [PMC free article] [PubMed] [Google Scholar]
- [11].Rosnitskiy PB, Yuldashev PV, Sapozhnikov OA, Maxwell AD, Kreider W, Bailey MR, and Khokhlova VA, “Design of HIFU Transducers for Generating Specified Nonlinear Ultrasound Fields,” IEEE Trans. Ultrason., Ferroelect., Freq. Control, vol. 64, no. 2, pp. 374–390, 2017. [DOI] [PMC free article] [PubMed] [Google Scholar]
- [12].Kim Y, Maxwell AD, Hall TL, Xu Z, Lin KW, Cain CA, “Rapid prototyping fabrication of focused ultrasound transducers,” IEEE Trans. Ultrason., Ferroelect., Freq. Control vol 27, no.9, pp 1559–74, 2014. [DOI] [PubMed] [Google Scholar]
- [13].Maxwell AD, Yuldashev PV, Kreider W, Khokhlova TD, Schade GR, Hall TL, Sapozhnikov OA, Bailey MR, and Khokhlova VA “A Prototype Therapy System for Transcutaneous Application of Boiling Histotripsy,” IEEE Trans. Ultrason. Ferroelectr. Freq. Control vol. 64, no 10, pp. 1542–1557, 2017. [DOI] [PMC free article] [PubMed] [Google Scholar]
- [14].Khokhlova TD, Haider YA, Maxwell AD, Kreider W, Bailey MR, Khokhlova VA “ Dependence of Boiling Histotripsy Treatment Efficiency on HIFU Frequency and Focal Pressure Levels,” Ultrasound Med Biol, vol. 43, no. 9, pp. 1975–1985, 2017. [DOI] [PMC free article] [PubMed] [Google Scholar]
- [15].Maruvada S, Harris GR, Herman BA, and King RI “Acoustic power calibration of high-intensity focused ultrasound transducers using a radiation force technique,” J. Acoust. Soc. Am, vol 121, no 3, pp. 1434–9, 2007. [DOI] [PubMed] [Google Scholar]
- [16].Choi I, Shield RT “Second-order effects in problems for a class of elastic materials,” Z Angew Math Phys, vol. 32, pp. 361–381, 1982. [Google Scholar]
- [17].Gonzalez RC, Woods RE, and Eddins SL, Digital Image Processing Using MATLAB, New Jersey, Pearson Prentice Hall, 2004. [Google Scholar]
- [18].Maxwell AD, Wang TY, Cain CA, Fowlkes JB, Sapozhnikov OA, Bailey MR, and Xu Z “Cavitation clouds created by shock scattering from bubbles during histotripsy,” J. Acoust. Soc. Am vol. 130, no 4, pp. 1888–98, 2011. [DOI] [PMC free article] [PubMed] [Google Scholar]
- [19].Vlaisavljevich E, Gerhardson T, Hall T, Xu Z. “Effects of f-number on the histotripsy intrinsic threshold and cavitation bubble cloud behavior,” Phys Med Biol. vol.62, no.4, pp. 1269–1290, 2017. [DOI] [PMC free article] [PubMed] [Google Scholar]
- [20].Wang TY, Xu Z, Hall T, Fowlkes J, Roberts W, and Cain C “Active focal zone sharpening for high-precision treatment using histotripsy,” IEEE Trans. Ultrason. Ferroelectr. Freq. Control vol. 58, no.2, pp. 305–15, 2011. [DOI] [PMC free article] [PubMed] [Google Scholar]
- [21].Maxwell AD, Wang TY, Yuan L, Duryea AP, Xu Z, Cain CA “A tissue phantom for visualization and measurement of ultrasound-induced cavitation damage,” Ultrasound Med Biol vol 36, no 12, pp. 2132–43, 2010. [DOI] [PMC free article] [PubMed] [Google Scholar]
- [22].Pahk KJ, Lee S, Gélat P, de Andrade MO, Saffari N “The interaction of shockwaves with a vapour bubble in boiling histotripsy: The shock scattering effect,” Ultrason Sonochem. vol. 70, pp.105312, 2021. [DOI] [PMC free article] [PubMed] [Google Scholar]
- [23].Pahk KJ “Evidence of the formation of the shock scattering induced violent cavitation cluster during boiling histotripsy insonation: A numerical case study,” Journal of Physics: Conference Series. vol. 1761, pp. 012006, 2021. [Google Scholar]
- [24].Kreider W, Maxwell AD, Khokhlova T, Simon JC, Khokhlova VA, Sapozhnikov O, and Bailey MR “Rectified growth of histotripsy bubbles,” Proc. Meet. Acoust vol. 19, no. 1, 2013. [DOI] [PMC free article] [PubMed] [Google Scholar]
- [25].Church CC “A method to account for acoustic microstreaming when predicting bubble growth rates produced by rectified diffusion,” J. Acoust. Soc. Am vol 84, no.5, pp.1758–1764, 1988. [DOI] [PubMed] [Google Scholar]
- [26].Johnsen E and Colonius T “Numerical simulations of non-spherical bubble collapse,” J. Fluid. Mech vol 629, pp. 231–262, 2009. [DOI] [PMC free article] [PubMed] [Google Scholar]
- [27].Movahed P, Kreider W, Maxwell AD, Dunmire B, Freund JB. “Ultrasound-Induced Bubble Clusters in Tissue-Mimicking Agar Phantoms,” Ultrasound Med Biol. vol 43, no.10, pp. 2318–2328, 2017. [DOI] [PMC free article] [PubMed] [Google Scholar]
- [28].Pahk KJ, Gélat P, Sinden D, Dhar DK, and Saffari N “Numerical and Experimental Study of Mechanisms Involved in Boiling Histotripsy,” Ultrasound Med Biol. vol 43, no. 12, pp. 2848–2861, 2017. [DOI] [PubMed] [Google Scholar]
Associated Data
This section collects any data citations, data availability statements, or supplementary materials included in this article.


