

Abstract
Early childhood is characterized by vast changes in behaviors supported by the hippocampus and an increased susceptibility of the hippocampus to environmental influences. Thus, it is an important time to investigate the development of the hippocampus. Existing research suggests subregions of the hippocampus (i.e., head, body, tail) have dissociable functions and that the relations between subregions and cognitive abilities vary across development. However, longitudinal research examining age-related changes in subregions in humans, particularly during early childhood (i.e., 4–6 years), is limited. Using a large sample of 184 healthy 4- to 8-year-old children, the present study is the first to characterize developmental changes in hippocampal subregion volume from early- to mid-childhood. Results reveal differential developmental trajectories in hippocampal head, body, and tail during this period. Specifically, head volume showed a quadratic pattern of change, and both body and tail showed linear increases, resulting in a pattern of cubic change for total hippocampal volume. Further, main effects of sex on hippocampal volume (males > females) and hemispheric differences in developmental trajectories were observed. These findings provide an improved understanding of the development of the hippocampus and have important implications for research investigating a range of cognitive abilities and behaviors.
Keywords: development, hippocampal subregions, volumetric changes, longitudinal
Introduction
The hippocampus plays a role in a range of cognitive and emotional processes that are important for survival and daily functioning (Olsen, Moses, Riggs, & Ryan, 2012), including episodic memory, (Milner, Corkin, & Teuber, 1968; Squire & Wixted, 2011; Vargha–Khadem et al., 1997), language processing (Duff & Brown-Schmidt, 2017), and social and emotional processing (Immordino-Yang & Singh, 2013). This structure also shows heightened plasticity and susceptibility to environmental influences compared to other regions in the brain. For example, the hippocampus has been shown to be impacted by the psychosocial stress associated with maltreatment (Teicher, Anderson, & Polcari, 2012) and also by more typical variations in caregiving (Blankenship, Chad-Friedman, Riggins, & Dougherty, 2019; Humphreys et al., 2019; Luby et al., 2012; Rao et al., 2010). Moreover, research suggests this plasticity is greatest during early childhood (see Tottenham & Sheridan, 2010 for review). Although much research has been devoted to understanding behaviors and factors associated with the hippocampus, research is still needed to characterize the typical developmental trajectory of this structure, particularly in early childhood, when vast changes are observed in the behaviors it supports and when the hippocampus is susceptible to environmental influences.
Hippocampal Development
Cross-sectional and longitudinal work investigating the structural development of the hippocampus as a whole from early childhood (i.e., 4–6 years) into adulthood has yielded mixed results. Some studies report no change in total hippocampal volume after age 4 (e.g., Gogtay et al., 2006) or longitudinal decreases in volume (Tamnes et al., 2013). Other studies report increases in volume based on cross-sectional (DeMaster, Pathman, Lee, & Ghetti, 2014), and longitudinal (Østby, Tamnes, Fjell, & Walhovd, 2011) data. Still, findings from other studies suggest more complex trends. For example, in a cross-sectional study examining 3- to 20-year-olds, results revealed a quadratic inverted U-shaped trajectory with age-related increases in volume observed until adolescence followed by smaller volumes into adulthood (Brown & Jernigan, 2012). In a longitudinal study examining children and adults, ages 8 to 26 years, a cubic trajectory was reported, with increases in volume from age 8 until late-childhood and early adolescence, followed by decelerating decreases in volume into later adolescence and adulthood (Tamnes, Bos, van de Kamp, Peters, & Crone, 2018; also see Uematsu et al., 2012). It remains unclear what accounts for the heterogeneous nature of these findings, but it may be due to variations in the age groups investigated, differences in the way intracranial volume is controlled, or the investigation of the hippocampus as a unitary structure.
Hippocampal Subregion Development
Although there are several ways to divide the hippocampus based on both animal and human research, one method often used in human MRI research involves dividing the hippocampus along its longitudinal axis into subregions, including the head, body, and tail (e.g., Poppenk, Evensmoen, Moscovitch, & Nadel, 2013). Subregions of the hippocampus are thought to have differential functional relevance because of their structural and functional connections with different cortical and subcortical brain regions (Amaral & Lavenex, 2007; Duvernoy, 2005; Poppenk et al., 2013; Poppenk & Moscovitch, 2011; Small, 2002; Strange, Witter, Lein, & Moser, 2014). Across development, both structural and functional connectivity between the hippocampus and cortical regions vary with age (e.g., Blankenship, Redcay, Dougherty, & Riggins, 2017; for review see Ghetti & Bunge, 2012; Geng, Redcay, & Riggins, 2019; Wendelken et al., 2015) and relates to performance on episodic memory tasks (e.g., Geng et al., 2019; Ngo et al., 2017).
Structural development (i.e., volume) of hippocampal subregions is also thought to be meaningful to understanding behavior. Specifically, volumes of subregions exhibit differential associations with measures of episodic memory in child (DeMaster et al., 2014; Riggins, Blankenship, Mulligan, Rice, & Redcay, 2015; Riggins et al., 2018) and adult samples (Poppenk & Moscovitch, 2011; Rajah, Kromas, Han, & Pruessner, 2010). For example, when comparing relations between performance on an episodic memory task and hippocampal subregion volume in 8- to 11-year-old children and adults, better performance was associated with smaller right hippocampal head and larger hippocampal body volume in adults, but larger left hippocampal tail volume in children (DeMaster et al., 2014). Consequently, examining the hippocampus as a whole ignores the heterogeneity of this structure, and may mask important developmental change in specific subregions.
Unfortunately, only a limited number of studies have examined the structural development of hippocampal subregions. Although direct comparisons of results are difficult due to differences in age range and methodology (i.e., segmentation of subregions and the adjustment of volumes to account for intracranial volume), in general, results suggest differential developmental trajectories of subregions in both cross-sectional and longitudinal samples (Daugherty, Flinn, & Ofen, 2017; DeMaster et al., 2014; Fjell et al., 2019; Gogtay et al., 2006; Lee et al., 2020; Schlichting, Guarino, Schapiro, Turk-Browne, & Preston, 2017). Overall, developmental studies have reported age-related variations in head and body volumes and minor age-related variations in volume of the tail (Daugherty et al., 2017; Lee et al., 2020; Riggins et al., 2018; Schlichting et al., 2017). Cross-sectional studies show mixed findings for age-related differences in volume of head and body. Specifically, for hippocampal head volume cross-sectional studies report positive age-related associations (DeMaster et al., 2014; Riggins et al., 2018), negative age-related associations (Schlichting et al., 2017), and no age-related associations (Daugherty et al., 2017; Riggins, Geng, Blankenship, & Redcay, 2016). For hippocampal body volume, some studies report non-linear age-related associations, with smaller body volumes from childhood through adolescence and larger volumes into adulthood (Daugherty et al., 2017; Schlichting et al., 2017). Other studies report no age-related differences in body volume (Riggins et al., 2016, 2018). These mixed findings may be due to the variation in ages considered. In addition, they may be partially due to the fact that certain studies include sex as a factor, while other studies do not include it or simply include it as a covariate. Studies that do take sex into account have reported larger hippocampal head volumes in males (Riggins et al., 2018), a trend that has also been shown with total hippocampal volume in children (Tamnes et al., 2018).
Sex Differences in the Hippocampus
Across development, sex effects are apparent in the hippocampus (for review see Kaczkurkin, Raznahan, & Satterthwaite, 2018). The few studies that report sex differences in hippocampal volume in children indicate larger volumes in males compared to females, even after accounting for differences in overall head size (e.g., Riggins et al., 2018; Tamnes et al., 2018). These effects may arise from either differences in sex-hormones or sex-receptors (Giedd, Castellanos, Rajapakse, Vaituzis, & Rapoport, 1997; Marrocco & McEwen, 2016), as well as neurotransmitters and other cellular mediators (McEwen, Nasca, & Gray, 2016). The influence of sex hormones during early development has been proposed as particularly important to sex differences observed in hippocampal volume in adults (Goldstein et al., 2001). Research in older children (10–12 years) has further documented sex-specific differences in hippocampal volume that relate to levels of circulating sex hormones (Bramen et al., 2011; 8–15 years, Neufang et al., 2009). An understanding of sex differences earlier in development (prior to 8 years of age) is needed to connect with this and other research examining changes in hippocampal development as children transition into puberty and beyond. Furthermore, sex effects are important to investigate as they are thought to be associated with observed sex differences in age of onset, prevalence, and symptomatology in many neurodevelopmental disorders (Giedd et al., 1997).
Longitudinal Approach
While cross-sectional studies examining the development of the hippocampus have enriched our understanding of this structure in childhood, the use of longitudinal methods is underutilized, especially early in development. Longitudinal research can provide some clarity to the mixed results reported in cross-sectional studies assessing subregion development. Crucially, longitudinal samples are not impacted by between subject variability to the same extent as cross-sectional samples and allow researchers to ask questions about both intra- and inter-individual changes, which is at the heart of most developmental questions. The first longitudinal study examining hippocampal subregion development between 4- to 25-years reported decreases in anterior (i.e., head) hippocampal volume and increases in posterior (i.e., combination of body and tail) hippocampal volume (Gogtay et al., 2006). However, the number of young children (i.e., 4-year-olds) included in this sample was relatively small given the wide age-range covered. In addition, body and tail volumes were not examined separately. A recent study examining the development of hippocampal subregions in 7- to 15-year-olds, reported peak hippocampal head volume at 8 years, followed by decreases in volume. Interestingly, these decreases were greatest the older the participants were at study entry (e.g., children enrolled at 12 years of age showed greater decreases at subsequent visits compared to children who were enrolled at 7 years of age; Lee et al., 2020). This study also demonstrated increases in hippocampal body volume through mid to-late childhood (i.e., 8–12 years) followed by decreases into adolescence, and no significant changes in tail volume. As such, additional longitudinal research is needed during early childhood to fully grasp the development of hippocampal subregions.
Current Study
Although extant research including young children is limited, studies suggest differential trajectories in subregions of the hippocampus. Characterizing developmental trajectories of hippocampal subregions is important for providing an improved understanding of typical changes across development and how changes in this structure support cognitive development. To the best of our knowledge, no study has examined changes in hippocampal subregions during the period of early- to mid-childhood (although Gogtay et al., 2006 included few 4-year-olds in their larger age range). Furthermore, few cross-sectional studies and no longitudinal studies in early childhood (i.e., 4–6 years) have examined effects of sex or hemispheric differences in subregion development. Inclusion of these factors may provide further clarity to mixed findings in the current literature. The present study utilized a longitudinal sample of 4- to 8-year-olds to characterize patterns of hippocampal development along the anterior/posterior axis in early- to mid-childhood. In order to best characterize the development of the hippocampus, developmental trajectories of hippocampal subregions were examined bilaterally, by hemisphere, and by sex. To draw connections to previous studies that examine developmental changes in the hippocampus, the trajectory of total hippocampal volume was also examined. Findings have the potential to inform not only research focused on brain development, but also research seeking to understand development of cognitive processes related to the hippocampus.
Method
Participants
The current study was part of a larger research project examining the development of the brain in relation to memory during early- to mid-childhood. Prior to data collection, all methods were approved by the University Institutional Review Board. Cross-sectional analyses examining age-related differences in hippocampal subregions from the initial time-point are reported in Riggins et al. (2018). This report examines age-related changes in subregions over time using the longitudinal sample.
A total of 200 4- to 8-year-old children (100 females) participated in the current study. A cohort-sequential (i.e., accelerated longitudinal) design with three time-points was employed with cohorts overlapping at age 6 in order to mimic a longer longitudinal trajectory (Duncan, Duncan, & Hops, 1996). Younger age groups were oversampled to ensure enough usable data would be available. See Figure 1 for the number of scans provided and average age per time-point for each cohort.
Figure 1.
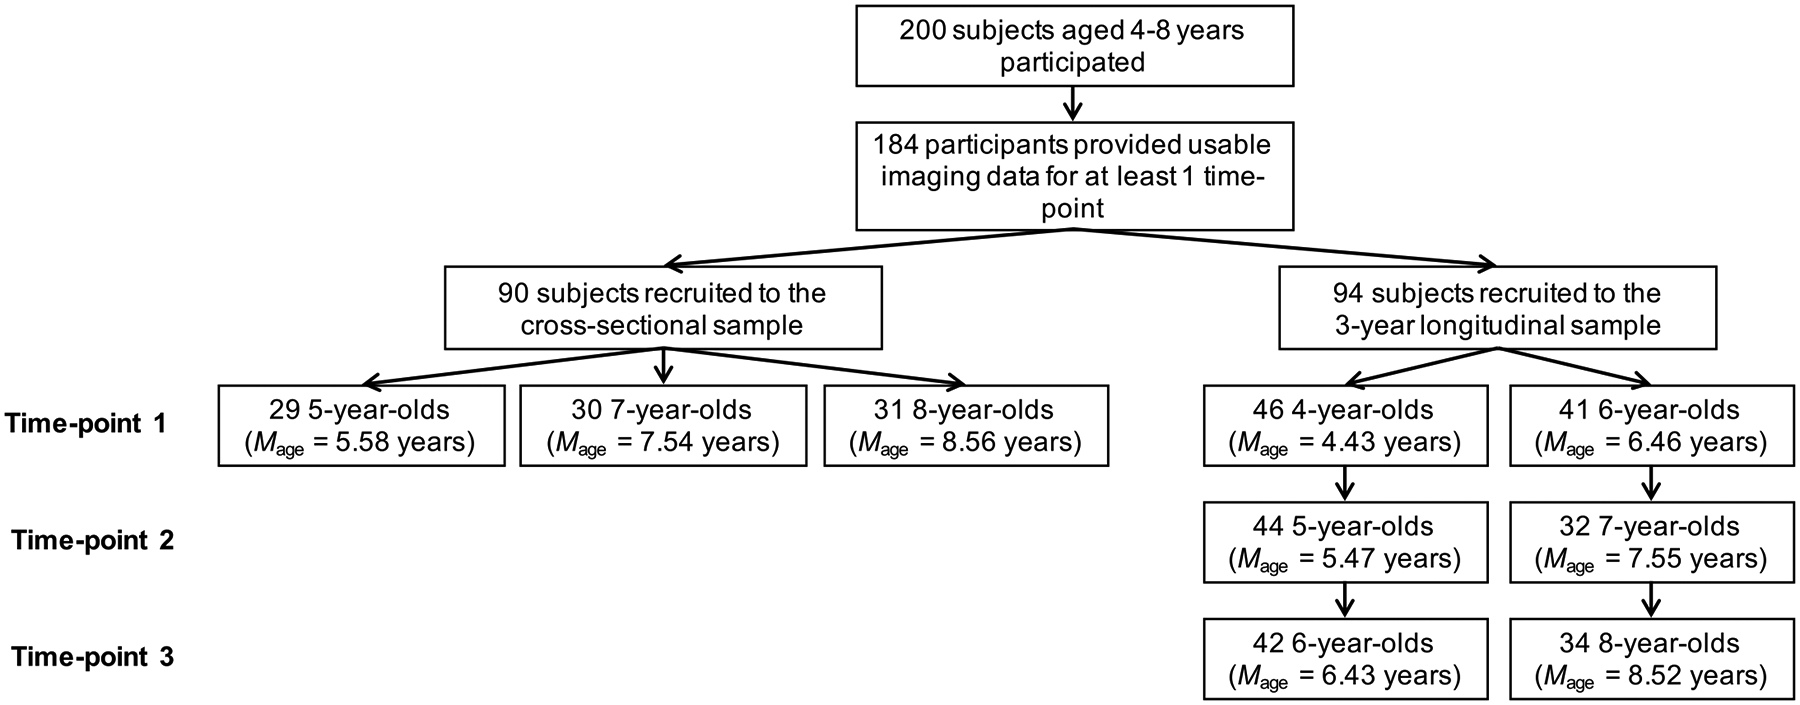
Flow chart showing the number of participants and average age of participants providing data at each time-point by cohort. Note. 7 participants did not provide usable data at time-point 1 but did at time-point 2 and/or time-point 3.
In brief, of the 200 children that participated in the current study, 184 participants provided useable neuroimaging data at least at one time-point. The total number of scans across these individuals was 329. Specifically, 102 participants provided neuroimaging data at 1 time-point, 19 at 2 time-points, and 63 at 3 time-points. Seven participants did not provide usable data at time-point 1 but did at time-point 2 and/or time-point 3. See Table 1 for further information about the number and age of participants at each time point and the interval between each time point.
Table 1.
Descriptive statistics for age of participants at each time-point and time between visits.
| Time-point | Age Range1 | Age1 M (SD) | N (females) participants | Time between scans1 M (SD) | Range between scans1 |
|---|---|---|---|---|---|
| 1 | 4.02–8.97 | 6.34 (1.50) | 177 (86) | - | - |
| 2 | 5.04–8.05 | 6.35 (1.08) | 76 (40) | 1.04 (.09) | .96 – 1.40 |
| 3 | 6.02–9.55 | 7.37 (1.09) | 76 (43) | .98 (.11) | .58 – 1.50 |
Note. N = number of participants. M = mean. SD = standard deviation.
Measured in years.
The final sample of 184 participants (89 females) was approximately 57% Caucasian, 13% African American, 5% Asian, and 19% Multiracial from middle- to high-income households (median = >$105,000, range = < $15,000 - >$105,000). An additional 5% of parents did not disclose their child’s race and 4% did not disclose income. 89% of the sample had at least one parent who attended a four-year college. Children were screened via caregiver self-report to ensure they were not born premature (via gestational age), had normal or corrected-to-normal vision, and had no diagnosis for any neurological conditions, developmental delays, or disabilities. Participants’ general cognitive ability was assessed at time-point 1 via age-appropriate standardized intelligence tests. The Wechsler Preschool and Primary Scale of Intelligence-Fourth Edition (WPPSI-IV; Wechsler, 2012) was administered to 4- and 5-year-olds and the Wechsler Intelligence Scale for Children-Fourth Edition (WISC-IV; Wechsler, 2003) was administered to 6-, 7-, and 8-year-olds. Participant’s scaled scores on the Block Design (M(SD) = 11.58(2.96)) and Vocabulary (M(SD) = 13.34(2.83)) subtests were within the normative range. Informed consent was obtained from parents, and written assent was obtained from children older than 7 years.
MRI Acquisition
Children first took part in a mock scan where they practiced lying still and were given motion feedback by the experimenter. The mock scan also enabled the children to get comfortable with the scanning environment. Following the mock scan, children completed the actual scan. To further mitigate effects of motion, padding was placed around children’s heads during the scan. This minimized head movements. Participants were scanned in a Siemens 3.0 T scanner (MAGNETOM Trio Tim System, Siemens Medical Solutions, Erlangen, Germany) with a 32-channel coil. During the scan, children watched a movie of their choosing to further enhance compliance. A high resolution T1 magnetization-prepared rapid gradient-echo (MPRAGE) sequence of 176 contiguous sagittal slices was used to collect data (4:26 minute acquisition time, .9 mm isotropic voxel size; 1900 ms TR; 2.32 ms TE; 900 ms inversion time; 9-degree flip angle; 256 × 256 pixel matrix). To ensure high data quality, images were checked immediately following the scan. If the quality of the image was deemed to be too low (as indicated by banding or a significantly blurred image), the scan was repeated.
MRI Analysis
Freesurfer (Version 5.1.0) was used for structural data analysis. Freesurfer is a standard automatic segmentation program that has been shown to be appropriate for use in children as young as 4 years of age (Ghosh et al., 2010). Preprocessing of structural T1-weighted images is automated using Freesurfer, and consists of skull stripping, image registration, motion correction, smoothing, and subcortical segmentation, among other preprocessing steps. Images were aligned to the anterior-posterior commissure, which makes it possible to visually inspect the hippocampal segmentations without the issues that are induced by reorientation. Images were inspected for quality, and scans with significant banding were excluded from data analysis. 9 scans were excluded at time-point 1, 4 scans were excluded at time-point 2, and 1 scan was excluded at time-point 3.
Hippocampal Subregion Delineation and Extraction
The hippocampus was identified in the subcortical segmentation generated by Freesurfer. Next, Automatic Segmentation Adapter Tool (ASAT, nitrc.org/projects/segadapter; Wang et al., 2011) was used to refine hippocampal segmentations. Each hemisphere was visually inspected for accuracy and manual edits were conducted when necessary. Specifically, for minor errors (e.g., small deviation in border), edits were only made if the error persisted for 7 slices or more. The majority of errors observed could be classified as these minor errors. However, we did observe larger errors for a small number of subjects (i.e., large portion of the hippocampus was misidentified). When this occurred, we corrected the error by making manual edits even if the error did not persist for 7 slices. Manual edits were applied to 58 scans. Manual edits were completed by an experienced reviewer (MB). Next, the hippocampus was divided into subregions using anatomical landmarks. The last slice of the head was identified as the slice before the uncal apex was visible. All slices prior to that slice were identified as the head (Weiss, DeWitt, Goff, Ditman, & Heckers, 2005). The first slice of the tail was identified as the first slice were the fornix separates from the hippocampus and becomes visible (Watson et al., 1992). The body was defined as all slices between the head and the tail. Two independent coders determined subregion slice boundaries. Coders were blind to participant age and sex. Reliability on a subset of 186 scans was high. There was 94.60% agreement within 1 slice and 99.99% agreement within 2 slices for identification of anatomical landmarks. Intra-class correlation coefficients were between .897 and .985. The hippocampus that was refined by ASAT was then segmented into head, body, and tail based on the slice boundaries and volumes were extracted using Freesurfer. Intracranial volume (ICV) was also estimated and extracted using Freesurfer. Analyses were first conducted on bilateral volumes, collapsed across hemisphere, and then for left and right hemispheres separately.
Adjustment for Intracranial Volume
Hippocampal volumes were adjusted for ICV to ensure that differences observed with age were not simply the result of differences in overall head size. The adjustment was done using an analysis of covariance approach (Raz et al., 2005). Age and sex were used to estimate ICV values using the following formula (adjusted volume = raw volume – b * (ICV – predicted ICV, see Keresztes et al., 2017)). Separate adjustments were performed for each wave of data collection. Results were examined with raw volumes first and then with adjusted volumes. Given the similarity between results for raw versus adjusted volumes, only the latter are reported.
Statistical Analyses
Mixed effect models were used to investigate developmental trajectories of hippocampal subregions during early- to mid-childhood. Statistical analyses were performed using the package nlme (Pinheiro et al., 2019) in R 3.5.2 (https://www.r-project.org). Visualization of the data was accomplished using the R package ggplot2 (Wickham, 2016).
Mixed effect models can estimate within-individual change over time as well as between-individual differences in mean levels over time and the predictors of these differences (Ghisletta & Lindenberger, 2004). Crucially, they allow for missing data (i.e., incomplete) and irregular intervals between measurements or number of measurements data (i.e., unbalanced; Ghisletta & Lindenberger, 2004). Consequently, mixed-effect modeling has been widely used (e.g., Vijayakumar, Mills, Alexander-Bloch, Tamnes, & Whittle, 2018) and is well-suited to the present study as it includes planned missingness, and subjects who did not provide all data, either due to attrition or due to lack of data quality.
These models presuppose that in addition to a group level intercept and slope that characterizes the growth function, each subject has an intercept and slope that may deviate from the group values (Ghisletta, Renaud, Jacot, & Courvoisier, 2015). In mixed effect models, fixed effects are the estimated parameters in the model whose value is common to all individuals. The extent to which individuals deviate from these common values is estimated by random effects that can vary across individual subjects. The inclusion of a random effect of subject allows the model to account for effects at the individual level, and the correlation of the repeated measurements over time (Burton, Gurrin, & Sly, 1998).
In the present study, mixed effect models were used to estimate the fixed effects of measured variables (e.g., age and sex) on hippocampal volume while including within-person variation as a random effect. This approach focused on characterizing age-related changes in hippocampal subfields and main effects of sex, however the effects of sex on overall developmental growth were not examined. To identify growth functions that best characterized developmental trajectories of the hippocampus and its subregions, formal model testing procedures using likelihood ratio tests and fit indices were used (see Herting et al., 2018; Selmeczy, Fandakova, Grimm, Bunge, & Ghetti, 2018; Tamnes et al., 2018 for similar approaches). Models with lower Bayesian Information Criterion (BIC) values were considered to better fit the data. Model comparisons were conducted to test whether the inclusion of linear and higher-order polynomial terms increased model fit over the previous lower-order models (e.g., a linear model compared to the null model). For hippocampal subregion and total hippocampal volume, a null model (i.e., unconditional mean) was first estimated with a random subject intercept and no effect of age. Models with a linear age effect were then assessed, followed by a quadratic age effect, and finally a cubic age effect in order to compare possible patterns of change. Age was centered, and thus intercepts were estimated at the average age of the entire sample (6.55 years). For models in which there was a significant effect of age, we assessed whether inclusion of a random subject slope improved model fit. Finally, a main effect of sex was added to the best fitting age model and the model tested for improved fit.
To ensure that cohort differences did not impact the estimation of developmental trajectories, trajectory convergence was tested using the method outlined by Miyazaki and Raudenbush (2000). Briefly, likelihood ratio tests were conducted comparing models estimating separate mean trajectories for each cohort to models with a common trajectory for each cohort. Results of these comparisons support the assumption that the cohorts followed the same developmental trajectory; therefore, only models omitting cohort effects are reported. Estimation of the reported model parameters used restricted maximum likelihood (REML), while model comparisons used maximum likelihood (ML).
Finally, analyses were reconducted including only those subjects who provided longitudinal data (i.e., data at more than one time-point, n = 82). Results were similar to those reported in the full sample, with one exception. Age-related changes in total and right hippocampal body volume were not observed. Given this difference, additional caution should be taken when considering results examining the development of hippocampal body.
Results
See Table 2 for likelihood ratio tests, Table 3 for a summary of the model comparisons, and Table 4 for a summary of final model parameters.
Table 2.
Bayesian Information Criterion (BIC) values for the unconditional means models and age models for ICV-adjusted total hippocampal volume and hippocampal subregion volumes.
| Region | Random intercept | Age | Age2 | Age3 | Random slope | Sex main effect |
|---|---|---|---|---|---|---|
| Total HPC | 5014.44 | 4947.27 | 4943.94 | 4942.40 | 4953.99 | 4940.50 |
| Head | 4879.95 | 4833.05 | 4831.23 | 4834.90 | 4838.69 | 4824.73 |
| Body | 4684.95 | 4686.13 | 4691.68 | 4695.99 | 4692.99 | 4691.15 |
| Tail | 4434.70 | 4432.30 | 4437.33 | 4441.55 | 4437.00 | 4442.42 |
Note. Bold highlights values significant at the p < .05 level to indicate the best model using likelihood ratio tests comparing models for each of the following steps: 1) unconditional means and growth models, 2) best age model with random slope model, and 3) best model with sex effects. Italics indicates p < .10. HPC = hippocampus.
Table 3.
Likelihood ratio tests for best fitting age models and added sex effects for ICV-adjusted hippocampal volumes.
| Region | Age Model | Test | L.Ratio | p | Sex Model | L.Ratio | p |
|---|---|---|---|---|---|---|---|
| Total HPC | Cubic Model | 3 v 4 | 7.33 | 0.007 | Cubic + Sex Model | 7.70 | 0.006 |
| Head | Quadratic Model | 2 v 3 | 7.62 | 0.006 | Quadratic + Sex Model | 12.30 | < 0.001 |
| Body | Linear Model | 1 v 2 | 4.62 | 0.032 | Linear Model | 0.77 | 0.380 |
| Tail | Linear Model | 1 v 2 | 8.19 | 0.004 | Linear Model | 0.37 | 0.544 |
Note. HPC = hippocampus. Test refers to the significant highest-order model compared to previous model tested (1 = null model, 2 = linear, 3 = quadratic, 4 = cubic) and its associated Likelihood Ratio (L.Ratio) and p-value (bold highlights p < .05, italics p < .10).
Table 4.
Model parameters for fixed effects in the best fitting age model for ICV-adjusted bilateral hippocampal subregion volumes including sex.
| Region | b | SE | t | p |
|---|---|---|---|---|
| Total HPC | ||||
| Intercept | 6615.20 | 61.41 | 107.73 | < 0.001 |
| Age | 185.22 | 28.34 | 6.54 | < 0.001 |
| Age2 | −48.20 | 12.17 | −3.96 | < 0.001 |
| Age3 | −16.67 | 6.25 | −2.67 | 0.009 |
| Sex | 230.78 | 82.84 | 2.79 | 0.006 |
| Head | ||||
| Intercept | 3164.64 | 50.33 | 62.88 | < 0.001 |
| Age | 85.87 | 14.69 | 5.84 | < 0.001 |
| Age2 | −17.14 | 6.41 | −2.67 | 0.008 |
| Sex | 248.06 | 69.97 | 3.55 | 0.001 |
| Body | ||||
| Intercept | 2435.00 | 33.61 | 72.46 | < 0.001 |
| Age | 25.48 | 11.96 | 2.13 | 0.035 |
| Sex | −41.79 | 47.83 | −0.87 | 0.383 |
| Tail | ||||
| Intercept | 970.23 | 28.02 | 34.63 | < 0.001 |
| Age | 21.97 | 7.94 | 2.77 | 0.006 |
| Sex | 24.13 | 39.78 | 0.61 | 0.545 |
Notes: HPC = hippocampus. b values in mm3. SE = Standard Error. Bold indicates p < .05.
Total Hippocampal Development
The best fitting model for bilateral total hippocampal volume included a cubic function (Figure 2A, top panel). In addition to the cubic changes in volume, the main effect of sex was significant. Specifically, females showed smaller ICV-adjusted total hippocampal volumes compared to males.
Figure 2.
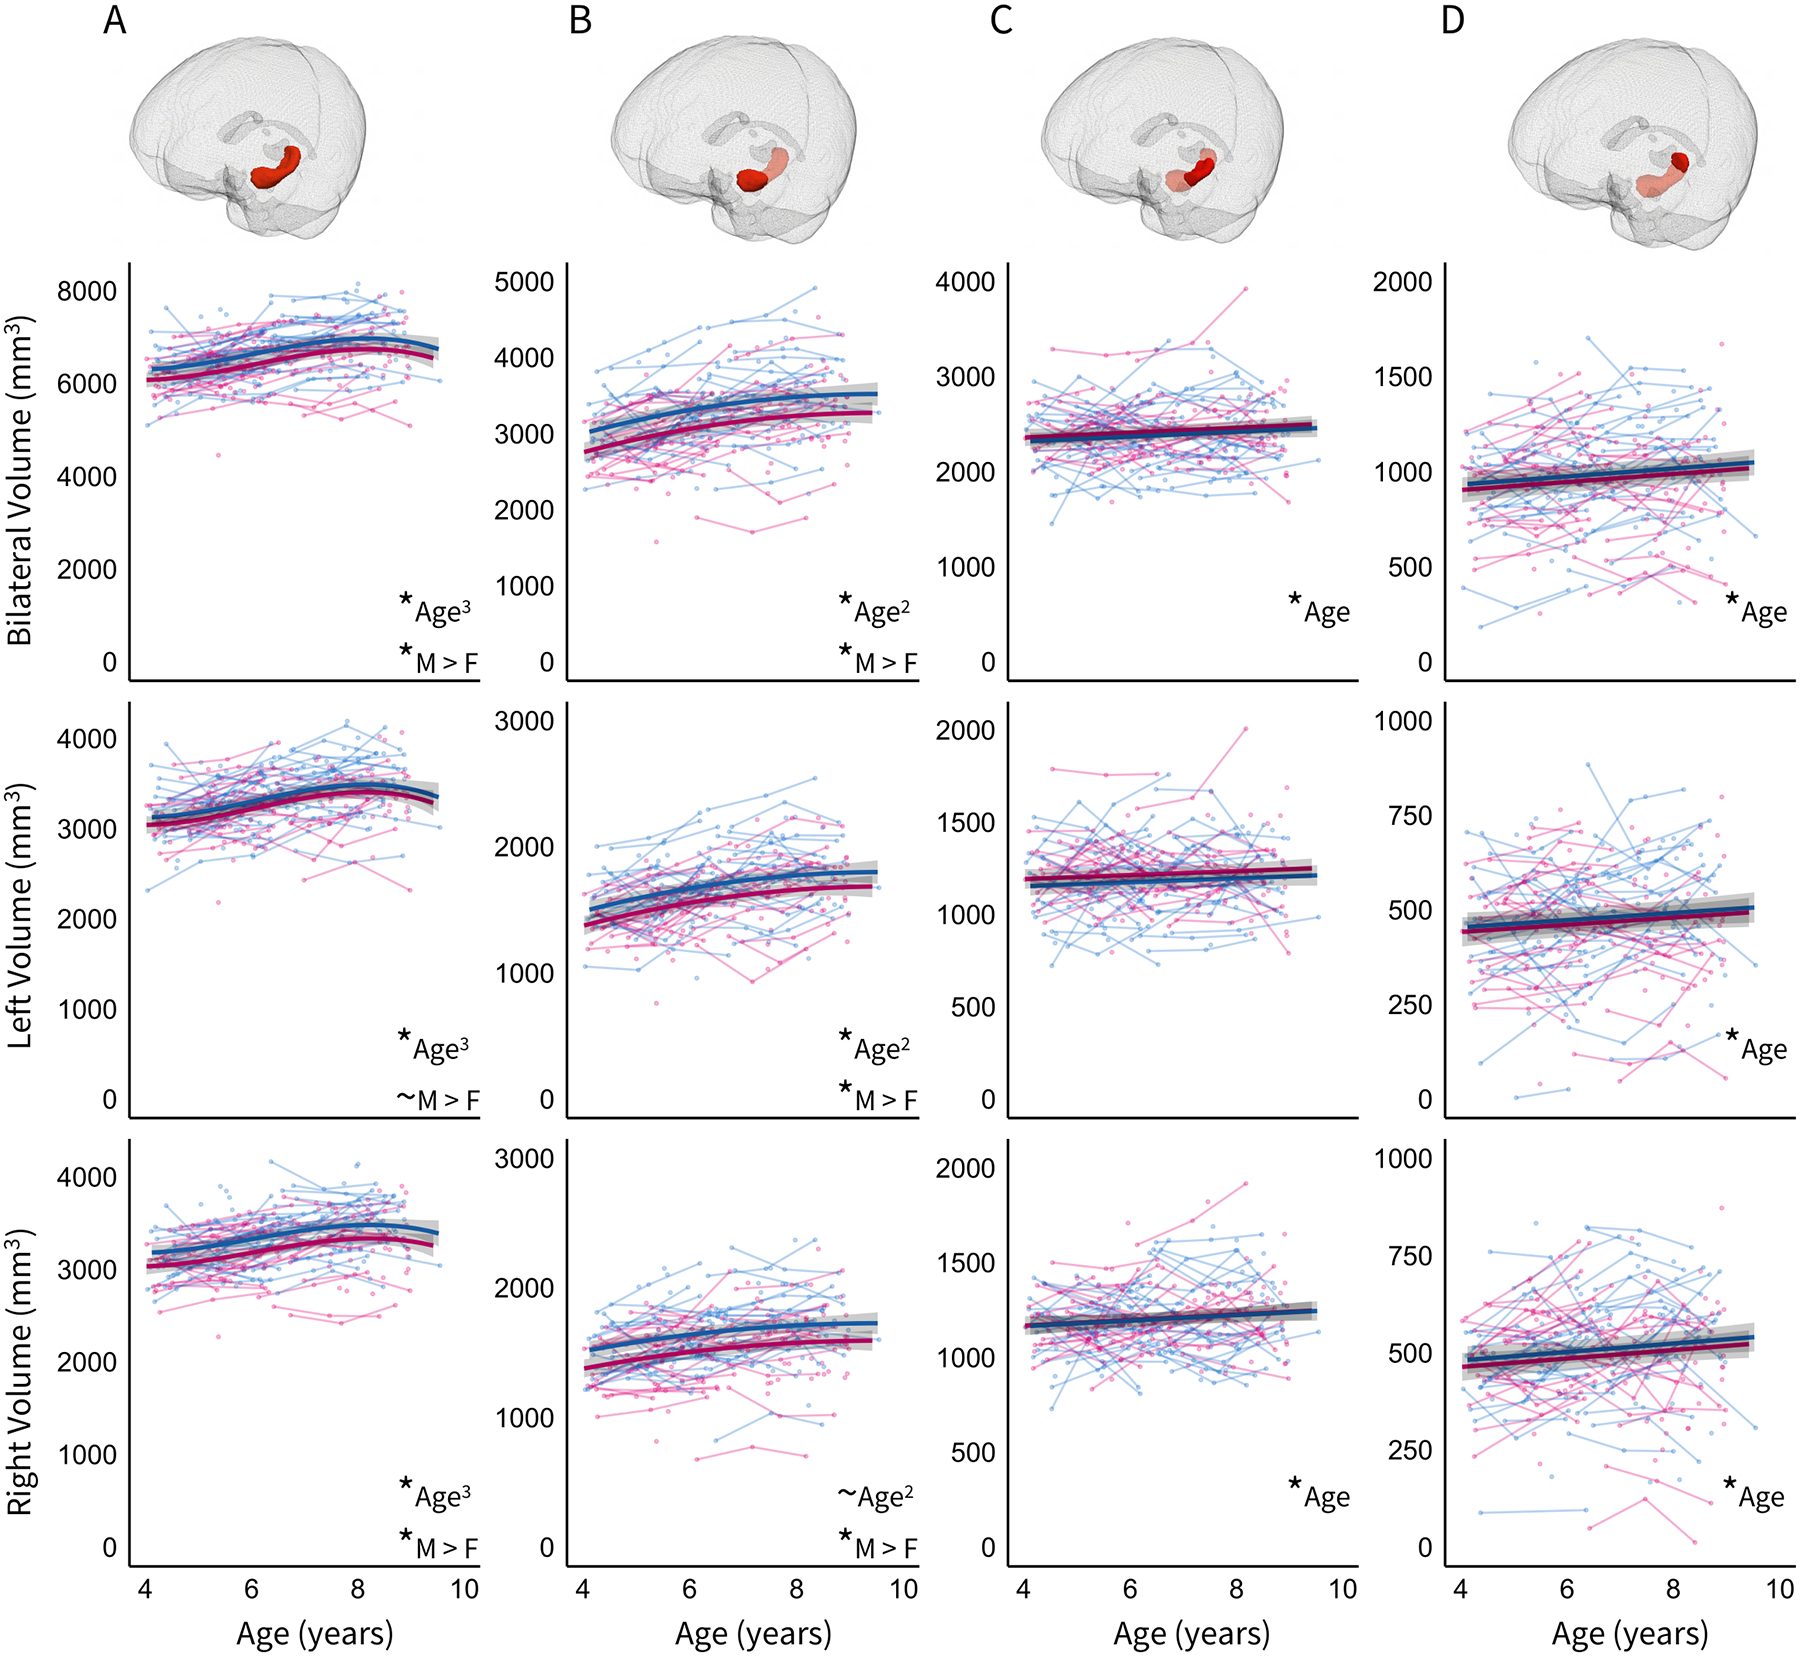
Developmental changes in bilateral (top panel), left (middle panel), and right (bottom panel) A) total hippocampus, B) hippocampal head, C) hippocampal body, and D) hippocampal tail ICV-adjusted volumes. Error bands represent 95% confidence intervals. * denotes significant effect at p < .05 level, and ~ denotes marginal effect at p < .10 level. Age3, Age2, and Age reflect the best fitting age model. M>F denotes larger volumes in males compared to females. Individual male (blue) and female (pink) subjects are represented by individual lines connecting dots, and subjects measured once are represented by single dots.
Hippocampal Head Development
ICV-adjusted hippocampal head volumes showed non-linear growth during this period, as indicated by a negative quadratic effect of age (Figure 2B, top panel). A log-likelihood ratio test comparing a quadratic model with a random slope to a quadratic model without a random slope indicated that the random model did not fit significantly better (Table 3). In addition to the quadratic changes in volume, the main effect of sex was significant. Specifically, females showed smaller ICV-adjusted hippocampal head volumes compared to males.
Hippocampal Body Development
ICV-adjusted hippocampal body volumes showed slight, but significant, growth during this period as indicated by a positive linear effect of age (Figure 2C, top panel). A log-likelihood ratio test comparing a linear model with a random slope to a linear model without a random slope indicated that the random model did not fit significantly better (Table 3). The main effect of sex was not significant.
Hippocampal Tail Development
ICV-adjusted hippocampal tail volumes showed slight, but significant, growth during this period as indicated by a positive linear effect of age (Figure 2D, top panel). The best fitting model included a linear effect of age with both a random subject intercept and slope (Table 3). The main effect of sex was not significant.
Effects of Hemisphere
As mentioned previously, some reports (e.g., Gogtay et al., 2006) have examined left and right hemispheres separately and found hemispheric differences. Results of analyses assessing hemispheric differences are reported below. See Table 5 for a summary of the model comparisons, and Table 6 for a summary of final hemisphere model parameters.
Table 5.
Bayesian Information Criterion (BIC) values for the unconditional means models and age models by hemisphere for ICV-adjusted total hippocampal and hippocampal subregion volumes.
| Hemisphere / Region | Random intercept | Age | Age2 | Age3 | Random slope | Sex main effect |
|---|---|---|---|---|---|---|
| Left Hemisphere | ||||||
| Total HPC | 4657.31 | 4605.56 | 4604.32 | 4604.28 | 4615.71 | 4606.56 |
| Head | 4530.24 | 4490.25 | 4490.47 | 4495.34 | 4500.20 | 4486.90 |
| Body | 4349.14 | 4352.71 | 4358.00 | 4362.27 | 4361.98 | 4352.76 |
| Tail | 4085.07 | 4086.24 | 4092.03 | 4095.87 | 4093.31 | 4091.74 |
| Right Hemisphere | ||||||
| Total HPC | 4591.84 | 4546.21 | 4546.46 | 4548.04 | 4559.63 | 4542.76 |
| Head | 4463.24 | 4438.08 | 4439.64 | 4442.86 | 4447.14 | 4433.18 |
| Body | 4288.11 | 4288.95 | 4294.734 | 4299.88 | 4293.98 | 4299.73 |
| Tail | 4044.44 | 4043.80 | 4046.94 | 4052.43 | 4046.07 | 4051.52 |
Note. HPC = hippocampus. Bold highlights p < .05 to indicate the best model in each hemisphere using likelihood ratio tests comparing models for each of the following steps: 1) unconditional means and growth models, 2) best age model with random slope model, and 3) best model with sex effects.
Table 6.
Model parameters for fixed effects in the best fitting age model, including sex, for ICV-adjusted hippocampal subregion volumes.
| Hemisphere/ Region | b | SE | t | p |
|---|---|---|---|---|
| Left Hemisphere | ||||
| Total HPC | ||||
| Intercept | 3339.66 | 34.56 | 96.64 | < 0.001 |
| Age | 102.99 | 18.23 | 5.65 | < 0.001 |
| Age2 | −28.05 | 8.02 | −3.50 | < 0.001 |
| Age3 | −9.77 | 4.11 | −2.38 | 0.019 |
| Sex | 84.94 | 45.43 | 1.87 | 0.063 |
| Head | ||||
| Intercept | 1617.60 | 27.29 | 59.28 | < 0.001 |
| Age | 51.63 | 9.46 | 5.46 | < 0.001 |
| Age2 | −9.85 | 4.36 | −2.26 | 0.026 |
| Sex | 114.44 | 37.14 | 3.08 | 0.002 |
| Body | ||||
| Intercept | 1223.97 | 19.15 | 63.93 | < 0.001 |
| Age | 10.66 | 7.31 | 1.46 | 0.147 |
| Sex | −39.07 | 27.17 | −1.44 | 0.152 |
| Tail | ||||
| Intercept | 470.26 | 15.91 | 29.55 | < 0.001 |
| Age | 9.51 | 4.39 | 2.17 | 0.032 |
| Sex | 12.17 | 22.77 | 0.53 | 0.594 |
| Right Hemisphere | ||||
| Total HPC | ||||
| Intercept | 3276.29 | 32.64 | 100.38 | < 0.001 |
| Age | 82.76 | 15.92 | 5.20 | < 0.001 |
| Age2 | −20.58 | 6.90 | −2.98 | 0.003 |
| Age3 | −7.04 | 3.54 | −1.99 | 0.049 |
| Sex | 146.32 | 43.62 | 3.35 | 0.001 |
| Head | ||||
| Intercept | 1547.42 | 27.35 | 56.57 | < 0.001 |
| Age | 35.84 | 8.20 | 4.37 | < 0.001 |
| Age2 | −7.07 | 3.60 | −1.96 | 0.052 |
| Sex | 134.20 | 37.94 | 3.54 | < 0.001 |
| Body | ||||
| Intercept | 1212.87 | 18.29 | 66.31 | < 0.001 |
| Age | 15.66 | 6.83 | 2.29 | 0.023 |
| Sex | −5.24 | 25.19 | −0.21 | 0.835 |
| Tail | ||||
| Intercept | 500.24 | 14.49 | 34.52 | < 0.001 |
| Age | 11.64 | 4.37 | 2.66 | 0.009 |
| Sex | 11.78 | 20.13 | 0.59 | 0.559 |
Notes: HPC = hippocampus. b values in mm3. SE = Standard Error. Bold indicates p < .05. Italic indicates p < .10.
Hemispheric differences in total hippocampal volume.
Slight differences in the best fitting models for ICV-adjusted right and left total hippocampal volume were observed. For left hippocampus, the best fitting model suggested developmental change that followed a cubic function, with no significant main effect of sex (Figure 2A, middle panel). For right hippocampus, the best fitting model suggested developmental change that followed a cubic function, with a significant main effect of sex (Figure 2A, bottom panel). Specifically, ICV-adjusted volumes were smaller in females compared to males.
Hemispheric differences in hippocampal head volume.
Slight differences in the best fitting models for ICV-adjusted right and left hippocampal head volume were observed. For left hippocampus, the best fitting model suggested developmental change that followed a quadratic function, with a significant main effect of sex (Figure 2B, middle panel). For right hippocampus, the best fitting model suggested developmental change that followed a quadratic function, however, the effect of age was marginal after accounting for a significant main effect of sex (Figure 2B, bottom panel). Specifically, ICV-adjusted volumes were smaller in females compared to males.
Hemispheric differences in hippocampal body volume.
Differences in the best fitting models for ICV-adjusted right and left hippocampal body volume were observed. For left body, a null model fit best, with no significant age-related developmental change and no main effect of sex (Figure 2C, middle panel). For right body, the best fitting model suggested developmental change that followed a positive linear function, with both a random subject intercept and slope, and no significant main effect of sex (Figure 2C, bottom panel).
Hemispheric differences in hippocampal tail volume.
The best fitting models for ICV-adjusted right and left hippocampal tail volume were similar. Volumetric change was best explained by a positive linear function (Figure 2C, bottom panel). Log-likelihood ratio tests comparing a linear model with a random slope to a linear model without a random slope indicated that the random model fit significantly better in right, but not left, hemisphere. There was no significant main effect of sex.
Discussion
The present study provides a focused examination of longitudinal changes in hippocampal subregions during early- to mid-childhood. Our results provide a novel contribution to the existing literature by highlighting the importance of considering 1) the heterogeneous nature of the hippocampus during this period, as subregions show differential developmental trajectories, 2) hemispheric differences, and 3) sex differences when assessing hippocampal development. Specifically, the present study showed a cubic pattern of developmental change in total bilateral hippocampal volume. However, non-linear developmental changes were observed in bilateral hippocampal head volume and age-related increases were observed in bilateral hippocampal body and tail volumes. Further, developmental trajectories differed by hemisphere for hippocampal head and body volume. Finally, volumes were larger in males than in females in total hippocampus and hippocampal head.
Results from the current study align, to varying degrees, with previous work examining hippocampal development. For hippocampal head, the current findings are consistent with cross-sectional work showing greater hippocampal head volume in middle childhood (i.e., 7–10 years) compared to early childhood (i.e., 4–6 years; Riggins et al., 2018). Further, the current study indicates robust increases in hippocampal volume that occur prior to 8 year of age. This finding aligns with recent work showing greater hippocampal head volume in middle childhood (e.g., 8- to 11-year-olds, DeMaster et al., 2014; 8-years-old, Lee et al., 2020) followed by smaller volumes in adulthood. This is in contrast to research that has shown a decrease in hippocampal head volume between 4 to 25 years. These conflicting findings are likely due to multiple factors, including differences in the methodology used to delineate hippocampal subregions, the metric used to assess volume, differences in age span assessed, and variations in delays between scans (Daugherty et al., 2017; Gogtay et al., 2006; Schlichting et al., 2017).
Similar to previous work assessing hippocampal body volume across a wider range of development that has identified greater volume in adults compared to children in middle childhood (8–25 years, Daugherty et al., 2017; 6–11 years, Schlichting et al., 2017), the current study observed increases in bilateral hippocampal body volume. However, this finding was not robust, as it was not observed when analyses were restricted to the longitudinal sample. This difference may be because of the reduced power to detect this effect in the longitudinal subsample or may reflect that this effect is not present. Consequently, age related-increases in body volume should be considered with caution, and future work is needed to clarify the extent of developmental change in this hippocampal subregion. Nevertheless, age related increases in hippocampal body volume observed in the current study differ from previous cross-sectional studies focused on early childhood (e.g., 4–6 years, Riggins et al., 2016) and early- to mid-childhood (4–8 years, Riggins et al., 2018) that showed no differences in hippocampal body volume between 4 and 8 years of age. This may be due to the larger sample size included here, or the decreased intersubject variation, a strength of the longitudinal approach, or both.
The current study suggests that volume of the hippocampal tail increases during early- to mid-childhood. Previous studies across a wider range of development often show little change or smaller hippocampal tail volumes later in development. However, as volumetric increases in the current study were small, previous work spanning a greater range of development may have been unable to detect these changes. Notably, Gogtay et al. (2006) examined hippocampal subregion development longitudinally by considering body and tail together as the posterior region of the hippocampus and observed developmental increases in volume between 4–25 years. Although the hippocampus was divided differently in the present study compared to the study by Gogtay et al. (2006), both highlight the importance of considering the heterogeneity of hippocampal subregions. Further, results of the current study highlight the importance of considering the development of hippocampal body and tail separately, as considering them together may mask differential developmental trajectories during early- to- mid-childhood.
The developmental patterns observed were largely similar across left and right hemispheres. Interestingly, when assessed separately by hemisphere, there were differences in developmental trajectories of right hippocampal head and left hippocampal body volume. For hippocampal head, age-related volumetric increases were observed in the right hemisphere, while age-related changes in left hemisphere were no longer statistically significant after adding sex to the model. For hippocampal body volume, age-related volumetric increases were observed in the right hemisphere, and no significant age-related changes were observed in left hemisphere. However, the finding of change in right hemisphere was not robust, as it was not observed when analyses were restricted to the longitudinal sample. As noted above, this difference may be because of reduced power in the longitudinal subsample or because the effect is not present. Previous research comparing 8- to 11-year old children and adults has noted developmental differences in total hippocampal volume that vary by hemisphere (DeMaster et al., 2014). Furthermore, research has identified hemispheric differences in the relation between activation of the hippocampus and memory performance during mid- to late-childhood (8–11 years, Ghetti, DeMaster, Yonelinas, & Bunge, 2010). It is possible that such differences are due to differing developmental trajectories in right and left hemisphere that emerge during the developmental period of early- to-mid childhood.
The present results also illustrate the importance of exploring sex-related differences in hippocampal subregion volume. Sex-related volumetric differences were observed bilaterally in total hippocampus and hippocampal head. These differences were also observed laterally in right total hippocampus, and both right and left hippocampal head, even after accounting for differences in head size due to age and sex. Consistent with prior work (Riggins et al., 2018; Tamnes et al., 2018), ICV-adjusted volumes were greater in male compared to female participants. Sex differences were not observed in hippocampal body, nor hippocampal tail volumes. This suggests, at least in early- to mid-childhood, sex differences observed in total hippocampal volume are driven by sex differences in hippocampal head.
These findings contribute to the existing literature examining sex-related differences in brain development (see Kaczkurkin et al., 2018 for review). The characterization of sex-related differences in typical hippocampal subregion development has the potential to inform sex-differences observed in atypical populations, for example, individuals diagnosed with psychopathology later in development (Giedd et al., 1997). Further, as some studies examining sex differences in total hippocampal volume across the life-span have yielded mixed results (Kaczkurkin et al., 2018), the present study highlights the importance of examining differences not only in total hippocampus, but also in hippocampal subregions.
Although the exact neurobiological processes underlying age-related changes and sex differences in hippocampal subregions are not known, it is likely that mechanisms driving these changes are multifaceted. As suggested previously, sex-related differences may arise from differences in either sex-hormones or sex-receptors (Giedd et al., 1997; Marrocco & McEwen, 2016). Age-related changes may be associated with structural maturation, such as synaptic growth and pruning, dendritic arborization, and vascularization (Benes, 1998; Huttenlocher & Dabholkar, 1997; Lenroot & Giedd, 2006; Utsunomiya, Takano, Okazaki, & Mitsudome, 1999). In addition, postnatal neurogenesis in the dentate gyrus of the hippocampus may also contribute to volumetric changes, as animal models propose that, at least until 5 years of age, immature granule cells accumulate and there are higher rates of dendritic development and synaptic formation (Eckenhoff & Rakic, 1988; Josselyn & Frankland, 2012; Lavenex & Banta Lavenex, 2013; Seress, 2001).
Findings from the current study have implications for furthering our understanding of the relation between cognitive processes, such as episodic memory, and typical development of the hippocampus. As noted previously, cross-sectional research has found that performance on episodic memory tasks differentially relates to hippocampal subregion volumes across development (DeMaster et al., 2014; see also Riggins et al., 2018). Relatedly, functional work examining age-related differences in hippocampal activation showed that different subregions related to better performance in adults and older children (DeMaster & Ghetti, 2013; cf. Geng et al., 2019). This suggests that certain cognitive abilities, such as episodic memory, may be supported differentially by subregions of the hippocampus across development. While the current study cannot provide evidence of whether the observed volumetric changes have these functional implications, it is likely that the differential developmental trajectories of subregions along the longitudinal axis relate to functional specialization of the hippocampus and its connections to cortical regions observed in adults (see Poppenk et al., 2013 for review).
These findings also provide an important step towards understanding both typical and atypical hippocampal development and pave the way for studies to investigate factors that may influence developmental trajectories of hippocampal subregions. For example, research in rodents and humans shows that the hippocampus is disproportionately impacted by variations in caregiving and early life stress due to its high density of stress hormone receptors (Conrad, 2008; Kim, Pellman, & Kim, 2015). To expand, work examining the impact of caregiving on hippocampal volume shows that supportive care may be especially important for heathy hippocampal development during the preschool years (e.g., 3–5 years; Luby, Belden, Harms, Tillman, & Barch, 2016), as this form of positive care relates to greater increases in hippocampal volume and mediates the negative impact of poverty on hippocampal development (Luby et al., 2012; Luby et al., 2013). Recent work further suggests these effects may vary across subregions in early- to mid-childhood (i.e., Blankenship et al., 2019). An improved understanding of the typical developmental trajectories of hippocampal subregion development will allow future research to identify whether trajectories are impacted by factors, such as stress or disease, as indicated by accelerated or deviant trajectories.
The present study has several important strengths, which have allowed for a deeper understanding of hippocampal development. Notably, use of an accelerated longitudinal design including 3 time-points allowed for the characterization of changes in volume as opposed to age-related differences, as is the case with cross-sectional samples. However, future work should seek to draw connections between the age range assessed in this study and other periods of development. The individual variability observed in the hippocampal trajectories of this sample underscores the importance of longitudinal data and also the importance of future research focusing on factors contributing to this variability.
The current study also has several limitations. Although we can identify macrostructural volumetric changes in the hippocampus, we still do not have a solid understanding of what microstructural changes (e.g., synaptogenesis, neurogenesis) may be driving these volumetric changes. Further, it is unclear how the present results relate to volumetric changes in functionally distinct hippocampal subfields. The present study examined subregions rather than subfields as subregions can be identified with lower resolution scans, which are easier to obtain in young children. Future work using higher-resolution images, which allow for more precise delineation of hippocampal subfields, should examine the extent to which volumetric changes in hippocampal subregion volume are influenced by the disproportional distribution of specific subfields along the longitudinal axis (e.g., CA1 and CA3; Duvernoy, 2005). Separately, developmental trajectories were not assessed by sex, due to the reduced power that would result from splitting the larger sample. Prior research has shown that trajectories of structural development of the hippocampus vary by sex, specifically in relation to pubertal development (e.g., Tanner stage, Goddings et al., 2014). Consequently, additional work is needed to explore the possibility of heterogeneous trajectories that differ by sex during early development. Additionally, the functional implications of the current findings are unknown. Finally, the sample included in the current study is not highly diverse in terms of SES. In turn, future research should seek to replicate and extend these findings in lower SES and more diverse samples.
The present study fills an important gap in the literature by characterizing the developmental trajectory of hippocampal subregions from early- to mid- childhood using a longitudinal sample of children. Findings of differential developmental trajectories of subregions underscore the importance of considering the hippocampus as a heterogeneous structure. The current findings also lay the groundwork for future work to assess associations with the development of behavioral processes, such as episodic memory, and factors contributing to variability in the development of these subregions.
Acknowledgements
The authors thank the families who participated in this study and the members of the Neurocognitive Development Lab, especially Marissa Clark, Lisa Cox, Elizabeth Mulligan, Jennifer Sloane, and Shane Wise for assistance with data collection.
Data Availability Statement
The data that support the findings of this study are available from the corresponding author upon reasonable request.
References
- Amaral D, & Lavenex P (2007). Hippocampal neuroanatomy. In Andersen P, Morris R, Amaral D, Bliss T, & O’Keefe J (Eds.), The hippocampus book (pp. 37–110). New York: Oxford University Press [Google Scholar]
- Benes FM (1998). Brain development, VII: Human brain growth spans decades. The American Journal of Psychiatry. 155(11), 1489. 10.1176/ajp.155.11.1489 [DOI] [PubMed] [Google Scholar]
- Blankenship SL, Chad‐Friedman E, Riggins T, & Dougherty LR (2019). Early parenting predicts hippocampal subregion volume via stress reactivity in childhood. Developmental Psychobiology, 61(1), 125–140. 10.1002/dev.21788 [DOI] [PubMed] [Google Scholar]
- Blankenship SL, Redcay E, Dougherty LR, & Riggins T (2017). Development of hippocampal functional connectivity during childhood. Human Brain Mapping, 38(1), 182–201. 10.1002/hbm.23353 [DOI] [PMC free article] [PubMed] [Google Scholar]
- Bramen JE, Hranilovich JA, Dahl RE, Forbes EE, Chen J, Toga AW, … & Sowell ER (2011). Puberty influences medial temporal lobe and cortical gray matter maturation differently in boys than girls matched for sexual maturity. Cerebral Cortex, 21(3), 636–646. 10.1093/cercor/bhq137 [DOI] [PMC free article] [PubMed] [Google Scholar]
- Brown TT, & Jernigan TL (2012). Brain development during the preschool years. Neuropsychology Review, 22(4), 313–333. 10.1007/s11065-012-9214-1. [DOI] [PMC free article] [PubMed] [Google Scholar]
- Burton P, Gurrin L, & Sly P (1998). Extending the simple linear regression model to account for correlated responses: an introduction to generalized estimating equations and multi‐level mixed modelling. Statistics in Medicine, 17(11), 1261–1291. [DOI] [PubMed] [Google Scholar]
- Conrad CD (2008). Chronic stress-induced hippocampal vulnerability: the glucocorticoid vulnerability hypothesis. Reviews in the Neurosciences, 19(6), 395–412. 10.1515/revneuro.2008.19.6.395 [DOI] [PMC free article] [PubMed] [Google Scholar]
- Daugherty AM, Flinn R, & Ofen N (2017). Hippocampal CA3-dentate gyrus volume uniquely linked to improvement in associative memory from childhood to adulthood. NeuroImage, 153(March), 75–85. 10.1016/j.neuroimage.2017.03.047 [DOI] [PMC free article] [PubMed] [Google Scholar]
- DeMaster DM, & Ghetti S (2013). Developmental differences in hippocampal and cortical contributions to episodic retrieval. Cortex, 49(6), 1482–1493. 10.1016/j.cortex.2012.08.004 [DOI] [PubMed] [Google Scholar]
- DeMaster D, Pathman T, Lee JK, & Ghetti S (2014). Structural development of the hippocampus and episodic memory: Developmental differences along the anterior/posterior axis. Cerebral Cortex, 24(11), 3036–3045. 10.1093/cercor/bht160 [DOI] [PubMed] [Google Scholar]
- Duff MC, & Brown-Schmidt S (2017). Hippocampal Contributions to Language Use and Processing. In The Hippocampus from Cells to Systems (pp. 503–536). Cham: Springer International Publishing. 10.1007/978-3-319-50406-3_16 [DOI] [Google Scholar]
- Duncan SC, Duncan TE, & Hops H (1996). Analysis of longitudinal data within accelerated longitudinal designs. Psychological Methods, 1(3), 236. 10.1037/1082-989X.1.3.236 [DOI] [Google Scholar]
- Duvernoy H (2005). Sectional Anatomy and Magnetic Resonance Imaging. In, The hippocampus book: Functional anatomy, vascularization and serial sections with MRI (3rd ed., pp. 129–217). Berlin: Springer-Verlag. [Google Scholar]
- Eckenhoff MF, & Rakic P (1988). Nature and fate of proliferative cells in the hippocampal dentate gyrus during the life span of the rhesus monkey. Journal of Neuroscience, 8(8), 2729–2747. 10.1523/JNEUROSCI.08-08-02729.1988 [DOI] [PMC free article] [PubMed] [Google Scholar]
- Fjell AM, Sneve MH, Sederevicius D, Sørensen Ø, Krogsrud SK, Mowinckel AM, & Walhovd KB (2019). Volumetric and microstructural regional changes of the hippocampus underlying development of recall performance after extended retention intervals. Developmental Cognitive Neuroscience, 100723. [DOI] [PMC free article] [PubMed] [Google Scholar]
- Geng F, Redcay E, & Riggins T (2019). The influence of age and performance on hippocampal function and the encoding of contextual information in early childhood. NeuroImage, 195(15), 433–443. 10.1016/j.neuroimage.2019.03.035 [DOI] [PMC free article] [PubMed] [Google Scholar]
- Ghetti S, & Bunge SA (2012). Neural changes underlying the development of episodic memory during middle childhood. Developmental Cognitive Neuroscience, 2(4), 381–395. 10.1016/j.dcn.2012.05.002 [DOI] [PMC free article] [PubMed] [Google Scholar]
- Ghetti S, DeMaster DM, Yonelinas AP, & Bunge SA (2010). Developmental Differences in Medial Temporal Lobe Function during Memory Encoding. Journal of Neuroscience, 30(28), 9548–9556. 10.1523/JNEUROSCI.3500-09.2010 [DOI] [PMC free article] [PubMed] [Google Scholar]
- Ghisletta P, & Lindenberger U (2004). Static and dynamic longitudinal structural analyses of cognitive changes in old age. Gerontology, 50(1), 12–16. 10.1159/000074383 [DOI] [PubMed] [Google Scholar]
- Ghisletta P, Renaud O, Jacot N, & Courvoisier D (2015). Linear mixed-effects and latent curve models for longitudinal life course analyses. In A life course perspective on health trajectories and transitions (pp. 155–178). Springer, Cham. 10.1007/978-3-319-20484-0_8 [DOI] [PubMed] [Google Scholar]
- Ghosh SS, Kakunoori S, Augustinack J, Nieto-Castanon A, Kovelman I, Gaab N, … & Fischl B (2010). Evaluating the validity of volume-based and surface-based brain image registration for developmental cognitive neuroscience studies in children 4 to 11 years of age. Neuroimage, 53(1), 85–93. 10.1016/j.neuroimage.2010.05.075 [DOI] [PMC free article] [PubMed] [Google Scholar]
- Giedd JN, Castellanos FX, Rajapakse JC, Vaituzis AC, & Rapoport JL (1997). Sexual dimorphism of the developing human brain. Progress in Neuro-Psychopharmacology and Biological Psychiatry, 21(8), 1185–1201. 10.1016/S0278-5846(97)00158-9 [DOI] [PubMed] [Google Scholar]
- Goddings AL, Mills KL, Clasen LS, Giedd JN, Viner RM, & Blakemore SJ (2014). The influence of puberty on subcortical brain development. Neuroimage, 88, 242–251. 10.1016/j.neuroimage.2013.09.073 [DOI] [PMC free article] [PubMed] [Google Scholar]
- Gogtay N, Nugent TF, Herman DH, Ordonez A, Greenstein D, Hayashi KM, … Thompson PM (2006). Dynamic mapping of normal human hippocampal development. Hippocampus, 16(8), 664–672. 10.1002/hipo.20193. [DOI] [PubMed] [Google Scholar]
- Goldstein JM, Seidman LJ, Horton NJ, Makris N, Kennedy DN, Caviness VS Jr., … & Tsuang MT (2001). Normal sexual dimorphism of the adult human brain assessed by in vivo magnetic resonance imaging. Cerebral Cortex, 11(6), 490–497. [DOI] [PubMed] [Google Scholar]
- Herting MM, Johnson C, Mills KL, Vijayakumar N, Dennison M, Liu C, … & Allen NB (2018). Development of subcortical volumes across adolescence in males and females: A multisample study of longitudinal changes. NeuroImage, 172, 194–205. 10.1016/j.neuroimage.2018.01.020 [DOI] [PMC free article] [PubMed] [Google Scholar]
- Humphreys KL, King LS, Sacchet MD, Camacho MC, Colich NL, Ordaz SJ, … & Gotlib IH (2019). Evidence for a sensitive period in the effects of early life stress on hippocampal volume. Developmental Science, 22(3), e12775. 10.1111/desc.12775 [DOI] [PMC free article] [PubMed] [Google Scholar]
- Huttenlocher PR, & Dabholkar AS (1997). Regional differences in synaptogenesis in human cerebral cortex. Journal of Comparative Neurology, 387(2), 167–178. [DOI] [PubMed] [Google Scholar]
- Immordino‐Yang MH, & Singh V (2013). Hippocampal contributions to the processing of social emotions. Human Brain Mapping, 34(4), 945–955. 10.1002/hbm.21485 [DOI] [PMC free article] [PubMed] [Google Scholar]
- Josselyn SA, & Frankland PW (2012). Infantile amnesia: A neurogenic hypothesis. Learning & Memory, 19(9), 423–433. 10.1101/lm.021311.110 [DOI] [PubMed] [Google Scholar]
- Kaczkurkin AN, Raznahan A, & Satterthwaite TD (2018). Sex differences in the developing brain: insights from multimodal neuroimaging. Neuropsychopharmacology, 44(1), 71–85. 10.1038/s41386-018-0111-z [DOI] [PMC free article] [PubMed] [Google Scholar]
- Kim EJ, Pellman B, & Kim JJ (2015). Stress effects on the hippocampus: a critical review. Learning & Memory, 22(9), 411–416. 10.1101/lm.037291.114 [DOI] [PMC free article] [PubMed] [Google Scholar]
- Lavenex P, & Banta Lavenex P (2013). Building hippocampal circuits to learn and remember: Insights into the development of human memory. Behavioural Brain Research, 254, 8–21. 10.1016/j.bbr.2013.02.007 [DOI] [PubMed] [Google Scholar]
- Lee JK, Fandakova Y, Johnson EG, Cohen N, Bunge SA, & Ghetti S (2020). Changes in anterior and posterior hippocampus differentially predict item-space, item-time, and item-item memory improvement. Developmental Cognitive Neuroscience. 10.1016/j.dcn.2019.100741 [DOI] [PMC free article] [PubMed] [Google Scholar]
- Lenroot RK, & Giedd JN (2006). Brain development in children and adolescents: insights from anatomical magnetic resonance imaging. Neuroscience & Biobehavioral Reviews, 30(6), 718–729. 10.1016/j.neubiorev.2006.06.001 [DOI] [PubMed] [Google Scholar]
- Luby JL, Barch DM, Belden A, Gaffrey MS, Tillman R, Babb C, … Botteron KN (2012). Maternal support in early childhood predicts larger hippocampal volumes at school age. Proceedings of the National Academy of Sciences, 109(8), 2854–2859. 10.1073/pnas.1118003109 [DOI] [PMC free article] [PubMed] [Google Scholar]
- Luby J, Belden A, Botteron K, Marrus N, Harms MP, Babb C, … & Barch D (2013). The effects of poverty on childhood brain development: the mediating effect of caregiving and stressful life events. JAMA Pediatrics, 167(12), 1135–1142. 10.1001/jamapediatrics.2013.3139 [DOI] [PMC free article] [PubMed] [Google Scholar]
- Luby JL, Belden A, Harms MP, Tillman R, & Barch DM (2016). Preschool is a sensitive period for the influence of maternal support on the trajectory of hippocampal development. Proceedings of the National Academy of Sciences, 113(20), 5742–5747. 10.1073/pnas.1601443113 [DOI] [PMC free article] [PubMed] [Google Scholar]
- Marrocco J, & McEwen BS (2016). Sex in the brain: hormones and sex differences. Dialogues in Clinical Neuroscience, 18(4), 373–383. [DOI] [PMC free article] [PubMed] [Google Scholar]
- McEwen BS, Nasca C, & Gray JD (2016). Stress effects on neuronal structure: Hippocampus, amygdala, and prefrontal cortex. Neuropsychopharmacology, 41(1), 3–23. 10.1038/npp.2015.171 [DOI] [PMC free article] [PubMed] [Google Scholar]
- Milner B, Corkin S, & Teuber HL (1968). Further analysis of the hippocampal amnesic syndrome: 14-year follow-up study of HM. Neuropsychologia, 6(3), 215–234. 10.1016/0028-3932(68)90021-3 [DOI] [Google Scholar]
- Miyazaki Y, & Raudenbush SW (2000). Tests for linkage of multiple cohorts in an accelerated longitudinal design. Psychological Methods, 5(1), 44. 10.1037/1082-989X.5.1.44 [DOI] [PubMed] [Google Scholar]
- Neufang S, Specht K, Hausmann M, Güntürkün O, Herpertz-Dahlmann B, Fink GR, & Konrad K (2009). Sex differences and the impact of steroid hormones on the developing human brain. Cerebral Cortex, 19(2), 464–473. 10.1093/cercor/bhn100 [DOI] [PubMed] [Google Scholar]
- Ngo CT, Alm KH, Metoki A, Hampton W, Riggins T, Newcombe NS, & Olson IR (2017). White matter structural connectivity and episodic memory in early childhood. Developmental Cognitive Neuroscience, 28, 41–53. 10.1016/j.dcn.2017.11.001 [DOI] [PMC free article] [PubMed] [Google Scholar]
- Olsen RK, Moses SN, Riggs L, & Ryan JD (2012). The hippocampus supports multiple cognitive processes through relational binding and comparison. Frontiers in Human Neuroscience, 6, 146. 10.3389/fnhum.2012.00146 [DOI] [PMC free article] [PubMed] [Google Scholar]
- Østby Y, Tamnes CK, Fjell AM, & Walhovd KB (2011). Morphometry and connectivity of the fronto-parietal verbal working memory network in development. Neuropsychologia, 49(14), 3854–3862. 10.1016/j.neuropsychologia.2011.10.001 [DOI] [PubMed] [Google Scholar]
- Pinheiro J, Bates D, DebRoy S, Sarkar D, Heisterkamp S, Van Willigen B, & Maintainer R (2019). Package ‘nlme’. Linear and nonlinear mixed effects models, version, 3–141.
- Poppenk J, Evensmoen HR, Moscovitch M, & Nadel L (2013). Long-axis specialization of the human hippocampus. Trends in Cognitive Sciences, 17(5), 230–240. 10.1016/j.tics.2013.03.005 [DOI] [PubMed] [Google Scholar]
- Poppenk J, & Moscovitch M (2011). A hippocampal marker of recollection memory ability among healthy young adults: contributions of posterior and anterior segments. Neuron, 72(6), 931–937. 10.1016/j.neuron.2011.10.014 [DOI] [PubMed] [Google Scholar]
- Rajah MN, Kromas M, Han JE, & Pruessner JC (2010). Group differences in anterior hippocampal volume and in the retrieval of spatial and temporal context memory in healthy young versus older adults. Neuropsychologia, 48(14), 4020–4030. 10.1016/j.neuropsychologia.2010.10.010 [DOI] [PubMed] [Google Scholar]
- Rao H, Betancourt L, Giannetta JM, Brodsky NL, Korczykowski M, Avants BB, … & Farah MJ (2010). Early parental care is important for hippocampal maturation: evidence from brain morphology in humans. NeuroImage, 49(1), 1144–1150. 10.1016/j.neuroimage.2009.07.003 [DOI] [PMC free article] [PubMed] [Google Scholar]
- Raz N, Lindenberger U, Rodrigue KM, Kennedy KM, Head D, Williamson A, … & Acker JD (2005). Regional brain changes in aging healthy adults: general trends, individual differences and modifiers. Cerebral Cortex, 15(11), 1676–1689. 10.1093/cercor/bhi044 [DOI] [PubMed] [Google Scholar]
- Riggins T, Blankenship SL, Mulligan E, Rice K, & Redcay E (2015). Developmental differences in relations between episodic memory and hippocampal subregion volume during early childhood. Child Development, 86(6), 1710–1718. 10.1111/cdev.12445 [DOI] [PMC free article] [PubMed] [Google Scholar]
- Riggins T, Geng F, Blankenship SL, & Redcay E (2016). Hippocampal functional connectivity and episodic memory in early childhood. Developmental Cognitive Neuroscience, 19, 58–69. 10.1016/j.dcn.2016.02.002 [DOI] [PMC free article] [PubMed] [Google Scholar]
- Riggins T, Geng F, Botdorf M, Canada K, Cox L, & Hancock GR (2018). Protracted hippocampal development is associated with age-related improvements in memory during early childhood. NeuroImage, 174, 127–137. 10.1016/j.neuroimage.2018.03.009 [DOI] [PMC free article] [PubMed] [Google Scholar]
- Schlichting ML, Guarino KF, Schapiro AC, Turk-Browne NB, & Preston AR (2017). Hippocampal Structure Predicts Statistical Learning and Associative Inference Abilities during Development. Journal of Cognitive Neuroscience, 29(1), 37–51. 10.1162/jocn [DOI] [PMC free article] [PubMed] [Google Scholar]
- Selmeczy D, Fandakova Y, Grimm KJ, Bunge SA, & Ghetti S (2018). Longitudinal Trajectories of Hippocampal and Prefrontal Contributions to Episodic Retrieval: Effects of Age and Puberty. Developmental Cognitive Neuroscience. 10.1016/j.dcn.2018.10.003 [DOI] [PMC free article] [PubMed] [Google Scholar]
- Seress L (2001). Morphological changes of the human hippocampal formation from midgestation to early childhood. In Collins ML & Nelson CA (Eds.), Handbook of Developmental Cognitive Neuroscience (pp. 45–58). Cambridge, MA: The MIT Press. [Google Scholar]
- Small SA (2002). The longitudinal axis of the hippocampal formation: its anatomy, circuitry, and role in cognitive function. Reviews in the Neurosciences, 13(2), 183–194. 10.1515/REVNEURO.2002.13.2.183 [DOI] [PubMed] [Google Scholar]
- Squire LR, & Wixted JT (2011). The cognitive neuroscience of human memory since HM. Annual Review of Neuroscience, 34, 259–288. 10.1146/annurev-neuro-061010-113720 [DOI] [PMC free article] [PubMed] [Google Scholar]
- Strange BA, Witter MP, Lein ES, & Moser EI (2014). Functional organization of the hippocampal longitudinal axis. Nature Reviews Neuroscience, 15(10), 655–669. 10.1038/nrn3785 [DOI] [PubMed] [Google Scholar]
- Tamnes C, Bos M, van de Kamp F, Peters S, & Crone E (2018). Longitudinal development of hippocampal subregions from childhood to adulthood. Developmental Cognitive Neuroscience, 30, 212–222. 10.1016/j.dcn.2018.03.009 [DOI] [PMC free article] [PubMed] [Google Scholar]
- Tamnes CK, Walhovd KB, Dale AM, Østby Y, Grydeland H, Richardson G, … & Holland D (2013). Brain development and aging: overlapping and unique patterns of change. NeuroImage, 68, 63–74. 10.1016/j.neuroimage.2012.11.039 [DOI] [PMC free article] [PubMed] [Google Scholar]
- Teicher MH, Anderson CM, & Polcari A (2012). Childhood maltreatment is associated with reduced volume in the hippocampal subfields CA3, dentate gyrus, and subiculum. Proceedings of the National Academy of Sciences, 109(9), E563–E572. 10.1073/pnas.1115396109 [DOI] [PMC free article] [PubMed] [Google Scholar]
- Tottenham N, & Sheridan MA (2010). A review of adversity, the amygdala and the hippocampus: a consideration of developmental timing. Frontiers in Human Neuroscience, 3, 68. 10.3389/neuro.09.068.2009 [DOI] [PMC free article] [PubMed] [Google Scholar]
- Uematsu A, Matsui M, Tanaka C, Takahashi T, Noguchi K, Suzuki M, & Nishijo H (2012). Developmental trajectories of amygdala and hippocampus from infancy to early adulthood in healthy individuals. PLoS One, 7(10), e46970. 10.1371/journal.pone.0046970 [DOI] [PMC free article] [PubMed] [Google Scholar]
- Utsunomiya H, Takano K, Okazaki M, & Mitsudome A (1999). Development of the temporal lobe in infants and children: analysis by MR-based volumetry. American Journal of Neuroradiology, 20(4), 717–723. [PMC free article] [PubMed] [Google Scholar]
- Vargha-Khadem F, Gadian DG, Watkins KE, Conelly A, Van Paesschen W, & Mishkin M (1997). Differential effects of early hippocampal pathology on episodic and semantic memory. Science, 277(5324), 376–380. 10.1126/science.277.5324.376 [DOI] [PubMed] [Google Scholar]
- Vijayakumar N, Mills KL, Alexander-Bloch A, Tamnes CK, & Whittle S (2018). Structural brain development: a review of methodological approaches and best practices. Developmental Cognitive Neuroscience, 33, 129–148. 10.1016/j.dcn.2017.11.008 [DOI] [PMC free article] [PubMed] [Google Scholar]
- Wang H, Das SR, Suh JW, Altinay M, Pluta J, Craige C, … & Alzheimer’s Disease Neuroimaging Initiative. (2011). A learning-based wrapper method to correct systematic errors in automatic image segmentation: consistently improved performance in hippocampus, cortex and brain segmentation. NeuroImage, 55(3), 968–985. 10.1016/j.neuroimage.2011.01.006 [DOI] [PMC free article] [PubMed] [Google Scholar]
- Watson C, Andermann F, Gloor P, Jones-Gotman M, Peters T, Evans A, … & Leroux G (1992). Anatomic basis of amygdaloid and hippocampal volume measurement by magnetic resonance imaging. Neurology, 42(9), 1743–1743. 10.1212/wnl.42.9.1743 [DOI] [PubMed] [Google Scholar]
- Wechsler D (2003). Wechsler intelligence scale for children – Fourth edition (WISC-IV). The Psychological Corporation; San Antonio, TX. [Google Scholar]
- Wechsler D (2012). Wechsler preschool and primary scale of intelligence—fourth edition. The Psychological Corporation; San Antonio, TX. [Google Scholar]
- Weiss AP, DeWitt I, Goff D, Ditman T, & Heckers S (2005). Anterior and posterior hippocampal volumes in schizophrenia. Schizophrenia Research, 73(1), 103–112. 10.1016/j.schres.2004.05.018 [DOI] [PubMed] [Google Scholar]
- Wendelken C, Lee JK, Pospisil J, Sastre III M, Ross JM, Bunge SA, & Ghetti S (2015). White matter tracts connected to the medial temporal lobe support the development of mnemonic control. Cerebral Cortex, 25(9), 2574–2583. 10.1093/cercor/bhu059 [DOI] [PMC free article] [PubMed] [Google Scholar]
- Wickham H (2016). ggplot2: elegant graphics for data analysis. Springer. 10.1007/978-3-319-24277-4 [DOI] [Google Scholar]
Associated Data
This section collects any data citations, data availability statements, or supplementary materials included in this article.
Data Availability Statement
The data that support the findings of this study are available from the corresponding author upon reasonable request.