eLife logoLink to eLife
. 2021 Sep 17;10:e72040. doi: 10.7554/eLife.72040

‘Fearful-place’ coding in the amygdala-hippocampal network

Mi-Seon Kong 1,2, Eun Joo Kim 1, Sanggeon Park 3,4, Larry S Zweifel 2,5, Yeowool Huh 4,6, Jeiwon Cho 3,, Jeansok J Kim 1,
Editors: Joshua Johansen7, Laura L Colgin8
PMCID: PMC8500711  PMID: 34533133

Abstract

Animals seeking survival needs must be able to assess different locations of threats in their habitat. However, the neural integration of spatial and risk information essential for guiding goal-directed behavior remains poorly understood. Thus, we investigated simultaneous activities of fear-responsive basal amygdala (BA) and place-responsive dorsal hippocampus (dHPC) neurons as rats left the safe nest to search for food in an exposed space and encountered a simulated ‘predator.’ In this realistic situation, BA cells increased their firing rates and dHPC place cells decreased their spatial stability near the threat. Importantly, only those dHPC cells synchronized with the predator-responsive BA cells remapped significantly as a function of escalating risk location. Moreover, optogenetic stimulation of BA neurons was sufficient to cause spatial avoidance behavior and disrupt place fields. These results suggest a dynamic interaction of BA’s fear signalling cells and dHPC’s spatial coding cells as animals traverse safe-danger areas of their environment.

Research organism: Rat

Introduction

Biological fitness requires that all organisms foraging for resources, such as food, water, and shelter, be able to discern and respond appropriately to varied landscapes of danger (Bolles, 1970; Lima and Dill, 1990; Pellman and Kim, 2016). Consistent with this view, animal and human studies have found that distinct anti-predatory behaviors and neural circuits are engaged in distal vs. proximal threats (Fanselow and Lester, 1988; Mobbs et al., 2007). The basic fear system shared across species then likely evolved to guide and shape goal-directed (or purposive) behaviors in risky environments (Brown et al., 1999; LeDoux, 2012; Maren and Fanselow, 1996; Ohman and Mineka, 2001). To date, however, most neurobiological fear research has focused on the acquisition and extinction mechanisms of Pavlovian fear response magnitudes (Fanselow and LeDoux, 1999; Maren and Quirk, 2004), while overlooking how the brain responds to spatial dynamics of threats in nature.

Initial studies that explored the spatial component of danger continued to use basic conditioning paradigms and found that a conditioned freezing response was associated with remapping of dorsal hippocampal cornu ammonis 1 (CA1) place fields in rats randomly searching for food pellets in an experimental chamber where they previously received painful periorbital shocks (contextual fear) or in a control chamber when presented with conditioned white-noise pip stimulus (auditory fear; Moita et al., 2003; Moita et al., 2004). A subsequent study, simulating a scenario of a hunger-motivated prey leaving its nest to look for food and encountering a predator, revealed that fear reflexively elicited by a looming robotic predator altered place cell activities in rats foraging for food in a large arena as a function of proximity to danger; an effect that was abolished with lesions to the amygdala (Kim et al., 2015). These studies then suggest that both acquired and innate fear can alter spatial representation in the hippocampus, irrespective of whether animals are displaying immobility (Moita et al., 2003; Moita et al., 2004) or rapid escape (Kim et al., 2015) fear responses. More recently, fear-induced remapping of CA1 place cell was also confirmed using miniscope calcium imaging and inhibitory avoidance task in mice (Schuette et al., 2020). However, since only place cell firing characteristics were examined in isolation in the aforementioned studies (Kim et al., 2015; Moita et al., 2003; Moita et al., 2004; Schuette et al., 2020), how the dimensions of fear and space interact in real time at the coding level as animals navigate risky environments remain unknown. To address this, the present study recorded, for the first time, neural activities simultaneously in the basal amygdala (BA) and dorsal hippocampus (dHPC), structures implicated in fear and spatial behavior, respectively, in rats using an ecologically relevant ‘approach food-avoid predator’ paradigm (Choi and Kim, 2010; Kim et al., 2018). We then applied optogenetics to determine the functional relationship between the brain’s fear and spatial systems.

Results

Foraging behavior under a predatory risk

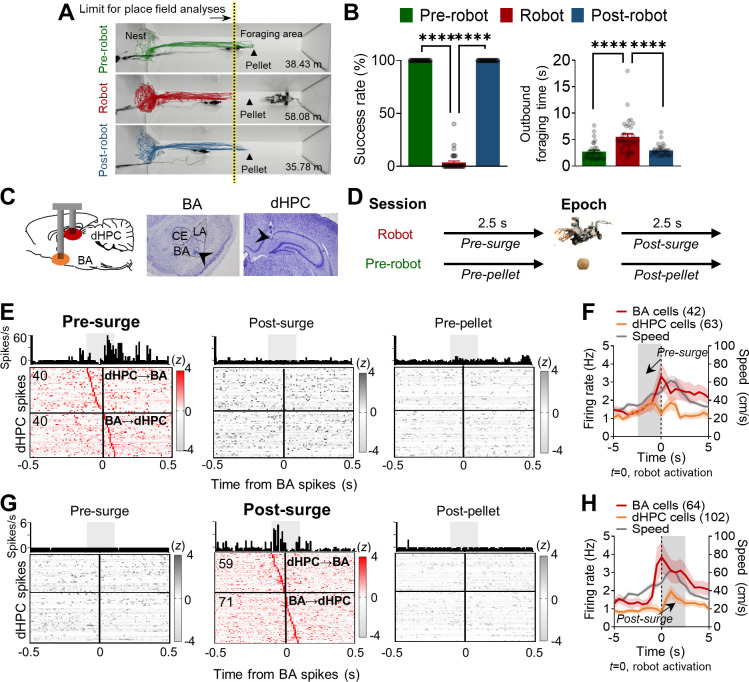
Rats (n = 4) implanted with micro-drive arrays in both BA and dHPC (Figure 1—figure supplement 1A) were trained to leave the nest area to procure a 0.5 g food pellet in a tapered foraging arena that enabled adequate visit maps for reliable place-responsive dHPC cell analyses and recurrent predatory interaction for consistent fear-responsive BA cell analyses (Figure 1A). Tetrodes were gradually advanced (<160 μm per day) until complex spike cells were encountered, which were identified on the basis of electroencephalogram signals and single-unit spike patterns. Upon encountering stable spiking cells, the hunger-motivated animals underwent successive ‘pre-robot,’ ‘robot,’ and ‘post-robot’ recording sessions (8–10 pellet attempts/session; Figure 1A). During the pre-robot session, all animals promptly exited the nest, obtained the pellet, and returned with it to the nest for consumption (100% success; Figure 1B). During the robot session, each time the animals approached the pellet, the looming robot caused them to flee to the nest. Specifically, rats exhibited significantly increased outbound foraging latency due to pauses in approaching the pellet (pre-robot, 2.73 ± 0.29 s; robot, 5.53 ± 0.57 s; post-robot, 2.97 ± 0.18 s; Figure 1B) and decreased ability to secure the pellet (3.6% success; Figure 1B). Representative trajectories during each session showed that the rat traveled more distance during the robot session, indicating multiple failed attempts to retrieve the pellet because of the predatory threats (Figure 1A). Once the robot was removed (the post-robot session), all rats subsequently reverted to the pre-robot foraging success rate (100%). Because the looming robot prevented the animals from reaching the pellet location, subsequent analyses excluded those dHPC cells that had place fields beyond the foraging limit (where the animal did not visit during the robot session) to equate the nest-to-foraging distance throughout the sessions (Figure 1A, yellow-tinted dotted line).

Figure 1. Simultaneous basal amygdala (B) and dorsal hippocampus (dHPC) recordings in foraging rats facing a predatory threat.

(A) Overlaid images of the foraging apparatus and representative trajectories of a rat during the pre-robot, robot, and post-robot sessions. The number below each apparatus indicates the total distance traveled from the representative trajectory data. Contrary to 100% successful trials during the pre-robot and post-robot sessions, this rat made 14 attempts to procure the pellet during the robot session but failed each time. The limits of place field analyses for all sessions were matched to the yellow-tinted dotted line denoting the extent of the place cells recorded during the robot session. (B) Left panel: the mean success rate of pellet acquirement (± SEM) during pre-robot, robot, and post-robot session (****p<0.0001, n = 32 recording days from four rats). Right panel: the mean outbound foraging time (± SEM) from the gate opening for animals to reach the pellet (pre-robot and post-robot sessions) or the robot trigger location (robot session) (****p<0.0001, n = 32 recording days from four rats). Each circle represents each recording day’s data. (C) A schema of simultaneous recordings (left) and photomicrographs of tetrode tips in BA (middle) and dHPC (right). (D) Simultaneously recorded 1999 BA-dHPC unit pairs were evaluated at the four different time epochs: 2.5 s before each robot activation (pre-surge; robot session), 2.5 s after each robot activation (post-surge; robot session), 2.5 s before each pellet procurement (pre-pellet; pre-robot session), and 2.5 s after each pellet acquirement (post-pellet; pre-robot session). (E) Cross-correlograms (CCs) of all BA-dHPC cell pairs (n = 80) that showed significant spike synchrony during the pre-surge epoch (left) but not during the post-surge (middle) and pre-pellet (right) epochs. CCs of a representative pair are shown above each epoch data, 10 ms bin (the gray shaded area indicates the time window for statistical significance, –100 ms to +100 ms from the BA spikes). The vertical lines (0) indicate the time when the reference BA spikes occurred. The horizontal lines indicate the borders between the presumable dHPC→BA pairs (above the line) and BA→dHPC pairs (below the line). (F) The mean firing rates of BA and dHPC cells showed significant spike synchrony during the pre-surge epoch (the gray shaded area, BA = 42 cells, dHPC = 63 cells; overlapping cells were counted once) and the mean speed of the animals (n = 20 recording days from three rats). The dark lines and shaded bands represent the mean and SEM. (G) CCs of all BA-dHPC cell pairs (n = 130) that showed significant spike synchrony during the post-surge epoch (middle) but not during the pre-surge (left) and post-pellet (right) epochs. CCs of a representative pair are shown above each epoch data. (H) The mean firing rates of BA and dHPC cells showed significant spike synchrony during the post-surge epoch (the gray shaded area, BA = 64 cells, dHPC = 102 cells; overlapping cells were counted once) and the mean speed of the animals (n = 20 recording days from three rats). LA: lateral amygdala; CE: central amygdala.

Figure 1.

Figure 1—figure supplement 1. Simultaneous recordings from the basal amygdala (BA) and dorsal hippocampus (dHPC).

Figure 1—figure supplement 1.

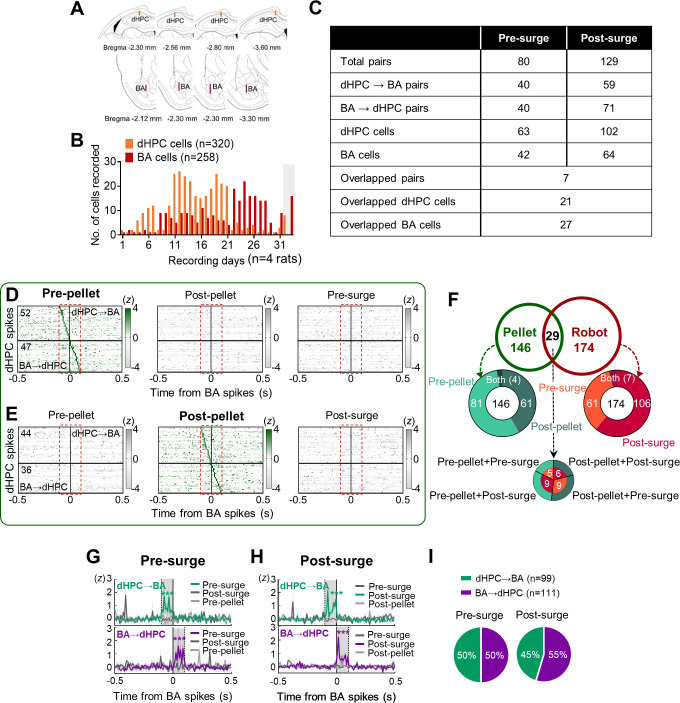
(A) Histological reconstructions of the trajectory of the recording sites (bars) in the dHPC and the BA. (B) The number of simultaneously recorded cells during each recording day. The gray shaded area represents 2 days where cells were recorded from only one region. (C) A detailed composition of the significant pairs: the actual number of dHPC and BA cells and the number of overlapped pairs/cells between epochs. (D) Cross-correlograms (CCs) of all BA-dHPC cell pairs (n = 99) that showed significant spike synchrony during the pre-pellet epoch (left) but not during the post-pellet (middle) and pre-surge (right) epochs (10 ms bin). The red dashed rectangles indicate the time window for statistical significance, –100 ms to +100 ms from the BA spikes. The vertical lines (0) indicate the time when the reference BA spikes occurred. The horizontal lines indicate the borders between the presumed dHPC→BA pairs (above the line) and BA→dHPC pairs (below the line). (E) CCs of all BA-dHPC cell pairs (n = 80) that showed significant spike synchrony during the post-pellet epoch (middle) but not during the pre-pellet (left) and post-surge (right) epochs. (F) The proportions of BA-dHPC pairs that showed significant spike synchrony during the pellet procurements (pre-pellet, post-pellet; n = 146), robot encounters (pre-surge, post-surge; n = 174), or both pellet-robot (n = 29). (G) The Z-scored dHPC spikes at the time of BA spikes are shown in upper (dHPC→BA pairs, ****p<0.0001) and bottom (BA→dHPC pairs, ****p<0.0001) during the pre-surge. The dark lines represent the mean, and the shaded bands represent SEM. (H) The Z-scored dHPC spikes at the time of BA spikes are shown in upper (dHPC→BA pairs, ****p<0.0001) and bottom (BA→dHPC pairs, ****p<0.0001) during the post-surge. (I) The percentage of the dHPC→BA and BA→dHPC cell pairs in the pre-surge and post-surge peaked CCs (p=0.787).

Spike synchrony between BA and dHPC units during the predatory encounter

To investigate whether and how fear coding BA cells and spatial coding dHPC cells interact during an ‘approach food-avoid predator’ conflict situation, we performed simultaneous single-unit recordings from these two brain regions during risky foraging behavior paradigm (Figure 1C, Figure 1—figure supplement 1A and B). To directly assess spike synchrony while rats attempted to procure a pellet in a fearful situation, we generated cross-correlograms (CCs) with BA cells as the reference with four different time epochs: (i) pre-pellet, 2.5 s epoch before pellet procurement during the pre-robot session; (ii) post-pellet, 2.5 s epoch after the pellet procurement during the pre-robot session; (iii) pre-surge, 2.5 s epoch before the robot activation during the robot session; and (iv) post-surge, 2.5 s epoch after the robot activation during the robot session (Figure 1D). The epoch size (2.5 s) for assessing BA-dHPC correlational firing was chosen based on the mean outbound foraging time during the pre-robot session, which reflects the time when rats were supposedly in the foraging area (Figure 1B). The raw CCs were corrected by ‘shift-predictor,’ where 100 times of trial shuffles were applied to exclude the chance of false correlations due to covariation or nonstationary firing rate from the BA and dHPC (see Materials and methods for the detailed steps for the CCs analyses). All corrected CCs were then identified by the following criteria (Kim et al., 2018): (i) the average firing rate during each epoch was >0.1 Hz in both BA and dHPC cells; (ii) CCs showed significant peaks, which exceeded the Z-score of 3; and (iii) the peak Z-score fell into a –100 ms and +100 ms time window around the reference BA spikes. Given both direct and indirect projections between the two regions (Petrovich et al., 2001; Pitkanen et al., 2000; Rei et al., 2015; Saunders et al., 1988; Wang and Barbas, 2018), the ±100 ms time window was used for the spike synchrony and projection directionality (Burgos-Robles et al., 2017; Kim et al., 2018; Narayanan and Laubach, 2009; Wirtshafter and Wilson, 2020).

Among all simultaneously recorded 1999 pairs, 714 pairs met the minimum firing rate requirement. From 714 pairs, 30% of pairs (n = 210) showed significant synchrony during pre- or post-surge epochs. During the pre-surge epoch, 80 pairs showed significant spike synchrony (Figure 1E, left panel, 11.2%). The same pairs, however, did not show correlated firing during post-surge and pre-pellet epochs (Figure 1E, middle and right panels). Another subset of BA-dHPC cell pairs (n = 130, 18%) showed significant spike synchrony during the post-surge epoch, but not during the pre-surge and post-pellet epochs (Figure 1G). There were only seven pairs (3%) that showed significant synchrony during both pre- and post-surge epochs (Figure 1—figure supplement 1C), and the different sets of neuronal pairs showed distinct firing patterns during the robot interactions (Figure 1F and H and Figure 1—figure supplement 1C). While there were also BA-dHPC cell pairs that showed distinct synchrony during the pellet procurement (n = 175 pairs; Figure 1—figure supplement 1D and E), only 29 pairs revealed synchrony to both aversive robot and appetitive pellet experiences (Figure 1—figure supplement 1F). Altogether, these data indicate that distinct subsets of BA-dHPC cell pairs communicate strongly and specifically either before the robot surge (presumably when the animal was facing the robot) or after the robot attack during the risky robot session, but not during the safe pellet procurement trials.

We then explored the directionality of spike synchrony during the robot encounters (Figure 1E and G and Figure 1—figure supplement 1G–I). If the dHPC spike peak was between –100 ms and 0 ms from the BA spikes, this pair was identified as a dHPC leading pair (dHPC→BA), whereas if the dHPC spike peak was between 0 ms and +100 ms from the BA spikes, the pair was defined as a BA leading pair (BA→dHPC). From the pairs that showed significant spike synchrony during the pre-surge, 40 pairs were identified as dHPC→BA (above the horizontal line in Figure 1E, pre-surge), and 40 pairs were identified as BA→dHPC (below the horizontal line in Figure 1E, pre-surge). The correlated spikes were significantly higher during the pre-surge than post-surge and pre-pellet in both directions (Figure 1—figure supplement 1G). Among the pairs that showed significant spike synchrony during the post-surge, 59 and 71 pairs were identified as dHPC→BA (above the horizontal line in Figure 1G, post-surge) and BA→dHPC (below the horizontal line in Figure 1G, post-surge), respectively, and their correlated firing was significantly higher during the post-surge than the pre-surge and post-pellet (Figure 1—figure supplement 1H). The proportions of the dHPC→BA and BA→dHPC cell pairs were not different between the pre-surge and post-surge peaked CCs (Figure 1—figure supplement 1I) with the increased number of significant pairs in both directions during the post-surge epochs (from 80 to 130). These data suggest that a subset of BA and dHPC cells show selective synchronizations during the predatory interaction.

BA and dHPC cell heterogeneity and their dynamic interaction during risky foraging

To determine whether heterogeneous encoding of the predatory threat situation in the BA and dHPC neurons could differently shape the spike synchrony between the two regions, we categorized simultaneously recorded 250 BA putative pyramidal cells (Figure 2—figure supplement 1B) and 319 dHPC place cells based on their responses to the robot (BA cells) and firing locations (dHPC cells).

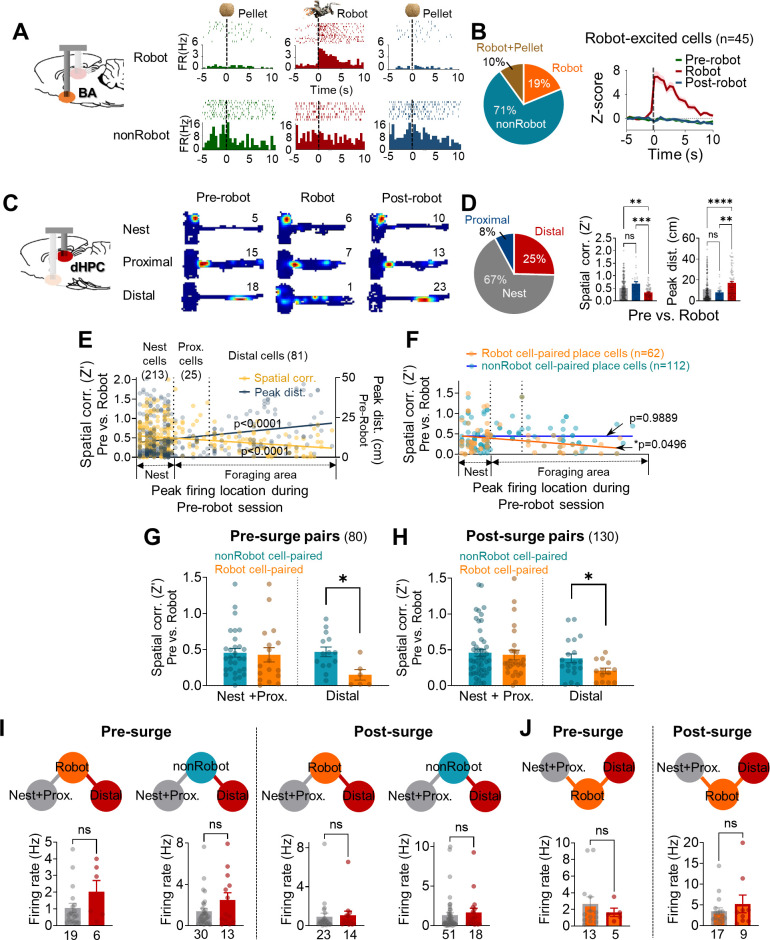
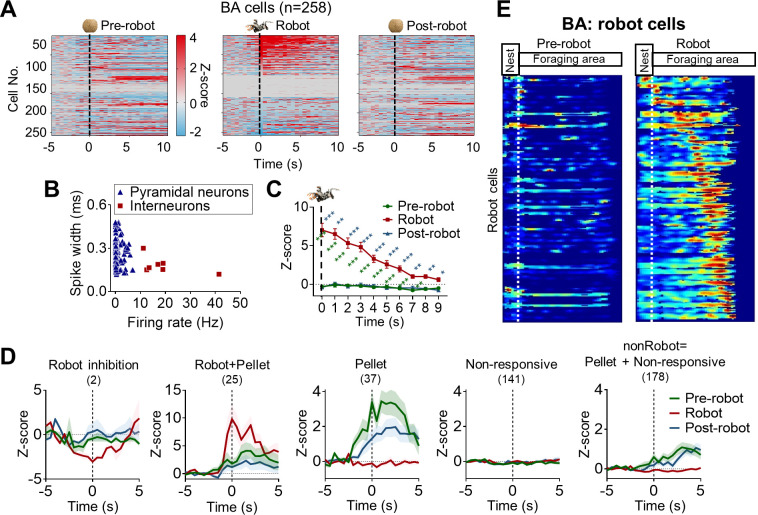
Amongst 250 BA cells, 19% and 15% of cells exhibited differential firing characteristics (either excited or inhibited, Supplementary file 1A) exclusively to the robot (Robot cells, n = 47; Robot-excited cells, 45 cells, Figure 2A and B; Robot-inhibited cells, 2 cells, Figure 2—figure supplement 1D) and pellet (denoted as Pellet cells, n = 37, Figure 2—figure supplement 1D), respectively. Another subset of BA cells (10%) responded to both the robot and pellet (denoted as Robot + Pellet cells, n = 25, Figure 2—figure supplement 1D), and the rest of the BA cells were not responsive to either the robot or pellet (denoted as non-responsive cells, n = 141, 56.4%, Figure 2—figure supplement 1D). The non-responsive cells and the Pellet cells were categorized as ‘nonRobot’ cells. The Robot + Pellet cells were not included in the further analyses to exclusively compare robot-responsive and robot-non-responsive cells during the robot surge. Interestingly, BA Robot cells may also continue to convey threat information to output structures, perhaps to prepare various anti-predatory defensive behaviors, as they exhibited sustained activities that persisted ~10 s after the robot activations (Figure 2—figure supplement 1C), which is much longer than ~2 s duration reported in lateral amygdala (LA) neurons (Kim et al., 2018).

Figure 2. Spike synchrony between dorsal hippocampus (dHPC) units and basal amygdala (BA) units during the robot-predator encounter.

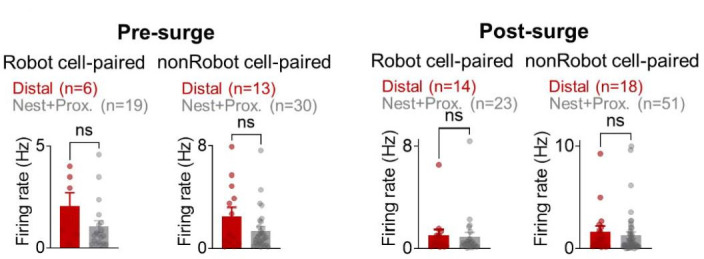
(A) The BA raster plots and peri-event histograms (PETHs) of representative Robot cell (top) and nonRobot cell (bottom) during pre-robot, robot, and post-robot sessions. (B) The percentage of different categories of BA cells (left) and the normalized population activity of all robot-excited cells during all three sessions (n = 45). (C) dHPC place fields from the nest, proximal, and distal cells during pre-robot, robot, and post-robot sessions (the numerical value represents the peak firing rate). (D) Left: the percentage of three place cell types. Middle: the pixel-by-pixel spatial correlation (Z’) values between the pre-robot and robot sessions of three place cell types (**p=0.0062, ***p=0.0003, nest = 213 cells, proximal = 25 cells, distal = 81 cells). Right: the peak distances between the pre-robot and robot sessions of three place cell types (**p=0.0047, ****p<0.0001). (E) Spatial correlations (yellow, r = −0.2203, p<0.0001) and peak distances (navy, r = 0.2594, p<0.0001) of all place cells between pre-robot and robot sessions are plotted as a function of the peak firing location during the pre-robot session (left, nest; right, end of the foraging distance; circles individual data with regression lines). (F) Spatial correlations (pre-robot vs. robot sessions) of place cells that co-fired with Robot (orange circles) or with nonRobot (blue circles) cells are plotted as a function of the peak firing location during the pre-robot session (62 Robot cell-paired place cells, linear regression, r = −0.2446, *p=0.0496; 112 nonRobot cell-paired place cells, linear regression, r = −0.001316, p=0.9889). (G) The spatial correlations between the pre-robot and robot sessions of the nest + proximal cells paired with Robot vs. nonRobot cells during the pre-surge (p=0.7961) and the distal cells paired with Robot vs. nonRobot cells during the pre-surge (*p=0.0119). (H) The spatial correlations between the pre-robot and robot sessions of the nes + proximal cells paired with Robot vs. nonRobot cells during the post-surge (p=0.5939) and the distal cells paired with Robot vs. nonRobot cells during the post-surge (*p=0.0430). (I) The mean firing rates between the Robot cell-paired nest + proximal cells and the Robot cell-paired distal cells during the pre-surge epoch (the first and second graphs) and during the post-surge epoch (the third and fourth graphs). The numeric values represent the number of cells in each cell type. (J) The mean firing rates of nest + proximal or distal cell-paired Robot cells during the pre-surge epoch (left) and during the post-surge epoch (right). The numbers below each graph represent the number of cells, and each circle represents individual cell data. Data are presented as mean ± SEM.

Figure 2.

Figure 2—figure supplement 1. The basal amygdala and the risky foraging behaviors.

Figure 2—figure supplement 1.

(A) Z-scored activities of all basal amygdala (BA) cells (258 cells, pyramidal cells + interneurons) during –5 s to 10 s after the pellet procurement for the pre-robot (left) and post-robot (right) sessions and during –5 s to 10 s after the robot activation for the robot session (middle). Individual cell activity is presented in the same row of each session. (B) BA units were classified as putative pyramidal neurons (blue triangles) and putative interneurons (red square). Only putative pyramidal cells (n = 250) were included in further analyses. (C) Comparisons of Z-scored activities of Robot cells after the pellet acquirement and robot activation. The robot-induced increased activities lasted over a period of 10 s, which was beyond the robot activation (green asterisks: pre-robot vs. robot; blue asterisks: robot vs. post-robot). (D) Z-scored activities of Robot-inhibited cells, Robot + Pellet cells, Pellet cells, Non-responsive cells, and nonRobot cells ( = Pellet cells + Non-responsive cells) during –5 s to 5 s after the pellet acquirement for the pre- and post-robot sessions and the robot activation for the robot session. (E) The firing maps of all Robot cells in the BA during the pre-robot (left) and robot (right) trials. All cells were aligned to the peak firing location during the robot session. The x-axis denotes the distance from the nest. The white dotted line in each figure separates the nest and the foraging area. For each map, red represents the maximal firing rate.
Figure 2—figure supplement 2. The dorsal hippocampus and the risky foraging behaviors.

Figure 2—figure supplement 2.

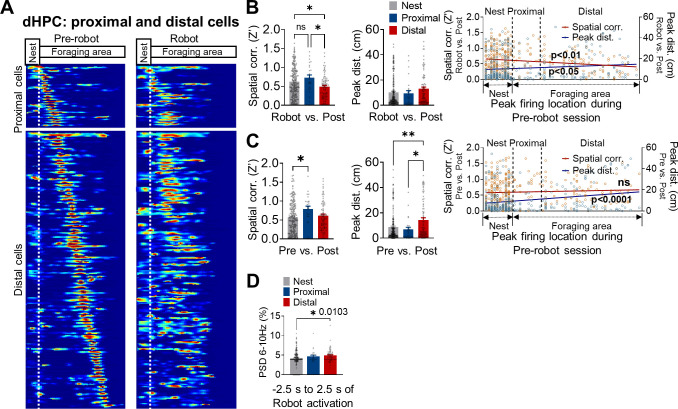
(A) The place maps of the proximal and distal cells during the pre-robot (left) and robot (right) sessions. All cells are aligned to the peak firing location of the pre-robot session. The x-axis denotes the distance from the nest. The white dotted line in each figure separates the nest and the foraging area. Each map shows its maximal firing rate in red. (B) Differences in the Z’ value (left) and peak distance (middle) between the robot and post-robot sessions are plotted in the order of X position of rats (spatial correlations: individual data, orange squares; regression line, dark red; r = −0.1755, **p=0.0016; peak distances: individual data, blue circles; regression line, dark blue; r = 0.11, *p=0.0493). (C) Differences in the Z’ value (left) and peak distance (middle) between the pre- and post-robot sessions are plotted in the order of X position of rats (spatial correlations: individual data, orange squares; regression line, dark red, r = 0.05898, p=0.2929; peak distances: individual data, blue circles; regression line, dark blue; r = 0.2239, ****p<0.0001). (D) The percentage of theta power from 6 to 10 Hz band during –2.5 s to 2.5 s of the robot activation.
Figure 2—figure supplement 3. Simultaneous recordings from the basal amygdala (BA) and dorsal hippocampus (dHPC) during the risky foraging behaviors.

Figure 2—figure supplement 3.

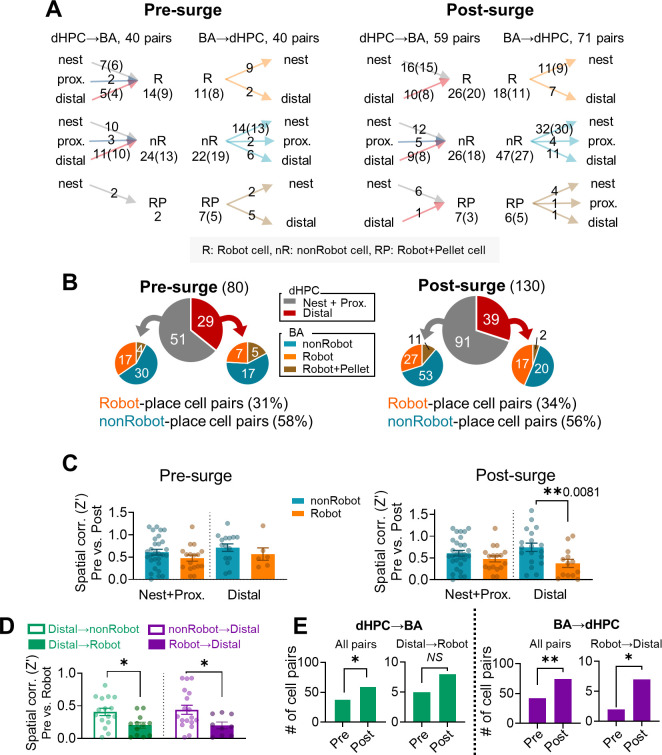
(A) All pairs that fired synchronously during the pre-surge (left) and the post-surge (right) epochs during the robot session. If a cell was in more than one pair, the cell was counted only once and indicated in parentheses. The arrows indicate the direction of information flow. (B) The subdivision of cell pairs that showed significant synchrony during the pre-surge epoch (left) and post-surge epoch (right). (C) Spatial correlations between the pre-robot and post-robot sessions in the nest + proximal and distal cells that had significant spike synchrony with Robot or nonRobot during the pre-surge epoch (left) or post-surge epoch (right, **p=0.0081). (D) Distal cells leading Robot cells (distal→Robot) remapped more during the robot session compared with those paired with nonRobot cells (distal→nonRobot, *p=0.0123). Distal cells led by Robot cells (Robot→distal) remapped more during the robot session compared with those paired with nonRobot cells (nonRobot→distal, *p=0.0321). (E) The numbers of both dHPC→BA and BA→dHPC cell pairs increased during the post-surge epoch compared to the pre-surge epoch (dHPC→BA pairs, χ² = 5.042, p=0.025; BA→dHPC pairs, χ² = 8.828, p=0.003), but the number of Robot cell-distal cell pairs significantly increased during the post-surge epoch only in the BA leading direction (distal→Robot pairs, χ² = 0.692, p=0.405; Robot→distal pairs, χ² = 4.500, p=0.034).
Figure 2—figure supplement 4. The relationships between firing rates and cross-correlations.
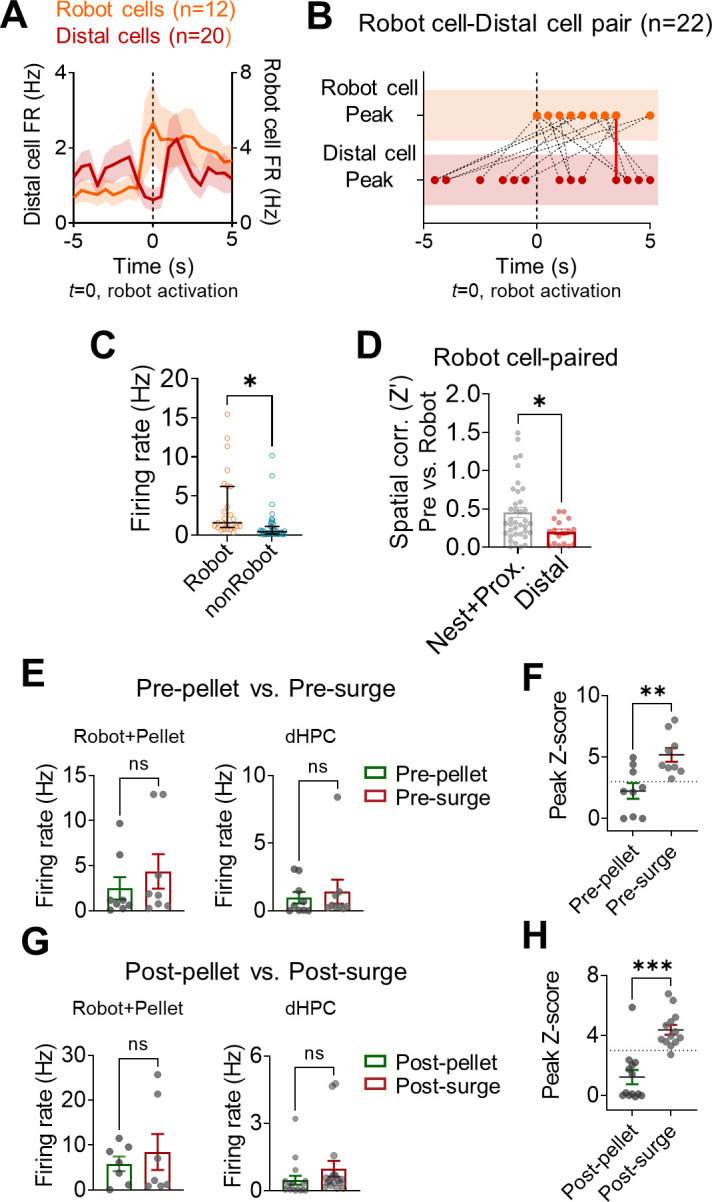
Figure 2—figure supplement 4.

(A) The mean firing rates of Robot and distal cells that showed significant spike synchrony during the pre- and post-surge epochs (overlapping cells were counted once). (B) The peak firing times of Robot cells (top row) and distal cells (bottom row) from the significantly synchronized pairs. Red lines indicate the pairs with peak firings in the same bin (two lines overlapped, 500 ms bin, 3.5 s after the robot activations). (C) The firing rate differences between dorsal hippocampus (dHPC)-Robot paired cells and dHPC-nonRobot paired cells (****p<0.0001). The median and interquartile ranges are indicated in black lines. (D) Spatial correlations between the pre-robot and post-robot sessions in the nest + proximal and distal cells that had significant spike synchrony with Robot cells (*p=0.0126). (E) The mean firing rates of Robot + Pellet (left) and dHPC (right) cells during the pre-pellet vs. pre-surge epochs. (F) The peak Z-scored dHPC spikes at the time of basal amygdala (BA) spikes during the pre-pellet and pre-surge epochs (**p=0.0044). (G, H) Same analyses as (E, F) but from the pairs that showed significant spike synchrony during the post-pellet epoch (***p=0.0006).

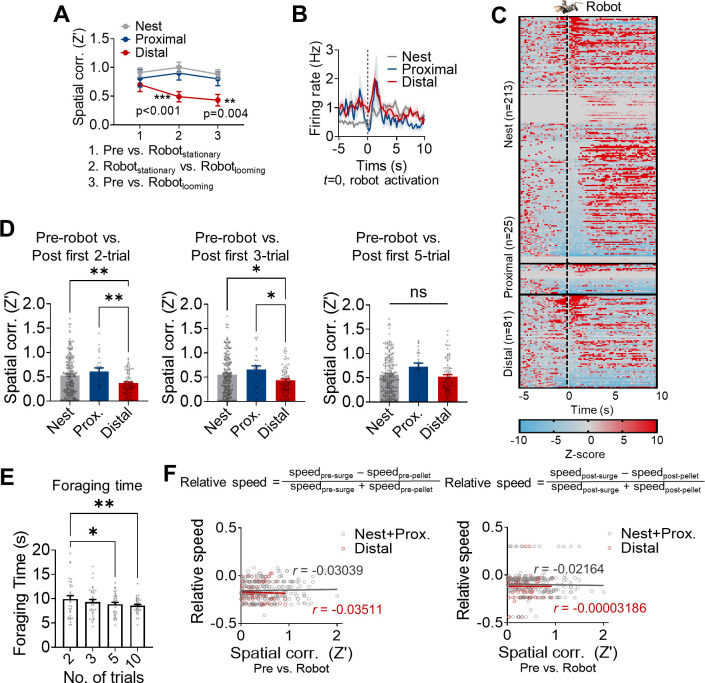
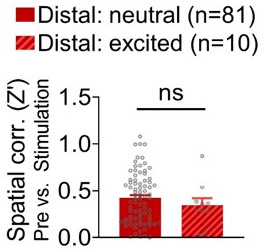
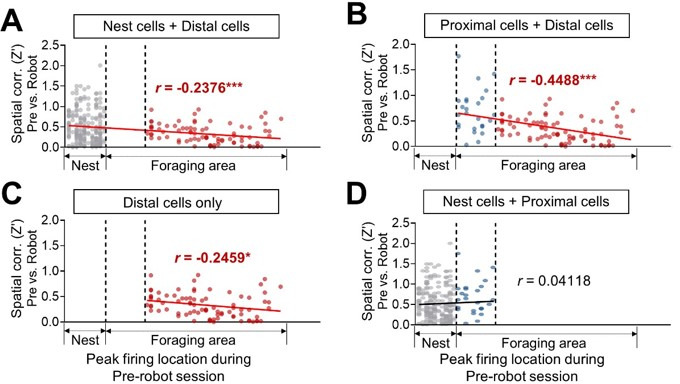
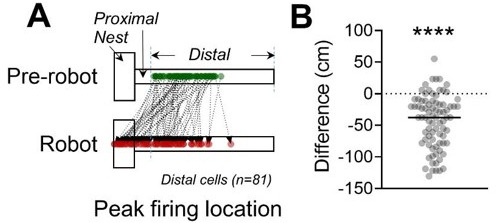
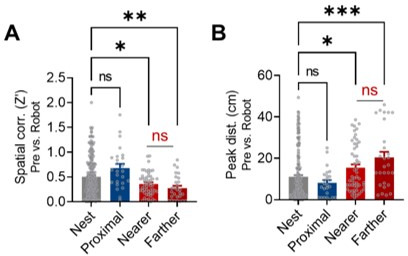
Based on our previous report that the stability of hippocampal place cells decreases as a function of distance from the safe nest, 319 dHPC place cells were classified into three cell types by the location of maximal firing during the pre-robot session (Figure 2C and D and Supplementary file 1B): inside the nest (nest cells, n = 213), near the nest (proximal cells, n = 25), and afar the nest (distal cells, n = 81). Consistent with previous findings, the distal place cells showed less stable firing during the robot session than the nest and proximal cells, as evidenced by the lower spatial correlation (Z′) and the higher peak distance between the pre-robot and robot sessions. In the same way, the spatial correlations and peak distances across the sessions were negatively and positively related to the X positions of the place fields, respectively (Figure 2E). Furthermore, when animals faced the robot-predator (from –2.5 s to 2.5 s of robot activation), distal cells showed increased theta frequency (6–10 Hz) power compared to nest cells (Figure 2—figure supplement 2D). Selective remapping of distal cells during the robot-predator interaction is unlikely due to simple sensory or motor processing per se given the (i) absence of novelty- or sensory-related responses (Appendix 1—figure 1A-C ), (ii) the transient residual effects of the robot experience on the stability of place cells during the earlier trials of the post robot session (Appendix 1—figure 1D and E), and (iii) no correlation between the speed changes and spatial correlation (Appendix 1—figure 1F). For detailed place cell analysis, see Appendix 1.

Next, we explored the synchrony dynamics between the different cell types within the BA and dHPC cells and the effects of the cell-type-specific synchrony on spatial representations of the risky foraging situation in dHPC place cells. To do so, the cell pairs that showed significant spike synchrony during the pre-surge epoch or post-surge epoch were further categorized into different BA (Robot and nonRobot)-dHPC (nest + proximal and distal) cell-type pairs (Figure 2—figure supplement 3A). Nest and proximal cells were combined in succeeding spike synchrony analyses because there was no difference in spatial correlations between these two cell types (Figure 2D).

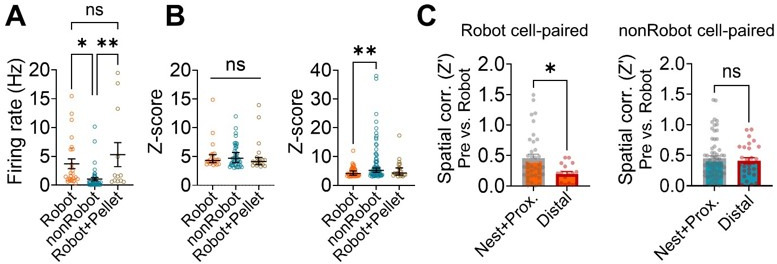
From sub-categorized cell pairs, we investigated whether the stability of dHPC cells was dissimilarly altered when they were paired with different types of BA cells (Robot vs. nonRobot cells). When spatial correlations between the pre-robot and robot sessions were examined, the distal cells that showed significant spike synchrony with BA Robot cells during either the pre- or post-surge epoch were found to remap greater than other distal cells correlated with BA nonRobot cells (Figure 2F–H). These selective effects on distal cells by the BA cell types were not observed in nest + proximal cells. Also, when the spatial correlations between the pre-robot and post-robot sessions were analyzed, this selective reduction of the spatial correlation was found in the distal cells synchronized with Robot cells during the post-surge (not pre-surge) epoch (Figure 2—figure supplement 3C), indicating possible residual effects consequent to the encounter with the predatory robot. When the spatial correlations of the place cells firing together with Robot or nonRobot BA cells were plotted by X positions of the place fields, only the Robot cell-paired, but not nonRobot cell-paired, place cells exhibited decreases in Z´ values as a function of the distance from the safe nest (Figure 2F). Regardless of the directionality, distal cells both leading and led by Robot cells remapped more during the robot session compared with those paired with nonRobot cells (Figure 2—figure supplement 3D). In addition, more Robot→distal cell pairs displayed significant synchronous firing during the post-surge than pre-surge epoch, whereas the proportions of the distal→Robot cell pairs did not differ across the pre- and post-surge epochs (Figure 2—figure supplement 3E); this indicates that predator attacks caused more robot-responsive BA cells to convey signals to the distal hippocampal place cells. Altogether, these data suggest that BA cells encoding imminent threat might be engaged in distance-dependent spatial representations by closely firing with dHPC distal place cells and destabilizing their activities.

It is possible that the effect of spike synchrony on the spatial correlations simply derived from enhanced firing rates in Robot cells and distal cells during the robot session, which increased the ‘chance’ of detecting spike synchrony, rather than due to functional interactions between fear encoding BA cells and place encoding dHPC cells. To examine the likelihood of ‘co-firing modulation effects on cross-correlations and spatial correlations,’ we compared the firing rates of cells that showed significant spike synchrony during pre- and post-surge epochs. First, additional analyses revealed that BA and dHPC cells did not display time-locked responses to robot activation, and the peak response latencies following the robot surge did not overlap between the BA and dHPC cells, especially between Robot cells and distal cells (Figure 1F and H, Figure 2—figure supplement 4A and B). Second, while BA Robot cells increased firing compared to nonRobot cells (Figure 2—figure supplement 1D, Figure 2—figure supplement 4C), there were no reliable differences between Robot cell-paired distal cells vs. nest + proximal cells in their firing rates either during the pre-surge or post-surge period (Figure 2I). Also, although there was no difference in firing rates between Robot cells paired with nest + proximal and distal cells (Figure 2J), only distal cells showed significantly reduced spatial correlations between the pre-robot and robot sessions (Figure 2—figure supplement 4D). Lastly, ‘Robot + Pellet BA-dHPC’ cell pairs that showed significant synchrony during the robot session (pre- and post-surge epochs) did not show reliable synchrony during the pre-robot session (pre- and post-pellet epochs, Figure 2—figure supplement 4E and F), even though Robot + Pellet cells had compatible firing rates during the pre-robot and robot sessions (Figure 2—figure supplement 4E and G). Collectively, these results suggest that the increase in spike synchrony in BA-dHPC cells cannot be ascribed to increased firing rates.

Optogenetic stimulation of the BA and defensive behaviors

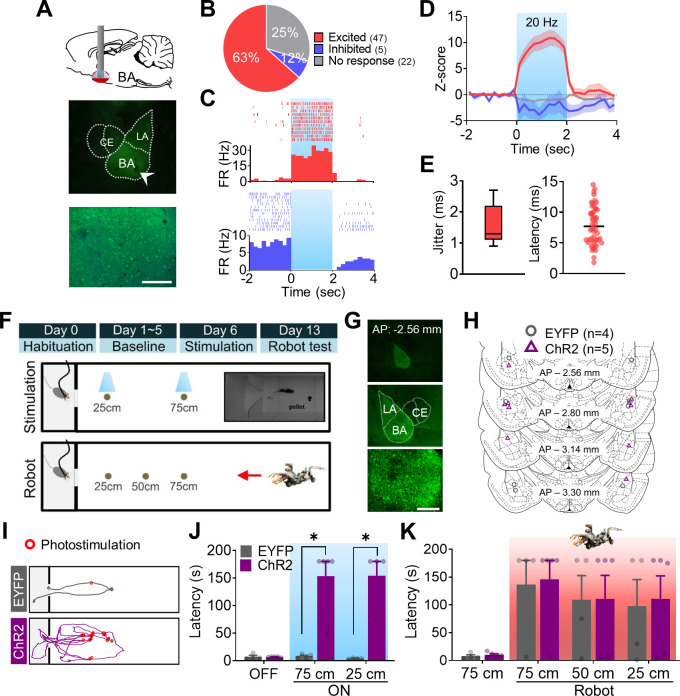
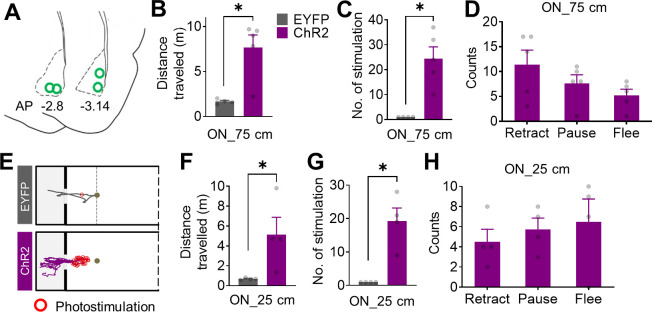
Based on the findings that the BA cell signaling of a predatory robot strongly associated with the dHPC place cell firing less stably near the threat location (present study) and that neither the foraging (e.g., appetitive, motor) behavior nor the distal place field stability was disrupted by the surging robot in amygdala lesioned/inactivated rats (Choi and Kim, 2010; Kim et al., 2015), we investigated the causal role of BA activation on the stability of dHPC place cells. To do so, we first confirmed that optogenetic stimulation effectively altered neural activities in the virus-infected cells (Figure 3A). Specifically, in four animals injected with channelrhodopsin (ChR2)-expressing adeno-associated viruses (AAVs) and implanted with an optrode in the BA (Figure 3—figure supplement 1A), we found that light stimulation increased spiking activity in 47 cells (Z > 3), decreased spiking activity in 5 cells (Z < –3), and produced null effects on spiking activity in 22 cells in the BA (Figure 3B–D). The enhanced firing to light stimulation was reliable throughout the recording session, confirming the efficacy of optogenetic manipulation (Figure 3E). We then tested whether the optogenetic stimulation of the BA induces defensive behaviors in naïve rats sans a predatory robot. ChR2 (n = 5) or EYFP (AAV-EYFP; n = 4) expressing rats received 2 s photostimulation each time they approached the pellet (approximating the robot trigger distance in Figure 1 experiment, ~ 25 cm from the pellet). After the optogenetic test, all rats were challenged with the robot-predator without the photostimulation (Figure 3K). As can be seen, the virus expression was limited to the BLA (Figure 3G), and optic fiber tips were in the middle part of the BLA (Figure 3H). Without the photostimulation, ChR2 and EYFP rats were able to procure the pellet successfully (Figure 3J, OFF). With the stimulations, however, ChR2 animals exhibited significantly longer procurement latencies than EYFP animals to both pellets at 75 cm (Figure 3J, ON-75 cm) and 25 cm (Figure 3J, ON-25 cm). Because each photostimulation ON and succeeding OFF events resulted in fleeing and foraging behaviors, respectively, ChR2 rats traveled more distance and received a greater number of photostimulation compared to EYFP rats (Figure 3—figure supplement 1B, C, F and G). The BA photostimulation also induced pause and retract defensive behaviors in the absence of external threat (Figure 3—figure supplement 1D and H). These effects were not due to tissue damage in the BA incurred by repetitive light stimulations because both ChR2 and EYFP groups fled from the looming robot-predator and consequently took a prolonged time to acquire the pellet (Figure 3K). These results indicate that increased BA pyramidal neuronal activities can elicit robust defensive (fear) behaviors in foraging animals even when there is no explicit threat in the environment.

Figure 3. Optogenetic manipulations of the amygdala alter the foraging behaviors of naïve rats in the absence of external threats.

(A) A schema of optic fiber implant (top) and a photomicrograph of optic fiber tip in the basal amygdala (BA; middle) and overlaid image of EYFP and DAPI (bottom). (B) The percentage of cells that responded differentially to the photostimulation. (C) Peri-event histogram (PETH) and raster plot of a representative excited cell (upper) and inhibited cell (bottom) in response to the photostimulation. The blue shaded area indicates the photostimulation period (2 s, 20 Hz). (D) Z-scored firing rates of each cell type (red, excited; blue, inhibited; gray, no response). The dark lines and shaded bands represent the mean and SEM, respectively. (E) Jitter and latency of light-evoked responses. (F) Illustrations of the experimental design. A pellet was set at 25 cm, 50 cm, or 75 cm distance per trial (inset: the actual foraging apparatus). (G) A representative viral expression in the BA at different magnifications. (H) Placements of optic fiber tips bordering above or within the BA. Gray and purple circles indicate EYFP-expressing (n = 4) and channelrhodopsin (ChR2)-expressing (n = 5) rats, respectively. (I) Representative trajectory plots of EYFP- and ChR2-expressing rats. Red circles indicate the stimulation delivery locations during a 75 cm distance trial. (J) The latency of procuring pellets without photostimulations (OFF, p=0.7843) and with photostimulations during the 75 cm (ON-75 cm, *p=0.0159) and 25 cm (ON-25 cm, *p=0.0286) distance trials. (K) Latency of procuring pellets during the Robot test. The red shaded area indicates the trials with the robot-predator. Data are presented as mean ± SEM, and individual data are represented as distinct symbols. LA: lateral amygdala; CE: central amygdala. Scale bars, 200 µm.

Figure 3.

Figure 3—figure supplement 1. Locomotor data during the optogenetic stimulation.

Figure 3—figure supplement 1.

(A) Histological reconstruction of the optrode tip placements (green circles). (B) During the stimulation session, the ChR2-expressing rats traveled more than the EYFP-expressing rats due to multiple failed attempts at the pellet (ChR2 = 5, EYFP = 4; Mann–Whitney test, U = 0, *p=0.016). (C) The ChR2-expressing rats received a greater number of photostimulations than the EYFP-expressing rats because each photostimulation reliably produced fleeing behavior that prevented securing 75 cm placed pellet (Mann–Whitney U test, U = 0, *p=0.016). (D) Specific types of defensive behaviors elicited by photostimulation. (E) Representative tracking data of the EYFP- and ChR2-expressing rats during photostimulation to closely (25 cm) placed pellet. Red circles indicate the locations of photostimulation delivery. (F) The ChR2-expressing rats traveled more than the EYFP-expressing rats during the stimulation session with a pellet at 25 cm (ChR2 = 4, EYFP = 4; Mann–Whitney test, U = 0, *p=0.0286). (G) The ChR2-expressing rats received more photostimulations than the EYFP-expressing rats with a pellet at 25 cm (Mann–Whitney U test, U = 0, *p=0.0286). (H) Types of defensive behaviors elicited by photostimulation with a pellet at 25 cm. Data are presented as mean ± SEM, and individual data are represented as symbols.

Optogenetic stimulation of the BA and dHPC place cell activities

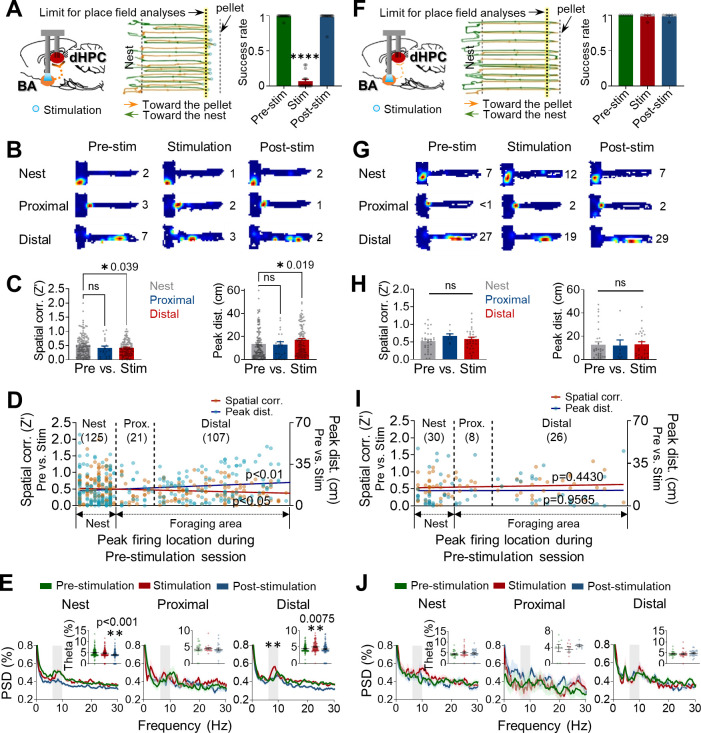
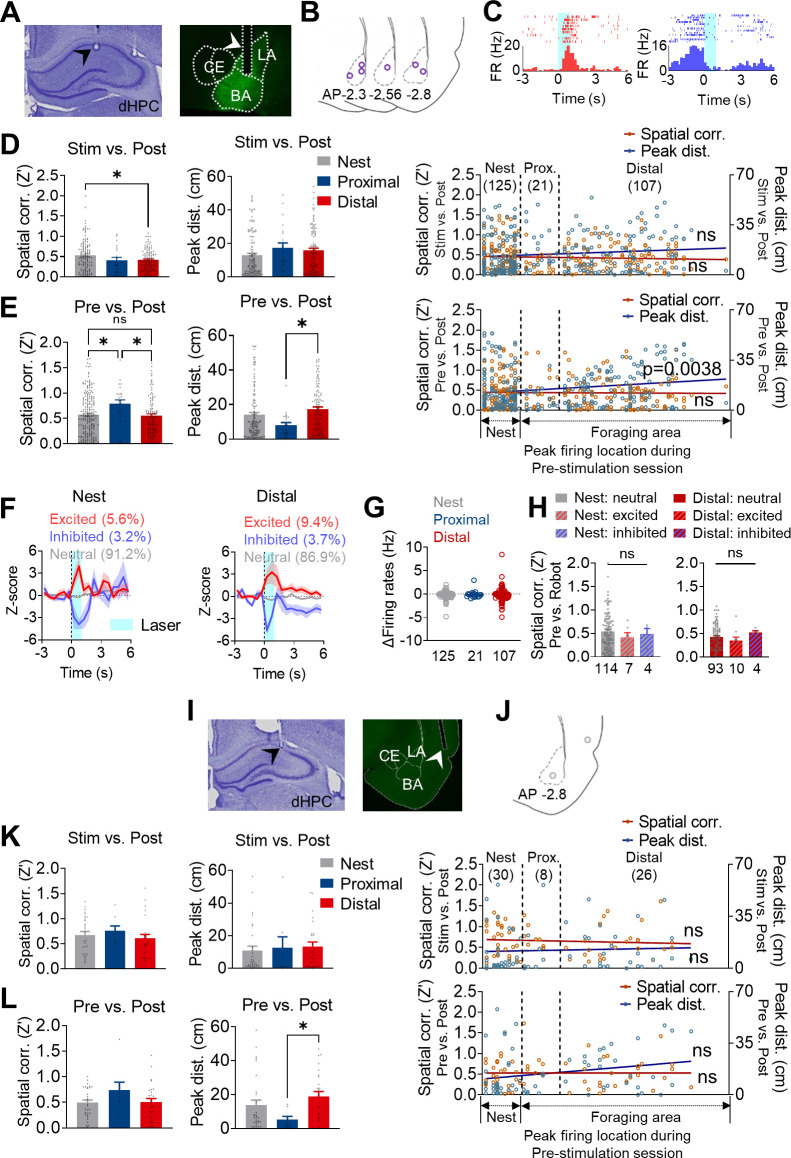
We next examined whether optogenetic stimulation of the amygdala can sufficiently alter the stability of hippocampal place cells. A separate group of rats (n = 8), with ChR2 in BA and tetrodes in dHPC (ipsilateral), underwent three successive sessions of pre-stimulation, stimulation, and post-stimulation (8–10 trials/session), which were analogous to pre-robot, robot, and post-robot sessions. A small number of cases where the stimulation failed to elicit fleeing behavior due to inaccurate optic fiber placement (from one animal; one recording session) or low light intensity (<5 mW, from one animal; five recording sessions) provided an opportunity to evaluate activities of place cells with (Figure 4A–E, Figure 4—figure supplement 1A–H, and Supplementary file 1C) and without (Figure 4F–J, Figure 4—figure supplement 1I–L, and Supplementary file 1D) behavioral effects. Specifically, rats with behavioral effects made multiple attempts to get a pellet during the stimulation session (Figure 4A, middle), yet the success rate was vastly lower compared to pre- and post-stimulation sessions (Figure 4A, right). Those that did not respond to the stimulation promptly procured the pellet during the stimulation session (Figure 4F). The dHPC place cells from the rats with or without behavioral effects were classified into three types (with behavioral effects: nest = 125, proximal = 21, distal = 107; without behavioral effects: nest = 30, proximal = 8, distal = 26; Figure 4B and G) in the manner described previously. Spatial correlations and peak distances between pre-stimulation and stimulation sessions decreased and increased, respectively, in distal cells compared to nest cells when the photostimulation caused rats to escape into the nest (Figure 4C, Figure 4—figure supplement 1D and E). These effects on distal cells were absent in rats without stimulation-induced behavioral effects; that is, both spatial correlations and peak distances of the distal cells were not different from those of the nest and proximal cells (Figure 4H, Figure 4—figure supplement 1K and L). Furthermore, spatial correlations were negatively correlated with the peak firing locations from the nest, while peak distances were positively correlated with the peak firing locations. The inverse relationships between the X positions vs. spatial correlations and the X positions vs. peak distances were found only in rats that showed defensive behaviors in response to the photostimulation (Figure 4D and I). Consistent with our present and previous findings that only distal cells showed increased theta frequency (6–10 Hz) power during the robot session (Kim et al., 2015), optogenetic stimulation of the BA also increased theta power selectively in distal cells of fleeing rats during the 5 s epochs subsequent to photostimulation (Figure 4E). In rats without photostimulation-induced behavioral effects, theta power did not increase in distal cells (Figure 4J).

Figure 4. Optogenetic stimulations of the amygdala alter the stability of place cells.

(A–E) Data were collected from rats exhibiting defensive behaviors responding to the photostimulation. (A) An illustration showing that optogenetic stimulation of the basal amygdala (BA) presumably sends strong (primarily polysynaptic) inputs to the dorsal hippocampus (dHPC) when the stimulations elicited behavioral effects (left). A representative tracking plot during the stimulation session (middle). Orange lines and blue circles indicate the outbound trails and stimulation locations, respectively, that evoked escape responses (green lines). The yellow-tinted dotted line represents the limit of place field analyses. The success rate of pellet retrieval during the photostimulation session significantly decreased (right, n = 17 recording days, ****p<0.0001). (B) Examples of place fields from the nest, proximal, and distal cells during each session (the numerical value represents the peak firing rate). (C) Differences in the pixel-by-pixel spatial correlations (Z’) value (left, *p=0.039) and peak distances between the pre-stimulation and stimulation sessions (right, *p=0.019). (D) Spatial correlations (individual data: orange squares, regression line: dark red, r = −0.1320, *p=0.0359) and peak distances (individual data: blue circles, regression line: dark blue, r = 0.1625, **p=0.0096) of all place cells between pre-stimulation and stimulation sessions are plotted in the order of X position of rats. (E) Power spectral densities (PSD, shown as % of total PSD) of different frequency bands from each cell type during the three sessions. The dark lines and shaded bands represent the mean and SEM, respectively. The gray band represents the theta range (6–10 Hz), and the percentage of theta power during the three sessions is shown in the inserted bar graphs. (F–J) The same analyses as in (A–E), and data were collected from rats not exhibiting defensive behaviors to the photostimulations. (F) When the stimulation of the BA was too weak (left) to elicit defensive behaviors (middle), the success rates across the three sessions were not different (right, n = 6 recording days, p>0.999). (I) Spatial correlations: r = 0.0.09758, p=0.4430; peak distances r = 0.0.006948, p=0.9565. Data are presented as mean ± SEM.

Figure 4.

Figure 4—figure supplement 1. Basal amygdala (BA) photostimulation effects on place cell stability.

Figure 4—figure supplement 1.

(A–H) Data from the rats with behavioral effects in response to the photostimulations. (A) A photomicrograph of a tetrode tip in the dorsal hippocampus (dHPC; left) and viral expressions with an optic fiber track in the BA (right). (B) Histological reconstruction of the optic fiber tips from rats that showed behavioral effects to the photostimulations (purple circles). (C) Rastor plots and peri-event histograms (PETHs) of representative photostimulation-excited dHPC cell (left) and photostimulation-inhibited dHPC cell (right). (D) Differences in the spatial correlations (left, *p=0.0312) and peak distance (middle, p=0.1635) between the stimulation and post-stimulation sessions are plotted as the order of X position of rats (spatial correlations: individual data, orange squares; regression line, dark red; r = 0.1153, p=0.3432; peak distances: individual data, blue circles; regression line, dark blue; r = −0.05983, p=0.0671). (E) The same analyses as in (D) from the data between pre- and post-stimulation sessions spatial correlation, left, nest vs. proximal: *p=0.021, proximal vs. distal: *p=0.026; peak distance, middle, proximal vs. distal: *p=0.0110; plotted as the order of X position of rats, right, spatial correlation, r = −0.001710, p=0.7867, peak distance, r = 0.1815, **p=0.0038. (F) The mean Z-scored firing rates of each response type to the stimulations (excited, inhibited, or neutral) in the nest, proximal, and distal cells. The dark lines and shaded bands represent the mean and SEM. (G) The firing rate changes to the stimulations (Δ firing rates: firing rate1s stimulation ─ firing rate1s before stimulation) of nest, proximal, and distal cells. (H) Spatial correlations between pre-stimulation and stimulation sessions of nest and distal cells that were responsive or non-responsive to the photostimulations. (I–L) Data from the rats without behavioral effects to the photostimulations. (K) Spatial correlations: individual data, orange squares; regression line, dark red, r = −0.08056, p=0.5269; peak distances: individual data, blue circles; regression line, dark blue; r = 0.04943, p=0.6981. (L) Spatial correlations: individual data, orange squares; regression line, dark red, r = −0.0004102, p=0.9974; peak distances: individual data, blue circles; regression line, dark blue; r = 0.2326, p=0.0644.

Because selective remapping of the distal cells could be a result of direct modulations in firing rates by the optical stimulation rather than by the stimulation-elicited emotional state. We further analyzed how dHPC cells responded to the optical stimulations by measuring stimulation-evoked firing rate changes (Z-scores) during the 1 s stimulation period. Although a subset of cells (in all three cell types) were directly modulated by the stimulations (Z > 3 for excited and Z < –3 for inhibited responses; Figure 4—figure supplement 1F), there was no significant difference in either the firing rate changes during the 1 s stimulation across the three cell types (Figure 4—figure supplement 1G) or the spatial correlations between stimulation-neutral and stimulation-responsive cells (Figure 4—figure supplement 1H). These results suggest that although BA stimulation elicited firing changes in some of the dHPC cells, the firing alteration did not directly cause changes in the spatial tuning of place cells. Taken together, these results are consistent with the notion that endogenous activation of BA pyramidal neurons disrupted spatial stability of dHPC place cells and impeded successful foraging, mimicking the exogenous predatory threat-induced distal cell remapping and spatial avoidance behavior.

Discussion

This study recorded, for the first time, simultaneous spike trains from BA and dHPC cells while rats were foraging for food, a purposive behavior (Tolman, 1948), in a risky predatory situation that virtually all animals are likely to encounter in the wild (including prehistoric humans; Mithen, 1999), which differs significantly from the standard Pavlovian fear conditioning paradigms measuring a specific response (typically freezing) in a small chamber. As a result, we revealed a novel amygdalar-hippocampal circuit coding mechanism for interfacing danger and place information. Specifically, dHPC place cell activities that synchronized with looming robot-responsive BA cell activities (i.e., increased spiking) exhibited less stable place field properties than those dHPC place cell activities synchronized with robot-unresponsive BA cell activities. More importantly, the robot-responsive BA-dHPC synchrony effects on place fields manifested in areas proximal to the danger and not inside or near the safe nest, possibly representing brain activity subserving a spatial gradient of fear. Furthermore, there was a concomitant increase in theta rhythm power in the distal areas where the predatory robot was positioned and the place field stability was most altered, a finding consistent with a report of high levels of synchronized theta in the amygdalo-hippocampal network in fear-conditioned animals (Narayanan et al., 2007; Seidenbecher et al., 2003). The possibility that amygdala-coded fear can uncouple theta rhythm and place field stability in the hippocampus is supported by the findings that optogenetic BA stimulation was sufficient to elicit spatial avoidance behavior, increase the theta rhythm power, and disrupt the stability of place fields in the absence of external agent of danger. It follows then the crucial factor that influences the place field stability is the locus of amygdala-coded fear and not the foraging distance itself, and this can be tested in future studies by eliciting fear in proximal, but not distal, foraging distances (e.g., using a two pellet location choice foraging task; Kim et al., 2016). While the majority of amygdala and dHPC projections is polysynaptic, via dorsal CA3 and ventral HPC areas (McDonald and Mott, 2017; Pikkarainen et al., 1999; Rei et al., 2015), there is also evidence of sparse direct amygdala and dHPC projections (Petrovich et al., 2001; Pitkanen et al., 2000; Wang and Barbas, 2018). The relative contributions of polysynaptic vs. monosynaptic amygdala-dHPC projections to the present results, however, require further research employing circuit-specific and genetically defined cell-type-specific manipulations in transgenic mice models (e.g., selective stimulations of retrogradely labeled BA neurons that sparsely project to the dHPC place cells or multi-step stimulations/recordings including the di-synaptic BA-CA3/vHPC-dHPC circuits). Moreover, while the optogenetic stimulation results may be consistent with the notion that endogenous activation of BA pyramidal neurons disrupted spatial stability of dHPC place cells and impeded successful foraging, a major caveat of our single-site stimulation approach is that neither the possibility of non-specific stimulation effects nor involvement of other brain regions can be excluded. The latter possibility, however, is unlikely given that amygdalar lesions effectively blocked predatory robot-induced fear and remapping of dHPC place cells (Kim et al., 2015).

There are three main confounding variables and alternative explanations in the study that need to be considered. First, the spike synchrony in BA and dHPC (i.e., distal place) cells in a risky foraging situation could simply be a by-product of increased firing rates, rather than functional interactions, in BA and dHPC cells to the robot-predator. The firing modulation effect, however, is unlikely based on the shift-predictor correction analysis (i.e., shuffling trials of the reference and target neurons), the unmatched BA and dHPC responses to the predatory event (Figure 1F and H), the similarly increased dHPC firing rates in nest, proximal and distal foraging regions (with remapped place fields limited to distal place cells), and the comparable firing rates between Robot cell-paired distal cells (with remapped place fields) vs. nonRobot cell-paired distal cells (with stable place fields) (Figure 2G and H). Second, the present findings may be due to novelty/saliency features of the robot (rather than robot-evoked fear) signaled by the amygdala. This possibility is also unlikely given that distal place fields were stable with a stationary robot that does not elicit fear (Appendix 1—figure 1A), and that amygdala-lesioned rats unafraid of (i.e., did not flee from) the surging robot exhibited stable distal place fields and normal theta rhythm power and appetitive (hunger motivated) behavior (Kim et al., 2015). The latter study also found that in amygdala-intact rats the distal cell remapping was observed in animals that failed to procure pellets (high-fear state) but not in those that sporadically showed successful foraging (low-fear state) to the looming robot. Furthermore, there is evidence of amygdala-lesioned rats exhibiting normal novel object recognition memory (Aggleton et al., 1989; Mumby and Pinel, 1994) and displaying normal learning and enhanced memory of a visually salient platform water maze task (Kim et al., 2001). Lastly, it is generally held that the firing rate of place cells correlates positively with the running speed of animals pursuing food freely sans danger in the recording environment (Czurko et al., 1999; Lu and Bilkey, 2010; McNaughton et al., 1983). Thus, the place cell remapping observed in this ecologically relevant ‘approach food-avoid predator’ study may reflect velocity differences in proximal vs. distal regions rather than fear magnitude differences. However, a previous study examined the relationship between place cell firing property and the running speed directionality of movement (i.e., proximal-outward speed, distal-outward speed, distal-inward speed, proximal-inward speed) during the robot session and found that the differential stability of place fields cannot be accounted solely by the speed change or acceleration (Kim et al., 2015), and the current study also confirmed that speed changes by the surging robot did not selectively affect stabilities of distal cells the same (Appendix 1—figure 1E). Specifically, there was no significant correlation between the relative speed and spatial correlation in both nest + proximal and distal cells, suggesting that hippocampal remapping during the robot session cannot be fully explained by the running speed per se. Furthermore, the fact that place cell remapping was observed across fear conditioning (Moita et al., 2003; Moita et al., 2004), inhibitory avoidance (Schuette et al., 2020), and ethological fear (Kim et al., 2015) paradigms, where the animals exhibited dissimilar fear behaviors, strongly suggests that fear at least partly contributes to alterations in place fields.

Amir, Pare, and colleagues used a similar ‘approach food-avoid predator’ paradigm (Choi and Kim, 2010) and found that neuronal activities in the basolateral amygdala (BL), a region corresponding to BA, correlated with the animals’ movement velocity whether they were foraging in ‘no-robot’ days or foraging in ‘robot’ days (Amir et al., 2019; Amir et al., 2015). Specifically, most BL neurons were found to be inhibited during foraging and to the predator, and only 4.5% cells showed predator-responsive activities. Thus, they concluded that the amygdala activity aligned largely with ‘behavioral output’ (i.e., foraging) rather than with threats/fear. In the present study, however, the majority of BA neurons showed dissimilar responses during the pre-robot and robot sessions. Predatory threat/fear-responsive neuronal activities were also identified in the LA (Kim et al., 2018). What, then, can account for the apparent discrepancy in the findings when both groups employed an ecologically relevant paradigm? There were obvious differences in the apparatus features (e.g., size), experimental procedures (e.g., pellet locations), and unit data analysis (see Amir et al., 2019 for details), which could have led to different results and conclusions concerning the significance of amygdalar neuronal activities. It is also worth noting that the present study tracked the same amygdalar neurons during pre-robot and robot sessions, allowing direct comparisons of neuronal activities in the presence and absence of predatory threat. Notably, there was a significant difference in the foraging success rate, that is, ~80% (Amir et al., 2015) vs. <3–4% (the present study and Kim et al., 2018). If the pellet procurement rate inversely correlates with the fear magnitude, then the high foraging success rate associated with inhibited amygdalar activity (Amir et al., 2015; Amir et al., 2019) can be inverted by disinhibiting the amygdalar activity, while the low foraging success rate associated with increased amygdalar activity (present study) can be reversed by suppressing the amygdalar activity. The former prediction is consistent with the present findings that optogenetic stimulation of BA neurons per se caused rats to flee to the nest (and also destabilized hippocampal place fields), whereas the latter prediction is consistent with the previous findings that muscimol inactivation of amygdala prevented dorsal periaqueductal gray stimulation-induced fleeing in the same foraging task (Kim et al., 2013).

In nature, all animals are challenged with spatially distributed ecological threats, such as predators and aggressive conspecifics, that they must avoid with proficiency. Although earlier studies (Kim et al., 2015; Moita et al., 2003; Moita et al., 2004) revealed that conditioned (learned) and unconditioned (innate) fear can alter hippocampal neuronal activities, how the brain’s cells coordinate risky and place information to generate spatial representation of fear remained unknown. The present simultaneous recording study, empirically anchored to real dangers that animals face in nature, suggests that the synchronous firing between place-coding hippocampal cells and fear-coding BA cells allows constructive foraging behavior. Specifically, the BA cells that immediately respond to predator attacks destabilize place cell firing at the moment/location of the threat, forming spatial gradient of fear so that animals can traverse safe-danger boundaries of their environment (Figure 5). It follows, then, that asynchronous activities between hippocampal and amygdala cells may lead to lethal foraging decisions in animals and underlie generalized or context-inappropriate fear disorders in humans by obscuring the safe-danger boundary.

Figure 5. A hypothetical coding model of the safe-danger boundary by the amygdala-hippocampus network.
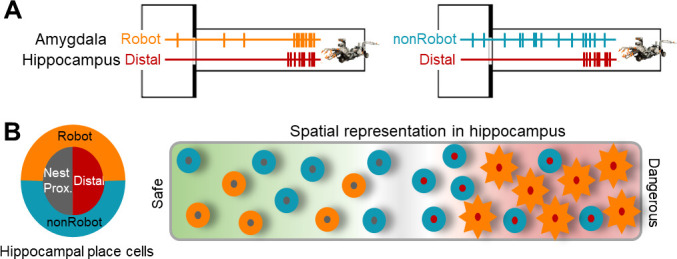
Figure 5.

(A) Illustrations of amygdala and hippocampus cell pairs that showed synchronized firings when the animal is confronted with the robot-predator: Robot-Distal (left) and non-Robot-Distal (right) pairs. (B) An illustration of spatial representation of the safe-danger boundary (the gray area) in the hippocampus as an outcome of interaction with the amygdala. The concentric circles, outer amygdala cells (Robot or nonRobot), and inner hippocampal place cells (nest/proximal or distal) represent safe vs. dangerous environments based on the information from/to the amygdala. Specifically, distal cells synced with Robot cells show a greater extent of remapping (represented as sun-shape), which is presumably due to the eminent fear information received by the amygdala.

Materials and methods

Subjects

Male Long–Evans rats (initial weight 325–350 g) were individually housed in a climate-controlled vivarium (accredited by the Association for Assessment and Accreditation of Laboratory Animal Care), with a reversed 12 hr light/dark cycle (lights on at 7 PM), and placed on a standard food-deprivation schedule with free access to water to gradually reach ~85% normal body weights. All experiments were performed during the dark phase of the cycle in strict compliance with the University of Washington Institutional Animal Care and Use Committee guidelines.

Surgery

An overview of surgical procedures and experimental descriptions is shown in Supplementary file 1E.

Simultaneous recording (1,2Figures 1 and 2 experiment)

Under anesthesia (94 mg/kg ketamine and 6 mg/kg xylazine, intraperitoneally), four rats were mounted in a stereotaxic instrument (Kopf) and implanted with a microdrive of tetrode bundles (formvar-insulated nichrome wires, 14 µm diameter; Kanthal) into the right dHPC and BA. Three tetrodes per region were implanted for the two rats, and four tetrodes per region were implanted for the other two rats. The microdrive was fixed by dental cement with anchoring screws. Behavioral experiments and recording session started after 1 week of recovery.

Optrode experiment (Figure 3A–E experiment)

Four rats were anesthetized, and virus described below (ChR2) was injected into the right BA via a microinjection pump (UMP3-1, World Precision Instruments) with a 33-gauge syringe (Hamilton). The total volume was 0.5 µl per site, and the injection speed was 0.05 µl/min. To avoid backflow of the virus, the injection needle was left in place for 10 min. After injection, optrode that consists of six tetrodes and one optic fiber with ferrule (0.22 NA, 200 µm core; ferrule diameter: 2.5 mm; Doric Lenses) was implanted in the right BA. The optrode was secured by C&B Metabond and dental cement with anchoring screws. Behavioral experiments started after 4–5 weeks of recovery and viral expression.

Optogenetic stimulation of the BA (Figure 3F–K experiment)

Under anesthesia, nine rats were injected with one of the viruses described below (ChR2, n = 5; EYFP, n = 4). After the virus injection, optic fibers attached to ferrules were implanted 0.4 mm dorsal to the injection sites. The optic ferrules were secured by Metabond and dental cement with anchoring screws. Behavioral experiments started after 4–5 weeks of recovery and viral expression.

Optogenetic stimulation of the BA and place cell recording from dHPC (Figure 4 experiment)

Seven rats were anesthetized and mounted in a stereotaxic. The virus described below (ChR2) was delivered into the right BA (n = 5) or bilateral BA (n = 3). Following injection, optic fibers attached to ferrules were implanted into the right BA or bilateral BA (0.4 mm dorsal to the virus injection site). After the virus injection and the optic fiber implantation, a microdrive of tetrode bundles (n = 5) or VersaDrive-8 (n = 3, Neuralynx) was implanted into the dHPC (the same coordinates as used in the simultaneous recording experiment). The optic fibers and electrodes were fixed by Metabond and dental cement with anchoring screws. Behavioral experiments and recording session started after 4–5 weeks of recovery and viral expression.

Viruses

AAVs (serotype 5) to express Channelrhodopsin-EYFP (AAV5-CaMKIIa-hChR2(H134R)-EYFP, n = 5) or EYFP only (AAV5-CaMKIIa-EYFP, n = 4) were injected in the BA. CaMKII promoter was used for targeting pyramidal neurons favorably in the BA (Van den Oever et al., 2013). Viral titers were 8.5 × 10¹² virus molecules/mL for AAV5-CaMKII-hChR2(H134R)-EYFP and 4.3 × 10¹² virus molecules/mL for AAV5-CaMKII-EYFP. Viruses were stored in a –80°C freezer until the day of surgery. All viruses were obtained from the University of North Carolina Vector Core.

Behavioral paradigms

Rats maintained their body weights at ~85% of normal weight throughout the sessions. The experiment was conducted in a specialized foraging apparatus (Kim et al., 2015). The composition of sessions for each experiment is represented in Figures 1A, 3F and 4A.

Habituation

All rats were placed in the nest for 30 min/day for two consecutive days with 20 food pellets (0.5 g, F0171, Bio-Serv) to acclimate to the nest area and the experimental room.

Baseline foraging for Figure 1, Figure 3A-E, and Figure 4

Two minutes after the rat was placed in the nest area, the gateway to the foraging area opened and the rat was allowed to explore and procure a food pellet placed at variable distances (25 cm, 50 cm, 75 cm, 100 cm, and 125 cm from the nest). After the rat took the pellet back into the nest, the gateway closed. When the rat learned to procure a pellet from the longest distance, the pellet distance was fixed, and unit screening started. Rats underwent baseline foraging until unit responses were detected.

Baseline foraging for Figure 3F–K

After 2 min in the nest, the gateway to the foraging area opened, and the rat was allowed to explore and procure a pellet placed at 25 cm from the nest (Figure 3F). After the rat took the pellet back into the nest, the gateway closed (first trial). Consecutive trials commenced in the same way, except the pellet distance from the nest increased to 50 cm for the second trial and 75 cm for the third trial. Rats underwent 4–5 days of baseline foraging for the behavioral experiment.

Behavioral procedure for the simultaneous recording (1,2Figures 1 and 2)

Units from the BA and the dHPC were recorded throughout the three sessions: pre-robot, robot, and post-robot. During the pre-robot session, 8–10 trials of foraging with a pellet placed at 125 cm from the nest were conducted to collect baseline unit activities. After the pre-robot session, rats underwent the robot session with a robot-predator placed at the end of the foraging area (Mindstorms robotic kit, LEGO Systems) (Choi and Kim, 2010). After the gateway opened, each time the rat approached the vicinity of the pellet (~25 cm from the pellet), the robot surged 23 cm toward the pellet, snapped its jaws once, and returned to its original position. Rats were permitted at least 10 attempts to procure the pellet. Since one robot activation was counted as one robot trial, the frequencies of visiting the distal zone between the pre-robot and robot sessions were matched. The robot-evoked responses were examined for 10 s after each attempt. If the rats made additional attempts within 10 s following the previous robot activation, those attempts were excluded from the analysis to prevent overlaps in the robot-evoked responses. Once the rats finished the robot session, another 8–10 trials of foraging without the robot were conducted to collect post-manipulation unit activities (post-robot session).

Behavioral procedure for the optrode recording (Figure 3A–E)

Rats foraged for a pellet placed at 125 cm from the nest while the BA units were recorded. The laser (473 nm; Opto Engine LLC) was connected to Master-8 (A.M.P.I.) to deliver photostimulations (2 s, 20 Hz, 10 ms width, 5–10 mW) and photostimulation-responsive units were detected. Response latency to the photostimulations was calculated for each light pulse (10 ms, 20 Hz, 2 s). An optrode was lowered after each recording session and multiple days of tests were performed. On some of the test days, photostimulations were delivered while rats were under anesthesia. This prevented seizure-like behaviors due to overstimulation of the BA. There was no robot session for the optrode experiment.

Behavioral procedure for the optogenetic stimulation of the BA (Figure 3F–K)

Once rats learned baseline foraging, the stimulation session began. During the stimulation session, rats first underwent three trials of baseline foraging with a pellet at 125 cm from the nest. For the photostimulation trial, the bilateral BA were activated by laser (2 s, 20 Hz, 10 ms width, 5–10 mW) whenever the rat approached the vicinity (~25 cm) of the pellet. If the pellet was not procured within 3 min, the gateway closed, and the rat was tested with a pellet at 25 cm from the nest for another 3 min. If the rat succeeded with a pellet at longer distance, then a shorter distance pellet testing did not follow (ChR2 group only). For the EYFP group, rats were tested with both 75 cm and 25 cm pellets subsequently. One week after the stimulation session, all rats were tested with the robot-predator. Firstly, rats were allowed to procure the pellet with a pellet at 75 cm without the robot and then underwent the first robot-predator encounter trial with the same distance pellet. If the rat was unsuccessful for 3 min, the pellet was moved to 50 cm and 25 cm distances on the following trials.

Behavioral procedure for the optogenetic stimulation of the BA and place cell recording (Figure 4)

Place cell activities from the dHPC were recorded throughout the three sessions; pre-stimulation, stimulation, and post-stimulation. During the pre-stimulation session, 8–10 trials of foraging with a pellet placed at 125 cm from the nest were conducted to record baseline place cell activities. After the pre-stimulation session, the bilateral (n = 5) or unilateral (n = 2) BA were stimulated by the laser (1–2 s, 20 Hz, 10 ms width, 1–10 mW) whenever the rats approached the vicinity of the pellet (~25 cm) during the stimulation session. Rats were allowed to attempt to procure the pellet at least 10 times while the place cell activities were recorded. If the photostimulations were delivered more than twice within 10 s, only the first stimulation was included for the analysis to ensure place cell responsiveness by the photostimulations. Following the stimulation session, rats again were permitted to procure the pellet for 8–10 trials to record post-manipulation effects (post-stimulation session).

Behavioral data acquisition and analyses

The ANY-maze video tracking system (Stoelting Co.), with an HD webcam (C920, Logitech) affixed over the apparatus was used to capture video images and automatically track the rat’s movement (30 frames/s) from both nest and foraging areas. ANY-maze video tracking system was connected to the recording system (Neuralynx) and provided the rat’s tracking information. It also provided locomotor data including distance traveled, speed, and the number of entries to specified zones.

Unit recording and analyses

The impedance of electrode tips was matched to 100–300 kΩ measured at 1 kHz through gold plating. After the postoperative recovery period, electrodes were gradually advanced (≤160 µm per day) until reached the target regions. Unit isolation and cluster cutting procedures have been described before (Kim et al., 2007). Briefly, unit signals were amplified (10,000×), filtered (600 Hz to 6 kHz), and digitized (32 kHz) by using the Cheetah data acquisition system (Neuralynx). Unit isolation was performed by using an automatic spike-sorting program (SpikeSort 3D; Neuralynx) and additional manual cutting as described in previous studies (Kim et al., 2018; Kim et al., 2015). Raster plots and peristimulus time histograms were generated by NeuroExplorer (Nex Technologies). For all units, we ruled out any chance of recording the same cells across multiple sessions by comparing the shape of the waveform, autocorrelogram, and interspike interval histogram between recording days.

Place cell analysis

Criteria used for place cell analysis have been described in the previous study (Kim et al., 2015). To mention briefly, units that showed (1) stable, well-discriminated complex spike waveforms, (2) a refractory period of at least 1 ms, (3) peak firing >2 Hz in any sessions, and (4) spatial information >1.0 bits per/s in any sessions were included. Based on the peak positions of place fields during the pre-robot/pre-stimulation session, cells were classified into three different types: nest cells (cells fired maximally in the nest), proximal cells (cells fired in the proximal region; the foraging area between 0 and 25 cm from the nest), and distal cells (distant from the nest, close to the threat). A pixel-by-pixel spatial correlation analysis by a customized R program calculated the similarity of the place maps across three different sessions; pre vs. robot/stimulation sessions, robot/stimulation vs. post sessions, and pre vs. post sessions for each place cell. The resulting correlation value (r) was converted to a Fisher Z′ score for further parametric comparisons between cell types. The customized R program also calculated the distance of each cell’s peak firing locations between the sessions. It first finds each cell’s maximal firing location (one value that reflects the x-axis of the location; lowest value – the start of the nest, highest value – the end of foraging area) during each session (pre, robot/stimulation, and post sessions). It then calculates the distance (cm) between pre vs. robot/stimulation sessions, robot/stimulation vs. post sessions, and pre vs. post sessions for each place cell.

Classification of BA units

BA units were classified as putative pyramidal cells and interneurons based on the average spike width and the firing rate of each cell (hierarchical unsupervised cluster, Figure 2—figure supplement 1B; Kim et al., 2018). The majority of cells recorded from the BA were putative pyramidal cells (n = 250, 96.9%). Due to a small number of interneurons (n = 8, 3.1%), only pyramidal neurons were included in the further analyses. All units’ activities were aligned by the event of pellet acquirements (pre- and post-robot sessions), robot activations (robot session), or photostimulations (stimulation session) by using NeuroExplorer (version 5.118, Nex Technologies). All data were binned in time windows of 500 ms. A neuron was defined as Robot-responsive (Robot cell) if the neuronal changes (Z-score >3) exclusively occurred within 0–1.5 s before the robot activation (robot-approaching changes) or within 0–3 s after the robot activation (robot-triggered changes). All unit activities were normalized to the baseline period (–5 s to –1.5 s in the PETH). Pellet cells were classified in the same manner except the test window was –1.5 s to 2 s around the pellet acquirement event. Note that, for the Robot cell classification, the possibility of neuronal changes to the robot’s jaw snapping that occurred at 1.5 s after the robot activation was additionally examined for the test window (0–3 s). Cells that showed significant neural changes (Z-score >3) both to the robot and pellet were classified as Robot + Pellet cells. If a cell did not meet the above classifications, it was classified as a non-responsive cell.

Cross-correlation

CCs of the simultaneously recorded BA and dHPC units were generated by NeuroExplorer. The analysis procedure was identical as described in the previous study (Kim et al., 2018) except that the current study includes 2.5 s of each time epoch (Figure 1D). In this analysis, CCs were generated with BA cells as the reference (10 ms bin) with four different time epochs pre-pellet, 2.5 s epoch before pellet procurement during the pre-robot session; post-pellet, 2.5 s epoch after the pellet procurement during the pre-robot session; pre-surge, 2.5 s epoch before the robot looming during the robot session; and (post-surge, 2.5 s epoch after the robot looming during the robot session). The total number of pellet procurements was 309 (average of 9.7 trials per recording day; 32 recording days), and the total number of robot activations was 331 (average of 10.3 trials per recording day). To exclude the chance of false correlations due to covariation or nonstationary firing rates from the BA and dHPC, there was a correction and strict criteria for determining significant cross-correlations (Burgos-Robles et al., 2017). Specifically, the raw CCs were corrected by ‘Shift-Predictor’ where 100 times of trial shuffles were applied. Each shift predictor correlogram was subtracted from its respective raw correlogram, and Z-scores were calculated by the mean and standard deviation of the corrected CC. The neural pair was considered to be significantly correlated if the peak Z-score was >3. Additional criteria were that the BA and dHPC firing rates during the pre- and post-surge periods must be above 0.1 Hz, and the peak of the CC should fall within a testing window of ±100 ms relative to the reference spikes.

Histology

After the completion of the experiment, electrolytic currents (10 µA, 10 s) were applied to each tetrode tips to confirm the placement of the electrodes. Rats were overdosed with Beuthanasia and perfused intracardially with 0.9% saline and 10% formalin. Extracted brains were stored in 10% formalin at 4°C overnight, followed by 30% sucrose solution until they sank. Transverse sections (50 µm) were washed with phosphate-buffered saline (PBS) and mounted onto slides with the gelatin solution. Staining with Cresyl violet and Prussian blue confirmed the tip locations. To verify viral expression, rats were overdosed with Beuthanasia and perfused intracardially with 250–300 mL of PBS followed by 400 mL 4% paraformaldehyde in PBS. Brains were extracted, stored in 4% paraformaldehyde solution at 4°C overnight, then transferred to 30% sucrose solution until they sank. Transverse sections (50 µm) were washed with PBS, mounted on to slides, and coverslipped with Flouromount-G with DAPI (eBioscience). The expression of viruses and the location of electrode tips were examined using a fluorescence microscope (Keyence BZ-X800E). Rats with no EYFP expression or misplacement were excluded from the analysis.

Statistical analyses

Statistical significance was determined with one-way repeated measures ANOVA, two-way ANOVA, linear regression, unpaired t-test, Kruskal–Wallis test, or Friedman test using Bonferroni post hoc or Dunn’s multiple comparisons tests (SPSS or Prism). The detailed information is described in Supplementary file 1F. Kolmogorov–Smirnov normality test also was used to determine the application of parametric or nonparametric tests. Statistical significance was set at p<0.05. Graphs were made using GraphPad Prism (version 8).

Data availability

The data that support the findings of this study are available under the project DOI: https://doi.org/105061/dryad2z34tmpn0. The customized analysis tools are deposited on GitHub: https://github.com/KimLab-UW/Crosscorrelation (copy archived at swh:1:rev:f016d43afc82c855ecf0603ca52a881b9895689e, Kim, 2019a) and https://github.com/KimLab-UW/Behavioral_Analysis, (copy archived at swh:1:rev:d866f2f89f53588840d79f4d730f796378e81dad, Kim, 2019b).

Acknowledgements

This study was supported by the National Institutes of Health grant MH099073 (JJK) and the Ministry of Science and ICT through the National Research Foundation of Korea (NRF) grant: Brain Science Research Program NRF-2015M3C7A1028392 (JC), NRF-2019R1A2C2088377 (JC), NRF-2018M3C7A1024736 (YH), and NRF-2020R1A6A1A03043528 (JC).

Appendix 1

Remapping of distal cells during the predatory encounter

The selective remapping of distal cells during the robot-predator interaction is unlikely due to (i) novelty-related response, (ii) simple sensory stimulus processing, and (iii) motor response-evoked changes. First, the stability of place fields was compared as animals underwent successive pre-robot, stationary robot, looming robot, and post-robot trials (Appendix 1—figure 1A). A spatial correlation analysis showed that the mere presence of a novel stationary robot, which elicited no fear in animals, did not disrupt distal place fields. Second, only seven cells (2%, two nest cells and five distal cells) showed significantly increased activities (Z > 3) exclusively to the looming robot within 150 ms (Moita et al., 2003), and no cells showed a significant increase within 50 ms after the robot activation, which is significantly longer than previously reported sensory-evoked neural responses (<20 ms, Appendix 1—figure 1B and C; Bair et al., 2002; Kim et al., 2015; Quirk et al., 1997; Takakuwa et al., 2018). In addition, the selective remapping of distal cells still occurred during the first two trials of the post-robot session and the mean foraging time was significantly longer during the first two trials of the post-robot session despite the absence of robot-predator sensory cues (Appendix 1—figure 1D and E). As the post-robot trials proceeded, both remapping and foraging time differences gradually disappeared (first three and five trials), and the distal cells became stable comparable to the nest cells. The transient residual effects of the looming robot experience on the stability of place cells and the foraging time during the initial trials of the post-robot session without an explicit threat further indicate that dHPC cell activities and remapping cannot be attributed merely to sensory stimulus processing coupled to the looming robot. Lastly, there were no reliable effects of speed changes on the spatial correlations in the distal cells compared to the nest cells. To determine whether the robot-induced approach/escape behavior or speed changes might have influenced the stability of place cells, we calculated the relative outward between the pre-pellet and pre-surge epochs [(speedpre-surge – speedpre-pellet)/(speedpre-surge + speedpre-pellet)] and the relative inward speed between the post-pellet and post-surge epochs [(speedpost-surge – speedpost-pellet)/(speedpost-surge + speedpost-pellet); Kim et al., 2015]. Then, we analyzed the relationship between the relative speed and the spatial correlations (pre-robot vs. robot sessions, Appendix 1—figure 1F). Neither the relative outward nor inward speed was correlated with the spatial correlation in both nest + proximal and distal cells, suggesting that hippocampal remapping during the robot session cannot be explained in entirety by the running speed.

Appendix 1—figure 1. The dorsal hippocampus and the risky foraging behaviors.

Appendix 1—figure 1.

(A) Spatial correlations between pre-robot vs. stationary robot (x-axis 1), stationary robot vs. looming robot (x-axis 2), and pre-robot vs. looming robot (x-axis 3) sessions in nest (n = 32), proximal (n = 11) and distal (n = 16) place cells from a total of 6 rats. (B) The mean firing rates of the nest, proximal, and distal cells aligned to the robot activation. (C) Z-scored activities of all individual dHPC units during –5 s to 10 s after the robot activation (200 ms bin). (D) Spatial correlations between the pre-robot vs. first two (left), three (middle), and five (right) trials of post-robot sessions. (E) The mean foraging time during the first 2, 3, 5, and 10 trials. (F) The correlations between the relative outward (left, pre-pellet vs. pre-surge epochs) or inward (right, post-pellet vs. post-surge epochs) speed of the animals and spatial correlations (pre-robot vs. robot sessions) of the place cells.

Funding Statement

The funders had no role in study design, data collection and interpretation, or the decision to submit the work for publication.

Contributor Information

Jeiwon Cho, Email: jelectro21@ewha.ac.kr.

Jeansok J Kim, Email: jeansokk@u.washington.edu.

Joshua Johansen, RIKEN Center for Brain Science, Japan.

Laura L Colgin, University of Texas at Austin, United States.

Funding Information

This paper was supported by the following grants:

  • National Institute of Mental Health MH088073 to Jeansok John Kim.

  • National Research Foundation of Korea NRF-2015M3C7A1028392 to Jeiwon Cho.

  • National Research Foundation of Korea NRF-2019R1A2C2088377 to Jeiwon Cho.

  • National Research Foundation of Korea NRF-2018M3C7A1024736 to Yeowool Huh.

  • National Research Foundation of Korea NRF-2020R1A6A1A03043528 to Jeiwon Cho.

Additional information

Competing interests

No competing interests declared.

No competing interests declared.

Author contributions

Conceptualization, Data curation, Formal analysis, Investigation, Project administration, Supervision, Resources, Software, Validation.

Formal analysis, Visualization, Funding acquisition, Supervision, Resources, Software, Validation.

Formal analysis, Visualization, Writing – original draft, Writing – review and editing, Supervision.

Visualization, Writing – original draft, Funding acquisition.

Methodology, Writing – original draft, Validation.

Formal analysis, Methodology, Visualization, Writing – original draft, Funding acquisition, Validation.

Conceptualization, Methodology, Funding acquisition, Supervision, Software, Validation.

Ethics

All experiments in this study were performed in strict compliance with the University of Washington Institutional Animal Care and Use Committee guidelines (protocol #0404-01). Animals were individually housed in a climate-controlled vivarium (accredited by the Association for Assessment and Accreditation of Laboratory Animal Care) with thorough a daily health checkup. Surgeries were performed under ketamine and xylazine mixture anesthesia to minimize physical discomfort, and post-operative assessments for injury, distress, and pain were followed.

Additional files

Supplementary file 1. Supplementary file 1A.

The percentage of the basal amygdala (BA) cell types. A total of 250 pyramidal cells were recorded. The bottom table shows the percentage of the cells showing the same, different, or no responses between the pre-robot and the robot sessions. Supplementary file 1B. Firing properties of dHPC place cells during the pre-robot, robot, and post-robot sessions. Kruskal–Wallis test (average firing rate, peak rate, spatial info, and running speed) and one-way ANOVA (field size); *p<0.05, **p<0.01, and ***p<0.001 compared to the nest cells; #p<0.05 compared to the proximal cells. Supplementary file 1C. Firing properties of place cells during the pre-stimulation, stimulation, and post-stimulation sessions. Data are from the rats with behavioral effects to the photostimulations. Kruskal–Wallis test; **p<0.01 and ***p<0.001 compared to the nest cells; #p<0.05, ##p<0.01, and ###p<0.001 compared to the proximal cells. Supplementary file 1D. Firing properties of place cells during the pre-stimulation, stimulation, and post-stimulation sessions. Data are from the rats without behavioral effects to the photostimulations. Kruskal–Wallis test; *p<0.05 and ***p<0.001 compared to the nest cells; #p<0.05 compared to the proximal cells. Supplementary file 1E. Descriptions and coordinates for each experiment. Supplementary file 1F. Summary of statistical tests performed.

elife-72040-supp1.docx (51.2KB, docx)
Transparent reporting form

Data availability

The data that support the findings of this study are available under the project DOI https://doi.org/10.5061/dryad.2z34tmpn0. The customized analysis tools are deposited on GitHub at https://github.com/KimLab-UW/Behavioral_Analysis (copy archived at swh:1:rev:d866f2f89f53588840d79f4d730f796378e81dad) and https://github.com/KimLab-UW/Crosscorrelation (copy archived at swh:1:rev:f016d43afc82c855ecf0603ca52a881b9895689e).

The following dataset was generated:

Kong M, Kim E, Park S, Zweifel L, Huh Y, Cho J, Kim J. 2021. BA-dHPC simultaneous recording. Dryad Digital Repository.

References

  1. Aggleton JP, Blindt HS, Rawlins JN. Effects of amygdaloid and amygdaloid-hippocampal lesions on object recognition and spatial working memory in rats. Behavioral Neuroscience. 1989;103 doi: 10.1037//0735-7044.103.5.962. [DOI] [PubMed] [Google Scholar]
  2. Amir A, Lee SC, Headley DB, Herzallah MM, Pare D. Amygdala Signaling during Foraging in a Hazardous Environment. The Journal of Neuroscience. 2015;35:12994–13005. doi: 10.1523/JNEUROSCI.0407-15.2015. [DOI] [PMC free article] [PubMed] [Google Scholar]
  3. Amir A, Kyriazi P, Lee SC, Headley DB, Pare D. Basolateral amygdala neurons are activated during threat expectation. Journal of Neurophysiology. 2019;121:1761–1777. doi: 10.1152/jn.00807.2018. [DOI] [PMC free article] [PubMed] [Google Scholar]
  4. Bair W, Cavanaugh JR, Smith MA, Movshon JA. The timing of response onset and offset in macaque visual neurons. The Journal of Neuroscience. 2002;22:3189–3205. doi: 10.1523/JNEUROSCI.22-08-03189.2002. [DOI] [PMC free article] [PubMed] [Google Scholar]
  5. Bolles RC. Species-Specific Defense Reactions and Avoidance Learning. Psychological Review. 1970;77:32–48. doi: 10.1037/h0028589. [DOI] [Google Scholar]
  6. Brown JS, Laundré JW, Gurung M. The Ecology of Fear: Optimal Foraging, Game Theory, and Trophic Interactions. Journal of Mammalogy. 1999;80:385–399. doi: 10.2307/1383287. [DOI] [Google Scholar]
  7. Burgos-Robles A, Kimchi EY, Izadmehr EM, Porzenheim MJ, Ramos-Guasp WA, Nieh EH, Felix-Ortiz AC, Namburi P, Leppla CA, Presbrey KN, Anandalingam KK, Pagan-Rivera PA, Anahtar M, Beyeler A, Tye KM. Amygdala inputs to prefrontal cortex guide behavior amid conflicting cues of reward and punishment. Nature Neuroscience. 2017;20:824–835. doi: 10.1038/nn.4553. [DOI] [PMC free article] [PubMed] [Google Scholar]
  8. Choi JS, Kim JJ. Amygdala regulates risk of predation in rats foraging in a dynamic fear environment. PNAS. 2010;107:21773–21777. doi: 10.1073/pnas.1010079108. [DOI] [PMC free article] [PubMed] [Google Scholar]
  9. Czurko A, Hirase H, Csicsvari J, Buzsaki G. Sustained activation of hippocampal pyramidal cells by ’space clamping’ in a running wheel. The European Journal of Neuroscience. 1999;11:344–352. doi: 10.1046/j.1460-9568.1999.00446.x. [DOI] [PubMed] [Google Scholar]
  10. Fanselow MS, Lester LS. A Functional Behavioristic Approach to Aversively Motivated Behavior: Predatory Imminence as a Determinant of the Topography of Defensive Behavior. Lawrence Erlbaum Associates, Inc; 1988. [Google Scholar]
  11. Fanselow MS, LeDoux JE. Why we think plasticity underlying Pavlovian fear conditioning occurs in the basolateral amygdala. Neuron. 1999;23:229–232. doi: 10.1016/s0896-6273(00)80775-8. [DOI] [PubMed] [Google Scholar]
  12. Kim JJ, Lee HJ, Han JS, Packard MG. Amygdala is critical for stress-induced modulation of hippocampal long-term potentiation and learning. The Journal of Neuroscience. 2001;21 doi: 10.1523/JNEUROSCI.21-14-05222.2001. [DOI] [PMC free article] [PubMed] [Google Scholar]
  13. Kim JJ, Lee HJ, Welday AC, Song E, Cho J, Sharp PE, Jung MW, Blair HT. Stress-induced alterations in hippocampal plasticity, place cells, and spatial memory. PNAS. 2007;104:18297–18302. doi: 10.1073/pnas.0708644104. [DOI] [PMC free article] [PubMed] [Google Scholar]
  14. Kim EJ, Horovitz O, Pellman BA, Tan LM, Li Q, Richter-Levin G, Kim JJ. Dorsal periaqueductal gray-amygdala pathway conveys both innate and learned fear responses in rats. PNAS. 2013;110:14795–14800. doi: 10.1073/pnas.1310845110. [DOI] [PMC free article] [PubMed] [Google Scholar]
  15. Kim EJ, Park M, Kong MS, Park SG, Cho J, Kim JJ. Alterations of hippocampal place cells in foraging rats facing a “predatory” threat. Current Biology. 2015;25:1362–1367. doi: 10.1016/j.cub.2015.03.048. [DOI] [PMC free article] [PubMed] [Google Scholar]
  16. Kim JJ, Choi JS, Lee HJ. In: Living without an Amygdala. Kim JJ, editor. The Guilford Press; 2016. Foraging in the face of fear: Novel strategies for evaluating amygdala functions in rats; pp. 129–148. [Google Scholar]
  17. Kim EJ, Kong MS, Park SG, Mizumori SJY, Cho J, Kim JJ. Dynamic coding of predatory information between the prelimbic cortex and lateral amygdala in foraging rats. Science Advances. 2018;4:eaar7328. doi: 10.1126/sciadv.aar7328. [DOI] [PMC free article] [PubMed] [Google Scholar]
  18. Kim SY. Crosscorrelation. swh:1:rev:f016d43afc82c855ecf0603ca52a881b9895689eSoftware Heritage. 2019a https://archive.softwareheritage.org/swh:1:dir:ce50b43c310df1eacf5989818c50d1ce12a765ef;origin=https://github.com/KimLab-UW/Crosscorrelation;visit=swh:1:snp:e89ca1b53bb94927d9f96ec13d5d16049aab930c;anchor=swh:1:rev:f016d43afc82c855ecf0603ca52a881b9895689e
  19. Kim SY. Behavioral_Analysis. swh:1:rev:d866f2f89f53588840d79f4d730f796378e81dadSoftware Heritage. 2019b https://archive.softwareheritage.org/swh:1:dir:e7f2152aa4c7a79c6b827446de523fd31c375bfd;origin=https://github.com/KimLab-UW/Behavioral_Analysis;visit=swh:1:snp:d652cf18d1b36c516826553b1c907c7cd8dc087f;anchor=swh:1:rev:d866f2f89f53588840d79f4d730f796378e81dad
  20. LeDoux JE. Evolution of human emotion: a view through fear. Progress in Brain Research. 2012;195:431–442. doi: 10.1016/B978-0-444-53860-4.00021-0. [DOI] [PMC free article] [PubMed] [Google Scholar]
  21. Lima SL, Dill LM. Behavioral decisions made under the risk of predation: a review and prospectus. Canadian Journal of Zoology. 1990;68:619–640. doi: 10.1139/z90-092. [DOI] [Google Scholar]
  22. Lu X, Bilkey DK. The velocity-related firing property of hippocampal place cells is dependent on self-movement. Hippocampus. 2010;20:573–583. doi: 10.1002/hipo.20666. [DOI] [PubMed] [Google Scholar]
  23. Maren S, Fanselow MS. Feb). The amygdala and fear conditioning: has the nut been cracked. Review]. Neuron. 1996;16:237–240. doi: 10.1016/s0896-6273(00)80041-0. [DOI] [PubMed] [Google Scholar]
  24. Maren S, Quirk GJ. Neuronal signalling of fear memory. Nature Reviews. Neuroscience. 2004;5:844–852. doi: 10.1038/nrn1535. [DOI] [PubMed] [Google Scholar]
  25. McDonald AJ, Mott DD. Functional neuroanatomy of amygdalohippocampal interconnections and their role in learning and memory. Journal of Neuroscience Research. 2017;95:797–820. doi: 10.1002/jnr.23709. [DOI] [PMC free article] [PubMed] [Google Scholar]
  26. McNaughton BL, Barnes CA, O’Keefe J. The contributions of position, direction, and velocity to single unit activity in the hippocampus of freely-moving rats. Experimental Brain Research. 1983;52:41–49. doi: 10.1007/BF00237147. [DOI] [PubMed] [Google Scholar]
  27. Mithen SJ. Problem-Solving and the Evolution of Human Culture. London: Institute for Cultural Research; 1999. [Google Scholar]
  28. Mobbs D, Petrovic P, Marchant JL, Hassabis D, Weiskopf N, Seymour B, Dolan RJ, Frith CD. When fear is near: threat imminence elicits prefrontal-periaqueductal gray shifts in humans. Science. 2007;317:1079–1083. doi: 10.1126/science.1144298. [DOI] [PMC free article] [PubMed] [Google Scholar]
  29. Moita MA, Rosis S, Zhou Y, LeDoux JE, Blair HT. Feb 6). Hippocampal place cells acquire location-specific responses to the conditioned stimulus during auditory fear conditioning. Neuron. 2003;37:485–497. doi: 10.1016/s0896-6273(03)00033-3. [DOI] [PubMed] [Google Scholar]
  30. Moita MA, Rosis S, Zhou Y, LeDoux JE, Blair HT. Putting fear in its place: remapping of hippocampal place cells during fear conditioning. The Journal of Neuroscience. 2004;24:7015–7023. doi: 10.1523/JNEUROSCI.5492-03.2004. [DOI] [PMC free article] [PubMed] [Google Scholar]
  31. Mumby DG, Pinel JP. Rhinal cortex lesions and object recognition in rats. Behavioral Neuroscience. 1994;108 doi: 10.1037//0735-7044.108.1.11. [DOI] [PubMed] [Google Scholar]
  32. Narayanan RT, Seidenbecher T, Kluge C, Bergado J, Stork O, Pape HC. Dissociated theta phase synchronization in amygdalo- hippocampal circuits during various stages of fear memory. The European Journal of Neuroscience. 2007;25:1823–1831. doi: 10.1111/j.1460-9568.2007.05437.x. [DOI] [PubMed] [Google Scholar]
  33. Narayanan NS, Laubach M. Methods for studying functional interactions among neuronal populations. Methods in Molecular Biology. 2009;489:135–165. doi: 10.1007/978-1-59745-543-5_7. [DOI] [PMC free article] [PubMed] [Google Scholar]
  34. Ohman A, Mineka S. Fears, phobias, and preparedness: toward an evolved module of fear and fear learning [Research Support, Non-U.S. Gov’t Research Support, U.S. Gov’t, Non-P.H.S. Review. Psychological Review. 2001;108:483–522. doi: 10.1037/0033-295x.108.3.483. [DOI] [PubMed] [Google Scholar]
  35. Pellman BA, Kim JJ. What Can Ethobehavioral Studies Tell Us about the Brain’s Fear System. Trends in Neurosciences. 2016;39:420–431. doi: 10.1016/j.tins.2016.04.001. [DOI] [PMC free article] [PubMed] [Google Scholar]
  36. Petrovich GD, Canteras NS, Swanson LW. Combinatorial amygdalar inputs to hippocampal domains and hypothalamic behavior systems. Brain Research. Brain Research Reviews. 2001;38:247–289. doi: 10.1016/s0165-0173(01)00080-7. [DOI] [PubMed] [Google Scholar]
  37. Pikkarainen M, Ronkko S, Savander V, Insausti R, Pitkanen A. Projections from the lateral, basal, and accessory basal nuclei of the amygdala to the hippocampal formation in rat. The Journal of Comparative Neurology. 1999;403:229–260. doi: 10.1002/(SICI)1096-9861(19990111)403:2&#x0003c;229::AID-CNE7&#x0003e;3.0.CO;2-P. [DOI] [PubMed] [Google Scholar]
  38. Pitkanen A, Pikkarainen M, Nurminen N, Ylinen A. Reciprocal connections between the amygdala and the hippocampal formation, perirhinal cortex, and postrhinal cortex in rat. A Review. Ann N Y Acad Sci. 2000;911:369–391. doi: 10.1111/j.1749-6632.2000.tb06738.x. [DOI] [PubMed] [Google Scholar]
  39. Quirk GJ, Armony JL, LeDoux JE. Fear conditioning enhances different temporal components of tone-evoked spike trains in auditory cortex and lateral amygdala. Neuron. 1997;19:613–624. doi: 10.1016/s0896-6273(00)80375-x. [DOI] [PubMed] [Google Scholar]
  40. Rei D, Mason X, Seo J, Graff J, Rudenko A, Wang J, Rueda R, Siegert S, Cho S, Canter RG, Mungenast AE, Deisseroth K, Tsai LH. Basolateral amygdala bidirectionally modulates stress-induced hippocampal learning and memory deficits through a p25/Cdk5-dependent pathway. PNAS. 2015;112:7291–7296. doi: 10.1073/pnas.1415845112. [DOI] [PMC free article] [PubMed] [Google Scholar]
  41. Saunders RC, Rosene DL, Van Hoesen GW. Comparison of the efferents of the amygdala and the hippocampal formation in the rhesus monkey: II. Reciprocal and Non-Reciprocal Connections. J Comp Neurol. 1988;271:185–207. doi: 10.1002/cne.902710203. [DOI] [PubMed] [Google Scholar]
  42. Schuette PJ, Reis F, Maesta-Pereira S, Chakerian M, Torossian A, Blair GJ, Wang W, Blair HT, Fanselow MS, Kao JC, Adhikari A. Long-Term Characterization of Hippocampal Remapping during Contextual Fear Acquisition and Extinction. The Journal of Neuroscience. 2020;40:8329–8342. doi: 10.1523/JNEUROSCI.1022-20.2020. [DOI] [PMC free article] [PubMed] [Google Scholar]
  43. Seidenbecher T, Laxmi TR, Stork O, Pape HC. Amygdalar and hippocampal theta rhythm synchronization during fear memory retrieval. Science. 2003;301:846–850. doi: 10.1126/science.1085818. [DOI] [PubMed] [Google Scholar]
  44. Takakuwa N, Redgrave P, Isa T. Cortical visual processing evokes short-latency reward-predicting cue responses in primate midbrain dopamine neurons. Scientific Reports. 2018;8:14984. doi: 10.1038/s41598-018-33335-9. [DOI] [PMC free article] [PubMed] [Google Scholar]
  45. Tolman EC. Cognitive maps in rats and men. Psychological Review. 1948;55:189–208. doi: 10.1037/h0061626. [DOI] [PubMed] [Google Scholar]
  46. Van den Oever MC, Rotaru DC, Heinsbroek JA, Gouwenberg Y, Deisseroth K, Stuber GD, Mansvelder HD, Smit AB. Ventromedial prefrontal cortex pyramidal cells have a temporal dynamic role in recall and extinction of cocaine-associated memory. The Journal of Neuroscience. 2013;33:18225–18233. doi: 10.1523/JNEUROSCI.2412-13.2013. [DOI] [PMC free article] [PubMed] [Google Scholar]
  47. Wang J, Barbas H. Specificity of Primate Amygdalar Pathways to Hippocampus. The Journal of Neuroscience. 2018;38:10019–10041. doi: 10.1523/JNEUROSCI.1267-18.2018. [DOI] [PMC free article] [PubMed] [Google Scholar]
  48. Wirtshafter HS, Wilson MA. Differences in reward biased spatial representations in the lateral septum and hippocampus. eLife. 2020;9:e55252. doi: 10.7554/eLife.55252. [DOI] [PMC free article] [PubMed] [Google Scholar]

Decision letter

Editor: Joshua Johansen1
Reviewed by: Joshua Johansen2

In the interests of transparency, eLife publishes the most substantive revision requests and the accompanying author responses.

Acceptance summary:

Neurons in the hippocampus which map spatial location (so called 'place cells') are thought to participate in episodic memory encoding and undergo remapping as a result of aversive experiences. The amygdala, an emotional processing center, has been implicated in producing these changes, but the neurophysiological mechanisms through which amygdala neuronal activity produces remapping is not clear. Using dual-site in-vivo electrophysiological recordings, this study found that as animals ventured from a safe location and encountered a simulated predator, activity between amygdala and hippocampal neurons became synchronized and was associated with hippocampal place cell remapping.

Decision letter after peer review:

[Editors’ note: the authors submitted for reconsideration following the decision after peer review. What follows is the decision letter after the first round of review.]

Thank you for submitting your work entitled "'Fearful-place' coding in the amygdala-hippocampal network" for consideration by eLife. Your article has been reviewed by 3 peer reviewers, one of whom is a member of our Board of Reviewing Editors, and the evaluation has been overseen by a Senior Editor. The reviewers have opted to remain anonymous.

We are sorry to say that, after consultation with the reviewers, we have decided that your work will not be considered further for publication by eLife at this time.

While the reviewers found the idea of interactions between specific populations of amygdala and hippocampal neurons related to hippocampal place cell remapping potentially interesting, there was a consensus opinion that the conclusions drawn from these studies were not justified given the current state of the data analysis. There were also concerns about the novelty of some of the results as similar findings have been reported in previous papers from your group. Based on these and other considerations (see detailed reviews below) and the fact that eLife aims to publish papers with a single round of revision that under normal circumstances can be accomplished within two months, we decided that your paper cannot be considered further at this time.

Should further experimental analyses or data allow you to address the issues raised by the reviewers we could consider a resubmission. Please refer to this manuscript number if you choose this route. We cannot make any guarantees about a resubmission at this point, however. We would need to be convinced that the reviewer concerns had been addressed before committing to a re-review. We do not intend any criticism of the quality of the data or the rigor of the science. We wish you good luck with your work and we hope you will consider eLife for future submissions.

Reviewer #1:

Kong and colleagues in Jeansok Kim's lab studied how place cells in the in dorsal hippocampus (dHPC) coordinate with neurons in the basal nucleus of the amygdala (BA) during exposure to a frightening robot-alligator pseudopredator to produce remapping of hippocampal place cell representations. Prior work has demonstrated place cell remapping upon exposure to aversive events. The Kim lab has extended this by showing that exposure to the pseudopredator they use in the present paper also causes dorsal dHPC place cell remapping and increased theta power, that these changes are not apparent when the amygdala is lesioned and that electrical stimulation of the amygdala produces CA1 remapping and avoidance behaviors. In the current paper they replicate their previous results on pseudopredator induced remapping and increased theta power in dHPC cells and stimulation (optogenetic in this case) induced remapping of dHPC cells. In addition, they show that dHPC cells that are closest to the predator and whose firing is coordinated with BA neurons which respond to predator exposure.

While some of this work is a replication of their previous findings and undermines the novelty of the current paper a bit, the possible demonstration of how BA-dHPC cells are coordinated to produce hippocampal place cell remapping during predator experiences is interesting and potentially important. However, there are a number of interpretational issues with the results which make it difficult to determine whether the conclusions are supported by the data. Specifically, it is not clear whether this is in fact destabilization of place cell firing or a switch to predator driven responsiveness in dHPC cells. It is also unclear whether the apparent remapping in dHPC cells is in fact neuronal activity in BA cells or simply a consequence of cells in both regions being co-responsive to the predator stimulus.

1) The authors show that place field stability is lower when the robogator is present/attacking, but I'm not sure this can be called remapping. The fact that there is a different sensory environment with the presence of the robogator and that it is attacking could produce what looks like remapping but is in fact a sensory (or aversive) response to the robogator. These possibilities are supported by the fact that place fields are somewhat stable when comparing pre to post robot (Figure 1-Suppl 1J-M), suggesting that this is not remapping which would likely be expressed in a more long term way (e.g. at the 'post-robot' timepoint). These concerns cannot be ruled out by the fact that amygdala lesions reduce escape from predator behaviors and block place cell changes (Kim et al.et al., 2015), as the authors suggest in the Discussion (pg. 15), because novelty, sensory, aversive or motor information are encoded in and could be conveyed from the amygdala.

2) Because the rats did not spend much/any time venturing into the robot adjacent portion of the chamber, it is possible that there was an impairment in the author's ability to map and compare place fields during the Robot portion of the experiment to pre and post Robot. For example, if the proximal place cell representation in some cells were close to the Robot, but they only ventured to the edge of the place field, that could look like a place field shift.

3) Directly related to point 1, the increase in spike synchrony in BA-HPC cells could be related to an increase in firing rates (possibly induced by the predator event) in BA and HPC cells (co-modulation) and not to the directional influence of one on the other.

4) Also related to the above points, the selective degradation of place cell stability in dHPC cells and the significant cross-correlations with BA neurons in these cells could result from a coordinated increase in firing rates during/after robogator experience in these cell pairs. In this scenario, both remapping and correlated spiking are secondary to coordinated increases in firing rate in what, on the surface, appear to be 'connected' pairs.

5) Point 3 also applies to the optogenetic stimulation effects on dHPC place cell stability shown in Figure 4. The BA stimulation could be increasing firing rates in some of the dHPC cells resulting in a change in the spatial tuning of the cells.

6) Another more minor issue is that a majority of the prior literature has not detected any major input from the BA to the dorsal hippocampus but do see strong inputs to the ventral hippocampus. The Petrovich, 2001 and Pitkanen, 2000 papers the authors cite that examined the BA-hippocampus connectivity systematically also don't see a major projection to dCA1, although the Rei paper does suggest that this connection exists. If the direct connections are minor, this doesn't seriously undermine the overall conclusions of the study, but should be acknowledged because the combined effect of the tracing and cross-correlation results in the current version of the paper imply a monosynaptic BA-dHPC connectivity.

7) The authors show that place field stability is lower when the robogator is present/attacking, but I'm not sure this can be called remapping. The fact that there is a different sensory environment with the presence of the robogator and that it is attacking could produce what looks like remapping but is in fact a sensory (or aversive) response to the robogator. These possibilities are supported by the fact that place fields are somewhat stable when comparing pre to post robot (Figure 1-Suppl 1J-M), suggesting that this is not remapping which would likely be expressed in a more long-term way (e.g. at the 'post-robot' timepoint). These concerns cannot be ruled out by the fact that amygdala lesions reduce escape from predator behaviors and block place cell changes (Kim et al.et al., 2015), as the authors suggest in the Discussion (pg. 15), because novelty, sensory, aversive or motor information are encoded in and could be conveyed from the amygdala.

Suggestions for improvement: To approach the sensory questions they could examine how CA1 cells respond to the robot attack itself, as they did with the BA cells in Figure 1E-F (e.g. include heat plots and population averaged peri-event histograms), though this does not deal with the problem completely. They could also examine whether in early trials animals of 'post robot' animals still exhibit avoidance behavior in the absence of the robot and whether there is still remapping compared to 'pre-robot'. In addition, they could change the framing of the paper and discuss how this could be a sensory related response and not necessarily a remapping event.

8) Because the rats did not spend much/any time venturing into the robot adjacent portion of the chamber, it is possible that there was an impairment in the author's ability to map and compare place fields during the Robot portion of the experiment to pre and post Robot. For example, if the proximal place cell representation in some cells were close to the Robot, but they only ventured to the edge of the place field, that could look like a place field shift.

9) Directly related to point 1, the increase in spike synchrony in BA-HPC cells could be related to an increase in firing rates (possibly induced by the predator event) in BA and HPC cells (co-modulation) and not to the directional influence of one on the other.

Suggestions for improvement: The authors could address this by examining whether there was a tendency in the cell pairs across the population to show an increase in firing rate during pre/post surge periods and examine whether the average lag time between BA and dHPC spikes were around 0, shifted to negative or positive or was bimodally distributed across the cells (possibly using a frequency histogram showing cell counts using the lag times for each cell). They could also examine whether increases in firing rate covaried or were independent from the cross-correlation strength on individual trials or whether significant cell pairs in one condition lost their correlation in another condition where they still showed enhanced firing rates.

10) Also related to the above points, the selective degradation of place cell stability in dHPC cells and the significant cross-correlations with BA neurons in these cells could result from a coordinated increase in firing rates during/after robogator experience in these cell pairs. In this scenario, both remapping and correlated spiking are secondary to coordinated increases in firing rate in what, on the surface, appear to be 'connected' pairs.

11) Point 3 also applies to the optogenetic stimulation effects on dHPC place cell stability shown in Figure 4. The BA stimulation could be increasing firing rates in some of the dHPC cells resulting in a change in the spatial tuning of the cells.

12) Another more minor issue is that a majority of the prior literature has not detected any major input from the BA to the dorsal hippocampus but do see strong inputs to the ventral hippocampus. The Petrovich, 2001 and Pitkanen, 2000 papers the authors cite that examined the BA-hippocampus connectivity systematically also don't see a major projection to dCA1, although the Rei paper does suggest that this connection exists. If the direct connections are minor, this doesn't seriously undermine the overall conclusions of the study, but should be acknowledged because the combined effect of the tracing and cross-correlation results in the current version of the paper imply a monosynaptic BA-dHPC connectivity.

Suggestions for improvement: The authors should more carefully describe their anatomical findings including from Figure 2-Suppl Figure 2A and show a) broader images in which hippocampal subareas can be seen, b) quantification of the cell number c) think about performing an anterograde tracing experiment looking at terminal innervation of CA1 from BA tracer injections. They could also look at the latency of the cross-correlation values in individual cells as well as the latency of the optogenetic stimulation induced increases in firing rate to address this issue. If direct projections are minor, the authors should consider the possibility that the cross-correlations occur through indirect connectivity (which they do to some extent in the Discussion). If so, this doesn't seriously undermine the overall conclusions of the study, but should be acknowledged because the combined effect of the tracing and cross-correlation results in the current version imply a monosynaptic BA-dHPC connectivity.

Reviewer #2:

In this paper the authors aim at identifying and testing reciprocal influence of the space and threat representations mediated by the dHPC and BA. To do so, they have recorded neuronal activity simultaneously in the dorsal hippocampus (dHPC) and basal amygdala, in a naturalistic foraging task with a looming robot simulating a threatening predator. In this task the animal venture from the nest into a foraging zone to retrieve a food pellet. In one of the sessions, the robot is activated as soon as the animal approaches the pellet, triggering a flight-type reaction (returning to the nest). The authors identify different subsets of BA neurons : threat-responsive and pellet-responsive, and then focus their analysis on threat responsive BA neurons (robot-cells) and study their correlation with the dorsal hippocampus neurons. They then use optogenetics to stimulate BA during foraging, mimicking the BA activation by the robot, and assess the effects of this stimulation on behavior and dHPC place cell stability.

The difficulty for assessing place cell activity in threatening situations is that the reaction triggered, in this case hesitation and pausing, constitute strong modification of the exploratory behavior usually requested to analyze place cell activity. It is then hard to pinpoint what is due to actual place-cell property modification and what is due to differences in behavior. The authors have addressed this question in previous studies (not reviewed here). In this paper they reproduce the same results as presented before and add an incremental step by using optogenetics to activate BA and trigger place field instability (they previously established that BA inactivation or lesion prevents place field disruption). A strength of the paper is that optogenetic stimulations of the BA, although triggering the same flight response as the robot, does not seem to trigger the same pausing and hesitations in the approach phase, therefore making this part less prone to spurious results in remapping due to behavioral changes.

The major interest and novelty in this study, in my opinion, is the use of this valuable dataset (dHPC and BA simultaneous recordings in a naturalistic foraging task) to look at the fine temporal dynamics between BA and dHPC. Unfortunately, this is also very difficult due to the very small number of correlated cell pairs. Indeed, despite the authors's tracing data and previous literature on it, the presence of direct connections between dHPC and BA is not fully established and, at best, very sparse. This sparsity, or the possibility of correlations through other structures, doesn't make this study less interesting, only more difficult. Indeed, although promising, the author's claims that the BA and HPC reciprocally interact on a short time window around the robot "surge" or closer to the threat is only partially backed by their results that require, at this stage, more careful statistical controls.

– It seems that figures G and H are essentially recapitulating previous work done by the authors (Kim et al.et al. 2015). In particular, how is Figure 1H in the present paper different from figure 2c in the 2015 one?

– Remapping measures : the peak distance measure isn't clear and is not described in the methods. In the text it is mentioned pauses in the foraging behavior in the robot session. However average running speeds are higher, which I suppose is due to faster running/escaping to the nest. This means there are major speed/behavior differences in the robot and non-robot epochs that could be described/accounted for. In the same line of thought, I suggest an additional criteria for place cells of minimal velocity. This would be ensuring that the remapping is not due to behavioral differences between pre-robot and robot sessions.

– Since the BA is supposed to encode both positive and negative valences, the "pellet-cells" should be included in the analysis, represented as in figure 1D and shown in figure 1F.

– If I understood the methods correctly, the data are normalized separately for the pre-robot and robot-sessions. Is it correct then to substract the z-values (figure 1f) coming from two different normalizations? (+ the number of cells in the text and figure do not match).

– I would include a pie chart to clearly state robot, pellet, pellet-robot and neutral cells percentages and numbers in the principal figure.

– CTB tracking measures : there is only one example, and the number of animals is not mentioned. There is no quantification. The cell bodies in CA1are blurry and since we don't see the rest of the picture this could well be baseline fluorescence. From the picture if we trust it it also seems that CA1 to BA projecting cells are much more numerous than BA to CA1 projecting cells. This supplementary figure is not convincing to me. I think it should be properly performed or removed. The paper does not need to establish direct connections between the dHPC and the BA to be relevant, provided the results are commented appropriately. Properly establishing this with tracing methods coupled with physiology (ie monosynaptic connections on cross-correlograms) is a whole other endeavor.

– The analyses presented in figure 2 are the one that require more careful control. First, I do not understand why the authors separated pre-surge and post-surge epochs. Then, the 100ms window, although justified by the authors from connectivity data, seem at least partially arbitrary (especially since they also show a long decay -10s- in figure 1F). Finally, restricting the analysis to such little data (the number of surge events/total recording time on which the ccgs are calculated should be stated) induces baselines close to zero and makes it vulnerable to spurious correlations. Then, figures 2C and F illustrate a circular reasoning because the authors are showing significant differences on the averages of cells that were selected based on this difference (during the window).

My suggestions are to : – put a limit of a minimal number of spikes in the considered windows (rather than an overall minimal firing rate) – perform the same analysis on randomly chosen 100 windows to evaluate the number of cell pairs that would be identified by chance (or potentially come up with other shuffling strategies). – Vary the length of the chosen window and see if the results are consistent.

Reviewer #3:

The authors investigate the impact of amygdala activity on coding of place in the hippocampus. They use a paradigm pioneered and established by this group in the past several years, which nicely combines foraging for food with predatory risk/fear. Rats were required to go out of their nest to look for food pellets while in an environment that includes a "scary" robot, designed to mimic predatory risk. This group has previously shown by lesions, inactivation, and disinhibition, that the amygdala regulates risk behavior (fear of the predator-robot) while foraging for food. Additionally, in a follow-up study, they recorded hippocampal place-cells and showed that spatial information is altered ("remapping") by foraging in the robot risky environment and that amygdala lesions prevent this remapping. In the prevent study they seek to establish this framework even further, and they therefore use two strategies: 1. Simultaneous recordings from the amygdala and the hippocampus that allow cross-correlations between single-units in both structures; and 2. Optogenetic excitation of amygdala cells while examining place coding and remapping in the hippocampus. Both approaches provide further evidence to the previous published findings and are overall well performed and reported with clarity. The conclusions are reasonably supported by the data, but the novelty is less clear, and the novel data does not provide clear insights.

The strengths of the paper are the simultaneous recordings of spikes in the amygdala and the hippocampus, which allow more direct evaluation of the effect of amygdala activity on remapping of hippocampal place-cells. The main finding is that remapping in the hippocampus occurred mainly at hippocampal cells that showed synchronous activity with robot-responsive amygdala cells. The other strength could be the optogenetic activation of amygdala cells and the effect on behavior and hippocampal remapping, providing a more concrete evidence that it is indeed increased activity in the amygdala that regulates behavior and place coding under threat.

The main weakness is that the results do not provide substantial additional insights beyond the already published studies.

The cross-correlations are a useful approach, but it is not clear how many of the overall CCs (1999) are independent, namely result from different pairs (vs how many include the same individual neuron). Adding to this the finding that the number of significant CCs is not really high and fluctuates around chance levels (5% or so), makes the finding hard to interpret. Additionally, "non-robot" BA cells are defined as cells that did not respond to any event (robot or pellet), and these are therefore cells which potentially do not have any interest in the paradigm and of lower activity overall. As a result, they do not provide a proper control for CCs that might be related to "remapping" of hippocampal place cells. Finally, the correlation between position along the arena and the "remapping" are very nice but might well be a result of two groups (nest/proximal, and distal), rather than a real gradual correlation. This needs to be analyzed more carefully.

The optogenetics is a strength in principle but limited as well. First, if the authors would like to claim that it is indeed BA->HPC, then the power of optogenetics should be used by injecting in one place and stimulating in the other. Second, a control region should be used in addition to the amygdala, to make sure that the stimulation itself (cell excitation) is not in itself a fearful experience for the animal.

Finally, the "remapping" is the finding that spatial sensitivity has changed, but there is no constructive value in it. In other words, if a place has a predator associated with it, then cells should either represent this location better (to remember and to avoid it), or they should remap to code for something else (e.g. a place that has other pellets and no risk). While one cannot ask the data to show something if it does not, it currently does not provide much beyond the previous studies, and further analyses are required to help understand how remapping is modulated by the amygdala to enable future behavior (e.g. in the post-robot period).

In addition to what was mentioned in the previous section:

1. Some controls are required to make sure that place-coding was not disrupted (remapping) by differences in visiting the distal regions due to the robot risk (different trajectories, less sampling as evident by low success rate etc.).

2. The division between proximal to distal should be uniform, either in distance and/or in number of place-cells, both are required for correct interpretation.

3. Remapping (and also BA activity could result from distance from the nest (less safety), and this has been shown in many studies. Currently there is no way to dissociate the effect of the robot from the effect of the distance from the nest (they complement each other). Because all sessions are the same: pre-robot, robot, and post-robot, and there are not specific differences between cells in robot and post-robot, it is hard to dissociate the two factors. A future study can include sessions when a robot surges in a proximal location.

4. Another way to think about the previous concern, is to notice that by definition, a robot cell is a distal cell in the amygdala, and therefore CCs are expected (as nicely exemplified in the scheme in figure 5). a better design can dissociate the two factors.

5. The findings of CCs, central to the study, are not reported in a clear manner and one has to follow the numbers and the segmentation very carefully.

6. It is not clear when exactly photostimulation was delivered during the session.

7. More "constructive" characterization of the remapping would really improve the study and its novelty. Do cells remap to code for a different place? How is it in relation to the pellet locations? Why should place-coding be disrupted if the animal wants to remember the location of a threat ?

[Editors’ note: further revisions were suggested prior to acceptance, as described below.]

Thank you for resubmitting your work entitled "'Fearful-place' coding in the amygdala-hippocampal network" for further consideration by eLife. Your revised article has been evaluated by Laura Colgin (Senior Editor) and a Reviewing Editor.

The manuscript has been improved but there are some remaining issues that need to be addressed, as outlined below. Specifically, further analyses requested by Reviewers 1 and 2 are required to shore up the findings. Furthermore, the addition of some type of off-site control stimulation group for the optogenetic study would strengthen the paper but including a further discussion of the caveats/potential limitations of the single-site stimulation approach may be sufficient.

Essential revisions:

Reviewer #1:

The authors have addressed most of my previous concerns and focused the paper around the more novel aspects of the findings related to the role of spiking synchronization between basal amygdala (BA) and dorsal hippocampus (dHPC) neurons during aversive experiences and the role of this process in producing experience dependent remapping of dHPC cells. This remapping is maintained transiently after the predator is removed but while animals are still exhibiting avoidance behaviors and not correlated with changes in firing rate, concerns from past reviews. Notably, BA optogenetic stimulation alone is sufficient to reduce foraging behavior and induce dHPC cell remapping. This provides a physiological mechanism for the authors' previous finding that BA lesions block predator induced dHPC cell remapping.

While these results are interesting, there is one remaining issue which should be addressed: Related to Figure 1 showing BA-dHPC synchrony, the authors report the percentage of cells showing synchrony around the pre/post predator encounter and they show that this did not occur in these aversive cell pairs during a non-aversive experiences (i.e. pre/post pellet procurement). However, they did not report any data on the pre/post pellet encounter, explicitly examining the percentage of cells showing significant cross-correlations (CCs) during these periods. This should be included along with an analysis of the overlap between cells with significant CCs during aversive or rewarding experiences if there is a large population of cells showing this for the pellet encounters. This will give the reader a better understanding of the nature of this synchronization, whether it is related specifically to aversive encounters and, if so, whether it occurs in separate populations of cells during these different types of experiences.

Reviewer #2:

The authors did a fine job addressing most of the concerns, and performed additional analyses producing new figures and results.

Yet, I still feel that the main concern: "The main weakness is that the results do not provide substantial additional insights beyond the already published studies.", did not receive a direct and appropriate response in the letter. The CC and the optogenetics are an obvious novelty on one hand, yet on the other, the finding that BA activity in fearful environments is a pre-cursor for remapping of a [any] behavioral correlate that is relevant for the task, is not really novel. If the details and the mechanisms were more convincing, revealing something new about BA-HPC interactions, or about the remapping itself, then it could have been a more interesting study. Overall, I do not have a strong objection to the work, but I admit I am not convinced that it will make a major impact beyond previous work.

In addition, some concerns were not fully addressed. For example:

The optogenetics is a strength in principle, but limited as well. First, if the authors would like to claim that it is indeed BA->HPC, then the power of optogenetics should be used by injecting in one place and stimulating in the other. Second, a control region should be used in addition to the amygdala, to make sure that the stimulation itself (cell excitation) is not in itself a fearful experience for the animal.

Their answer: We agree with the first comment if BA neurons supposedly influence dHPC neuronal activities via their monosynaptic projections. However, as originally stated in the manuscript, the majority of amygdala and dHPC projections is polysynaptic (via dorsal CA3 and ventral HPC areas). Given the sparsity of direct BA-dHPC connection and other reviewers' recommendations (i.e., Reviewer 1's comment #6 and Reviewer 2's comment #6), the CTB tracing data are now removed.

This is an argumentative response. If we generalize this type of response, then why do we need any kind of study that injects in one place and stimulate in the other? There are polysynaptic connections between almost any two region in the brain, hence stimulating one does not demonstrate conclusively that changes that occur in the other are caused by it. Perhaps the BA responses are what they are: BA responses to a fearful environment (as we know fo many years), and HPC remapping occurs due to other inputs from other region independent of the BA? I admit the CCs and the general common sense (hypothesis) in the field makes this less likely, but that is exactly my point about the novelty. Either you show the BA-HPC in a more convincing way, or it remains a correlational nice study with limited novelty.

Their answer: As for the second comment, we do not have a different brain region stimulation 'control' group, which can potentially raise further questions because stimulating a different region can affect/alter other (e.g., nondefensive) behaviors and neural circuits. However, we do have three control conditions, (i) EYFP control (the traditional channelrhodopsin control), (ii) low laser power control, and (iii) optic fiber misplacement control. In all three control conditions, we did not detect defensive behaviors at the timing of light delivery, and in the case of ii and iii control groups, their place cells showed no remapping. These findings suggest that the BA stimulation per se (in the absence of eliciting defensive responses) is not sufficient to cause place cell remapping.

I do not understand why they did not perform few additional experiments with this control?

Their claim that "stimulating a different region can affect/alter other (e.g., nondefensive) behaviors and neural circuits" is directly what they would want to test – that it is indeed BA inputs per-se, and not other changes. Moreover, their response "BA stimulation per se (in the absence of eliciting defensive responses)" indeed raises the possibility that BA stimulation induced a fearful state not because it was in the BA, but because the animal felt something unknown (i and ii do not address this) inducing a fearful state, and hence remapping (and again we are left without knowing if it is via the BA).

To emphasize again: I have no doubt that their hypothesis is likely correct, but the study as-is does not tell us much more than we already knew.

1. Some controls are required to make sure that place-coding was not disrupted (remapping) by differences in visiting the distal regions due to the robot risk (different trajectories, less sampling as evident by low success rate etc.).

Their answer: The original manuscript explicitly addressed this concern (pg. 5): "Because the looming robot prevented the animals from reaching the pellet location, all neural analyses was based on equating the nest-to-foraging distance in each trial of pre-robot, robot and post-robot sessions (Figure 1A)." However, to better clarify this, we added a note…

This does not answer the main concern. It does address the analyses, but it does not address the potential confound those different trajectories and frequency of visiting distal regions contributed to the remapping. Namely that behaviors that are "outside" of the time/place taken for analyses, took part in remapping. Perhaps I am missing something in their controls?

2. The division between proximal to distal should be uniform, either in distance and/or in number of place-cells, both are required for correct interpretation.

In the previous place cell recording study (Kim et al.et al., 2015), we defined the proximal region as the foraging area between 0-25 cm from the nest since rats failed to procure the pellet beyond this proximal-distal boundary when facing a looming robot (Choi and Kim, 2010). We have also reported that when the distal zone was subdivided into two areas (one relatively nearer to the nest and other farther from the nest), there was no reliable difference in spatial correlation and the peak distance between the two distal areas.

This is great. Why not repeat the same analyses here and show it is similar? One cannot rely on a previous study for such controls.

eLife. 2021 Sep 17;10:e72040. doi: 10.7554/eLife.72040.sa2

Author response


[Editors’ note: the authors resubmitted a revised version of the paper for consideration. What follows is the authors’ response to the first round of review.]

Reviewer #1:

Kong and colleagues in Jeansok Kim's lab studied how place cells in the in dorsal hippocampus (dHPC) coordinate with neurons in the basal nucleus of the amygdala (BA) during exposure to a frightening robot-alligator pseudopredator to produce remapping of hippocampal place cell representations. Prior work has demonstrated place cell remapping upon exposure to aversive events. The Kim lab has extended this by showing that exposure to the pseudopredator they use in the present paper also causes dorsal dHPC place cell remapping and increased theta power, that these changes are not apparent when the amygdala is lesioned and that electrical stimulation of the amygdala produces CA1 remapping and avoidance behaviors. In the current paper they replicate their previous results on pseudopredator induced remapping and increased theta power in dHPC cells and stimulation (optogenetic in this case) induced remapping of dHPC cells. In addition, they show that dHPC cells that are closest to the predator and whose firing is coordinated with BA neurons which respond to predator exposure.

While some of this work is a replication of their previous findings and undermines the novelty of the current paper a bit, the possible demonstration of how BA-dHPC cells are coordinated to produce hippocampal place cell remapping during predator experiences is interesting and potentially important. However, there are a number of interpretational issues with the results which make it difficult to determine whether the conclusions are supported by the data. Specifically, it is not clear whether this is in fact destabilization of place cell firing or a switch to predator driven responsiveness in dHPC cells. It is also unclear whether the apparent remapping in dHPC cells is in fact neuronal activity in BA cells or simply a consequence of cells in both regions being co-responsive to the predator stimulus.

1) The authors show that place field stability is lower when the robogator is present/attacking, but I'm not sure this can be called remapping. The fact that there is a different sensory environment with the presence of the robogator and that it is attacking could produce what looks like remapping but is in fact a sensory (or aversive) response to the robogator. These possibilities are supported by the fact that place fields are somewhat stable when comparing pre to post robot (Figure 1-Suppl 1J-M), suggesting that this is not remapping which would likely be expressed in a more long term way (e.g. at the 'post-robot' timepoint). These concerns cannot be ruled out by the fact that amygdala lesions reduce escape from predator behaviors and block place cell changes (Kim et al.et al., 2015), as the authors suggest in the Discussion (pg. 15), because novelty, sensory, aversive or motor information are encoded in and could be conveyed from the amygdala.

Suggestions for improvement: To approach the sensory questions they could examine how CA1 cells respond to the robot attack itself, as they did with the BA cells in Figure 1E-F (e.g. include heat plots and population averaged peri-event histograms), though this does not deal with the problem completely. They could also examine whether in early trials animals of 'post robot' animals still exhibit avoidance behavior in the absence of the robot and whether there is still remapping compared to 'pre-robot'. In addition, they could change the framing of the paper and discuss how this could be a sensory related response and not necessarily a remapping event.

As recommended by the reviewer, we aligned dHPC activities to the robot activation to address whether the decreased stability of distal place fields reflects direct sensory responses to the Robogator as opposed to Robogator-induced fear. Appendix—figure 1B and C, shows the nest, proximal and distal cells’ mean firing rate changes to the looming robot. All three cell types increased their activities after the robot activation, but their peak-firing appeared > 1 second after the robot activation, which is significantly longer than previously reported < 20 ms sensory-evoked neural responses (cf. Bair et al.et al., 2002; Quirk et al.et al., 1997; Takakuwa et al.et al., 2018). Of all individual cell responses are plotted in Appendix—figure 1C, only 7 cells (2.7%, 2 nest cells, 5 distal cells) showed significantly increased activities (Z > 3) exclusively to the looming robot within 150 ms (cf. Moita et al.et al., 2003), and no cells showed significant increase within 50 ms after the robot activation. Given the delayed responses, the dHPC cell activities and remapping are likely driven by affective (i.e., fear) states, rather than sensory stimulus (i.e., robot) processing coupled to the surging robot per se.

Another valuable recommendation by the reviewer was to examine whether remapping occurred during the early trials of the post-robot session. We thus calculated spatial correlations between the pre-robot session and the early trials of post-robot session (i.e., first two, three and five trials). As can be seen in Appendix—figure 1D, the spatial correlations of distal cells between prerobot and first two trials of the post-robot sessions were significantly lower compared to those of nest and proximal cells. As the trials proceeded, the significant difference disappeared (first three and five trials) and the distal cells became stable when compared to the nest cells (Appendix—figure 1D). Consistent with this, the mean foraging time to successfully procure the pellet during the first two trials was significantly longer compared to the latter trials (Appendix—figure 1E). These results indicate that there were transient residual effects of the robot experience on the stability of place cells and the foraging time during the initial trials of the post-robot session when an external threat stimulus was absent. However, the selective remapping of the distal cells and increased foraging time quickly reverted to the baseline levels during the remaining trials of the post-robot session.

Overall, we believe the use of the term ‘remapping’ to describe our findings of distal (but not nest-proximal) place fields in a familiar environment shifting to unpredictable locations with Robogator-induced fear in the same environment have been strengthened by presenting that (i) dHPC place cell activity to the robot activation occurred outside the range of direct sensory responsiveness, and (ii) distal cells continued to display residual remapping without the looming Robogator during the initial trials of the post-robot session. The reviewer noted that novelty and sensory effects on the distal cell remapping cannot be entirely ruled out by our previous findings of amygdala lesions reducing both escape behavior and place cell alterations (Kim et al.et al., 2015). The same study, however, also showed distal cell remapping only in animals that failed to procure pellets (high-fear state) but not in those that sporadically showed successful foraging (low-fear state) during the robot session. Moreover, there is evidence of amygdala-lesioned rats exhibiting normal novel object recognition memory (Aggleton et al.et al., 1989; Mumby and Pinel, 1994) and displaying normal learning and enhanced memory of a visually salient platform water maze task (Kim et al.et al., 2001). Taken together, the present findings are consistent with the notion that fear elicited by the looming Robogator (and not Robogator’s sensory features) is the likely factor of distal cell remapping.

2) Because the rats did not spend much/any time venturing into the robot adjacent portion of the chamber, it is possible that there was an impairment in the author's ability to map and compare place fields during the Robot portion of the experiment to pre and post Robot. For example, if the proximal place cell representation in some cells were close to the Robot, but they only ventured to the edge of the place field, that could look like a place field shift.

The original manuscript explicitly addressed this concern: “Because the looming robot prevented the animals from reaching the pellet location, all neural analyses were based on equating the nest-to-foraging distance in each trial of pre-robot, robot and post-robot sessions (Figure 1A).” The revised manuscript better clarified this by appending a note on Figure 1A and by editing the above statement to “Because the looming robot prevented the animals from reaching the pellet location, the distal cells that had place fields beyond the foraging limit (where the animal did not visit during the robot session) were excluded for any place cell analyses to equate the nest-to-foraging distance throughout the sessions.”

3) Directly related to point 1, the increase in spike synchrony in BA-HPC cells could be related to an increase in firing rates (possibly induced by the predator event) in BA and HPC cells (co-modulation) and not to the directional influence of one on the other.

Suggestions for improvement: The authors could address this by examining whether there was a tendency in the cell pairs across the population to show an increase in firing rate during pre/post surge periods and examine whether the average lag time between BA and dHPC spikes were around 0, shifted to negative or positive or was bimodally distributed across the cells (possibly using a frequency histogram showing cell counts using the lag times for each cell). They could also examine whether increases in firing rate covaried or were independent from the cross-correlation strength on individual trials or whether significant cell pairs in one condition lost their correlation in another condition where they still showed enhanced firing rates.

First, all cross-correlations data presented in the original manuscript were corrected by ‘Shift-Predictor,’ ’ where 100 times of trial shuffles were applied. Each shift predictor correlogram was subtracted from its respective raw correlogram, and Z-scores were calculated by the mean and standard deviation of the corrected CC. The neural pair was considered to be significantly correlated if the peak Z-score was > 3. Additional criteria were that the BA and dHPC firing rates during the pre- and post-surge periods must be above 0.1 Hz, and the peak of the CC should fall within a testing window of ±100 ms relative to the reference spikes. This detailed information has been updated in the Materials and methods section (Cross-correlation). We believe that these correction and strict criteria for determining significant cross-correlations sufficiently exclude the chance of false correlations due to covariation or nonstationary firing rates from the BA and dHPC.

To further exclude the likelihood of ‘co-firing modulation effects on cross-correlations and spatial correlations’, we present additional analyses showing that (i) during the pre-surge, both BA and dHPC cells did not display time-locked responses to the specific event, and the response latencies (peak responses) following the robot surge were not overlapped between the BA and dHPC cells (Figure 1F,H in the revised manuscript), (ii) while BA Robot cells increased firing compared to nonRobot cells (Figure 2A and Figure 2─figure supplement 4C in the revised manuscript), there were no reliable differences between robot cell-paired distal cells and nest+proximal cells in their firing rates either during the pre-surge or post-surge period (Author response image 1B and Figure 2I in the revised manuscript), and (iii) that dHPC firing rates comparably increased in all nest, proximal and distal foraging regions (Appendix—figure 1B) yet all possible pairs (Robot/nonRobot-nest/proximal/distal) showed spike synchrony with lower proportions of Robot-place cell pairs; (31%, pre-surge; 34%, postsurge; Figure 2─figure supplement 3B in the revised manuscript), and (iv) only the Robot-paired distal cells (but not nonRobot-paired distal or Robot/nonRobot-paired nest+proximal cells) showed decreased spatial correlation between the pre-robot and robot sessions (Figure 2G,H in the revised manuscript). These results suggest that the increase in spike synchrony in BA-dHPC cells cannot fully be accounted by increased firing rates.

Author response image 1. The mean firing rates during the pre-surge (left) and post-surge (right) epochs of Robot/nonRobot cell-paired distal/nest+proximal cells.

Author response image 1.

As recommended, we also looked at ‘Robot+Pellet BA-dHPC’ cell pairs (Figure 2─figure supplement 4). Those pairs that showed significant synchrony during the pre-surge epoch also showed comparable firing rates during the pre-pellet epoch (2.5 s before the pellet acquirements during the pre-robot session). The mean firing rates between the pre-pellet and pre-surge epochs were not different (Figure 2—figure supplement 4E), yet their cross-correlations (CCs) were significant only during the presurge epoch (shown as the peak Z-scored dHPC spikes at the time of BA spikes during each epoch, Figure 2—figure supplement 4F). The same results were obtained for the pairs that showed significant synchrony during the post-surge epoch. Their firing rates were not different between the post-pellet (2.5 s after the pellet acquirements during the pre-robot session) and the post-surge epochs, but CCs were only significant during the post-surge epoch (Figure 2—figure supplement 4G,H). These results again confirm that co-firing between the two areas does not always lead to ‘synchronous firing’.

4) Also related to the above points, the selective degradation of place cell stability in dHPC cells and the significant cross-correlations with BA neurons in these cells could result from a coordinated increase in firing rates during/after robogator experience in these cell pairs. In this scenario, both remapping and correlated spiking are secondary to coordinated increases in firing rate in what, on the surface, appear to be 'connected' pairs.

In our reply to comment #3, we showed that BA Robot cells increased firing during the robot session (Figure 2A and Figure 2─figure supplement 3B in the revised manuscript) and dHPC firing rates comparably increased in all the nest, proximal and distal foraging regions (Appendix—figure 1B), yet all possible pairs (Robot/nonRobot-nest/proximal/distal) showed spike synchrony and only the Robotpaired distal cells showed decreased spatial correlation between the pre-robot and robot sessions (Figure 2G,H). Therefore, significance of cross-correlation and distal cell remapping cannot be fully attributed to firing increases. In addition, during the pre-surge epoch, BA robot cells did not increase firing rate but still show significant spike synchrony (Figure 1F in the revised manuscript), indicating the probability of correlated firing of the BA and dHPC cells, but not simple firing rate increases in the two regions contributed to significant spike synchrony.

5) Point 3 also applies to the optogenetic stimulation effects on dHPC place cell stability shown in Figure 4. The BA stimulation could be increasing firing rates in some of the dHPC cells resulting in a change in the spatial tuning of the cells.

We found that the optical stimulation of the BA in naïve rats sufficiently and selectively reduced the spatial correlations between pre-stimulation and stimulation sessions only in the distal dHPC cells. Further analyses revealed that optical stimulation of the BA caused increased firing rates in a subset of the distal cells (n=10), but there was no significant difference in spatial correlations between stimulation-neutral and stimulation-excited distal cells (Author response image 2). These results suggest that although BA stimulation elicited firings in some of the dHPC cells, the firing increase did not directly caused changes in spatial tuning of place cells.

Author response image 2. Spatial correlations (pre-stimulation vs. stimulation sessions) of stimulation-neutral distal cells and stimulation-excited distal cells.

Author response image 2.

6) Another issue is that a majority of the prior literature has not detected any major input from the BA to the dorsal hippocampus but do see strong inputs to the ventral hippocampus. The Petrovich, 2001 and Pitkanen, 2000 papers the authors cite that examined the BA-hippocampus connectivity systematically also don't see a major projection to dCA1, although the Rei paper does suggest that this connection exists. If the direct connections are minor, this doesn't seriously undermine the overall conclusions of the study, but should be acknowledged because the combined effect of the tracing and cross-correlation results in the current version of the paper imply a monosynaptic BA-dHPC connectivity.

Suggestions for improvement: The authors should more carefully describe their anatomical findings including from Figure 2-Suppl Figure 2A and show a) broader images in which hippocampal subareas can be seen, b) quantification of the cell number c) think about performing an anterograde tracing experiment looking at terminal innervation of CA1 from BA tracer injections. They could also look at the latency of the cross correlation values in individual cells as well as the latency of the optogenetic stimulation induced increases in firing rate to address this issue. If direct projections are minor, the authors should consider the possibility that the cross-correlations occur through indirect connectivity (which they do to some extent in the Discussion). If so, this doesn't seriously undermine the overall conclusions of the study, but should be acknowledged because the combined effect of the tracing and cross-correlation results in the current version imply a monosynaptic BA-dHPC connectivity.

In our original manuscript, we acknowledged that the amygdala-dCA1 connections are minor (pg. 15): “While the majority of amygdala and dHPC projections is polysynaptic, via dorsal CA3 and ventral HPC areas (McDonald and Mott, 2017; Pikkarainen et al.et al., 1999; Rei et al.et al., 2015), there is also evidence of direct amygdala and dHPC projections (present study; (Petrovich et al.et al., 2001; Pitkanen et al.et al., 2000; Wang and Barbas, 2018); whether this sparse connection contributes to the present results, however, requires further research employing circuit-specific and genetically defined cell type-specific manipulations in transgenic mice models (e.g., selective stimulations of retrogradely labeled BA neurons that directly project to the dHPC place cells).

As for the accuracy of citations, light amygdala-dCA1 projections were revealed via the Phaseolus vulgaris leukoagglutinin tracing method in both Petrovich et al.et al. (2001; see Figures 7, 9, 11) and Pikkarainen et al.et al. (1999; see Figures22B,C) papers. However, both papers emphasized that the amygdala projects primarily to temporal half of the (ventral) hippocampus. Because the functional significance of the sparce amygdala-dCA1 projections is beyond the scope of the present study, we decided to remove the tracing data (see also reviewer 2).

Reviewer #2:

In this paper the authors aim at identifying and testing reciprocal influence of the space and threat representations mediated by the dHPC and BA. To do so, they have recorded neuronal activity simultaneously in the dorsal hippocampus (dHPC) and basal amygdala, in a naturalistic foraging task with a looming robot simulating a threatening predator. In this task the animal venture from the nest into a foraging zone to retrieve a food pellet. In one of the sessions, the robot is activated as soon as the animal approaches the pellet, triggering a flight-type reaction (returning to the nest). The authors identify different subsets of BA neurons : threat-responsive and pellet-responsive, and then focus their analysis on threat responsive BA neurons (robot-cells) and study their correlation with the dorsal hippocampus neurons. They then use optogenetics to stimulate BA during foraging, mimicking the BA activation by the robot, and assess the effects of this stimulation on behavior and dHPC place cell stability.

The difficulty for assessing place cell activity in threatening situations is that the reaction triggered, in this case hesitation and pausing, constitute strong modification of the exploratory behavior usually requested to analyze place cell activity. It is then hard to pinpoint what is due to actual place-cell property modification and what is due to differences in behavior. The authors have addressed this question in previous studies (not reviewed here). In this paper they reproduce the same results as presented before and add an incremental step by using optogenetics to activate BA and trigger place field instability (they previously established that BA inactivation or lesion prevents place field disruption). A strength of the paper is that optogenetic stimulations of the BA, although triggering the same flight response as the robot, does not seem to trigger the same pausing and hesitations in the approach phase, therefore making this part less prone to spurious results in remapping due to behavioral changes.

The present study is based on simultaneous BA and dHPC recordings whereas our previous study (Kim et al., 2015) was based entirely on sole dHPC recordings. In the original manuscript, we presented the simultaneously recorded BA and dHPC units separately first to classify different BA and dHPC cell types (e.g., robot-responsive, pellet-responsive, nest cells, distal cells, etc.) before revealing their correlated firing characteristics. To accentuate and better explain the novel findings, the revised manuscript now presents (i) the BA and dHPC spike synchrony data first, and (ii) additional data analyses and novel results pertaining to BA and dHPC cell heterogeneity and their dynamic interaction during risky foraging.

We agree with the reviewer that hippocampal place cell firings generally relate to the animal’s movement speed and thus the behavioral changes in our study may contribute to the stability of the place cells.. To examine whether the robot-induced approach/escape behavior or speed changes affected place cell firing, we calculated the relative outward speed between the pre-pellet and pre-surge epochs [(speedpre-surge – speedpre-pellet)/(speedpre-surge + speedpre-pellet)], and the relative inward speed between the post-pellet and post-surge epochs [(speedpost-surge – speedpostpellet)/(speedpost-surge + speedpost-pellet); inbound foraging; Appendix—figure 1F; cf. Kim et al., 2015]. Then, we analyzed the relationship between the relative speed and the spatial correlations (pre-robot vs. robot sessions). Neither the relative outward nor inward speed was correlated with the spatial correlation in both nest/proximal and distal cells, suggesting hippocampal remapping during the robot session cannot be fully explained by the running speed per se. Also, as mentioned in the original manuscript, ‘…the fact that place cell remapping was observed across fear conditioning [i.e., animals displaying freezing] (Moita et al., 2003, 2004), inhibitory avoidance [i.e., animals staying away from the shocked compartment] (Schuette et al., 2020) and ethological fear [i.e., animals fleeing to the nest] (Kim et al., 2015) paradigms, where the animals exhibited dissimilar fear behaviors…’ would indicate that fear rather than the speed of the animal’s movement contributes to alterations in place fields.

As the reviewer acknowledged, we believe our BA-dHPC spike synchrony and optogenetic BA stimulation data corroborate the BA-mediated distal cell remapping during risky foraging in rats.

The major interest and novelty in this study, in my opinion, is the use of this valuable dataset (dHPC and BA simultaneous recordings in a naturalistic foraging task) to look at the fine temporal dynamics between BA and dHPC. Unfortunately, this is also very difficult due to the very small number of correlated cell pairs. Indeed, despite the authors's tracing data and previous literature on it, the presence of direct connections between dHPC and BA is not fully established and, at best, very sparse. This sparsity, or the possibility of correlations through other structures, doesn't make this study less interesting, only more difficult. Indeed, although promising, the author's claims that the BA and HPC reciprocally interact on a short time window around the robot "surge" or closer to the threat is only partially backed by their results that require, at this stage, more careful statistical controls.

As stated in the results, we have simultaneously recorded 1,999 pairs of BA and dHPC cells, of which 714 pairs met the minimum firing rate requirement. From 714 pairs, 30% of pairs (210 pairs) showed significant synchrony to the looming predatory robot. Given the difficulty of simultaneous recordings and a small fraction of fear-responsive amygdalar neurons (e.g., Barot et al., 2009; Gore et al., 2015), we believe our analyses are based on adequate data of correlated cells.

In our original manuscript, we stated that “While the majority of amygdala and dHPC projections is polysynaptic, via dorsal CA3 and ventral HPC areas (McDonald and Mott, 2017; Pikkarainen et al., 1999; Rei et al., 2015), there is also evidence of direct amygdala and dHPC projections (present study; (Petrovich et al., 2001; Pitkanen et al., 2000; Wang and Barbas, 2018); whether this sparse connection contributes to the present results, however, requires further research employing circuitspecific and genetically defined cell type-specific manipulations in transgenic mice models (e.g., selective stimulations of retrogradely labeled BA neurons that directly project to the dHPC place cells).” As our CTB tracing data from two animals were merely to confirm previous reports, as recommended by the reviewer, the CTB tracing data are now removed.

Regarding the CC analysis, we separated pre-surge and post-surge based on our previous study (Kim et al., 2018), where we confirmed that there were behavioral and neural differences between when the animal approached the robot (pre-surge; slower running speed and equivalent proportion of LA and PL leading pairs) and when animals ran away from the robot (post-surge; faster instantaneous running speed and increased proportion of LA leading pairs). In the current study, we also found that different cell pairs showed significant spike synchrony during the pre-surge and postsurge, and their firing patterns were distinct (Figure 1E-H and Figure 1─figure supplement 1C in the revised manuscript).

The testing window (100 ms) for the spike synchrony was set to investigate potential interaction between the dHPC and BA cells, not effects of robot-evoked responses. We chose the 100-ms window based on previous studies showing direct/indirect interaction between two brain structures [BLA-prelimbic cortex, cf. Burgos-Robles et al. (2017); LA-prelimbic cortex, cf. Kim et al. (2018); Lateral septum-hippocampal CA1, cf. Wirtshafter and Wilson (2020)]. For the CC analysis, the firing rate during the 2.5 s epoch (not the overall firing rate) was calculated to determine whether it met the firing rate criterion (i.e., the firing rate must be > 0.1 Hz in both paired cells). Among the total 1999 pairs, 714 pairs met the minimum firing rate requirement, and 30% (210 pairs) of the analyzed pairs showed significant synchrony. To exclude any possibility of covaried or random-overlapped correlations, the original data were analyzed via shift-predictor with ‘100 random shuffles’ and subtracting the shuffled CCs from the raw CCs (Burgos-Robles et al., 2017; Csicsvari et al., 2000; Narayanan and Laubach, 2009). These details and the information of the number of surge events/total recording time are now included in the Materials and methods (Cross-correlation). In addition, narrowing the length of the analysis window (±50 ms) did not change the spatial correlation (pre-robot vs. robot) of the robot cell-paired distal cells (no difference between the spatial correlations of the 100-ms vs. 50-ms cells; Author response image 3), but only reduced the number of distal cells (n=9) synchronized with BA cells, not allowing comparisons between the different types of the distal cells. Given the aforementioned studies and the present data, ±100 ms windows have been remained in our spike synchrony analyses.

Author response image 3. Spatial correlations between the pre-robot and robot sessions from the distal cells that showed significant spike synchrony with the robot cells within ±100 ms or ±50 ms.

Author response image 3.

– It seems that figures G and H are essentially recapitulating previous work done by the authors (Kim et al.et al. 2015). In particular, how is Figure 1H in the present paper different from figure 2c in the 2015 one?

The present study is based on simultaneous BA and dHPC recordings whereas the 2015 paper was based entirely on sole dHPC recordings. In the original manuscript, we opted to present BA and dHPC recording data separately to first show different BA and dHPC cell types (e.g., robot-responsive, pellet-responsive, nest cells, distal cells, etc.) before presenting their correlated firings. We now realize that this data sequence dampened the novelty of the study and thus we have rearranged the figures to draw attention to the originality of this study, which is that BA and dHPC neural activities were recorded simultaneously and empirically anchored to real dangers that animals face in nature.

– Remapping measures : the peak distance measure isn't clear and is not described in the methods. In the text it is mentioned pauses in the foraging behavior in the robot session. However average running speeds are higher, which I suppose is due to faster running/escaping to the nest. This means there are major speed/behavior differences in the robot and non-robot epochs that could be described/accounted for. In the same line of thought, I suggest an additional criteria for place cells of minimal velocity. This would be ensuring that the remapping is not due to behavioral differences between pre-robot and robot sessions.

How the peak distance was measured is now described in the Materials and methods (Place cell analysis).

To examine whether the robot-induced approach/escape behavior or speed changes affected place cell firing, we calculated the relative outward speed between the pre-pellet and pre-surge epochs [(speedpre-surge – speedpre-pellet)/(speedpre-surge + speedpre-pellet], and the relative inward speed between the post-pellet and post-surge epochs [(speedpost-surge – speedpost-pellet)/(speedpost-surge + speedpost-pellet; Appendix—figure 1F; cf. Kim et al.et al., 2015]. Then, we analyzed the relationship between the relative speed and the spatial correlations (pre-robot vs. robot sessions). Neither the relative outward nor inward speed was correlated with the spatial correlation in both nest/proximal and distal cells, suggesting hippocampal remapping during the robot session cannot be fully explained by the running speed per se. Also, as mentioned in the original manuscript, ‘…the fact that place cell remapping was observed across fear conditioning [i.e., animals displaying freezing] (Moita et al.et al., 2003, 2004), inhibitory avoidance [i.e., animals staying away from the shocked compartment] (Schuette et al.et al., 2020) and ethological fear [i.e., animals fleeing to the nest] (Kim et al.et al., 2015) paradigms, where the animals exhibited dissimilar fear behaviors…’ would indicate that fear rather than the speed of the animal’s movement contributes to alterations in place fields.

– Since the BA is supposed to encode both positive and negative valences, the "pellet-cells" should be included in the analysis, represented as in figure 1D and shown in figure 1F.

The pellet cells were mentioned in the pre-robot session but because they did not respond to the robot, they were categorized into ‘nonRobot’ cells. Also, the BA activity encoding positive valence was not our primary interest and beyond the scope of the study because the pellet success rate during the robot session was too low (< 3%) to analyze positive valence.

– If I understood the methods correctly, the data are normalized separately for the pre-robot and robot-sessions. Is it correct then to substract the z-values (figure 1f) coming from two different normalizations? (+ the number of cells in the text and figure do not match).

Among the robot-responsive BA cells (n=47), only excitatory BA cells (n=45) were included in the analysis for Figure 1F from the original manuscript. Since the Z-value indicates the activity increase over the baseline level in each session, the Z difference between the two sessions “provides a measure of the change in a cell's responsivity (Repa et al.et al., 2001).” However, we have decided to remove the original Figure 1F to highlight the correlational relationship between BA and dHPC pairs, which is the central point of the study.

– I would include a pie chart to clearly state robot, pellet, pellet-robot and neutral cells percentages and numbers in the principal figure.

As suggested, a pie chart is now included in the revised manuscript (Figure 2B). As replied in comment #3, the pellet cells were categorized into ‘nonRobot’ cells.

– CTB tracking measures : there is only one example, and the number of animals is not mentioned. There is no quantification. The cell bodies in CA1are blurry and since we don't see the rest of the picture this could well be baseline fluorescence. From the picture if we trust it it also seems that CA1 to BA projecting cells are much more numerous than BA to CA1 projecting cells. This supplementary figure is not convincing to me. I think it should be properly performed or removed. The paper does not need to establish direct connections between the dHPC and the BA to be relevant, provided the results are commented appropriately. Properly establishing this with tracing methods coupled with physiology (ie monosynaptic connections on cross-correlograms) is a whole other endeavor.

As replied above (Reviewer 1, comment #6), our original manuscript stated that the amygdaladCA1 connections are minor (pg. 15; (Petrovich et al.et al., 2001; Pitkanen et al.et al., 2000; Wang and Barbas, 2018). We merely confirmed this using the CTB tracing technique in two animals. As recommended, however, the CTB tracing data are now removed.

– The analyses presented in figure 2 are the one that require more careful control. First, I do not understand why the authors separated pre-surge and post-surge epochs. Then, the 100ms window, although justified by the authors from connectivity data, seem at least partially arbitrary (especially since they also show a long decay -10s- in figure 1F). Finally, restricting the analysis to such little data (the number of surge events/total recording time on which the ccgs are calculated should be stated) induces baselines close to zero and makes it vulnerable to spurious correlations. Then, figures 2C and F illustrate a circular reasoning because the authors are showing significant differences on the averages of cells that were selected based on this difference (during the window).

My suggestions are to : – put a limit of a minimal number of spikes in the considered windows (rather than an overall minimal firing rate) – perform the same analysis on randomly chosen 100 windows to evaluate the number of cell pairs that would be identified by chance (or potentially come up with other shuffling strategies). – Vary the length of the chosen window and see if the results are consistent.

First, we separated pre-surge and post-surge based on our previous study (Kim et al.et al., 2018), where we confirmed that there were behavioral and neural differences between when the animal approached the robot (pre-surge; slower running speed and equivalent proportion of LA and PL leading pairs) and when animals ran away from the robot (post-surge; faster instantaneous running speed and increased proportion of LA leading pairs). In the current study, we also found that different cell pairs showed significant spike synchrony during the pre-surge and post-surge, and their firing patterns were distinct (Figure 1E-H and Figure 1─figure supplement 1C in the revised manuscript).

The testing window (100 ms) for the spike synchrony was set to investigate potential interaction between the dHPC and BA cells, not effects of robot-evoked responses. We chose the 100-ms window based on previous studies showing direct/indirect interaction between two brain structures [BLA-prelimbic cortex, Burgos-Robles et al.et al. (2017); LA-prelimbic cortex, Kim et al.et al. (2018); Lateral septum-hippocampal CA1, Wirtshafter and Wilson (2020)]. For the CC analysis, the firing rate during the 2.5 s epoch (not the overall firing rate) was calculated to determine whether it met the firing rate criterion (i.e., the firing rate must be > 0.1 Hz in both paired cells). Among the total 1999 pairs, 714 pairs met the minimum firing rate requirement, and 30% (210 pairs) of the analyzed pairs showed significant synchrony. To exclude any possibility of covaried or random-overlapped correlations, the original data were analyzed via shift-predictor with ‘100 random shuffles’ and subtracting the shuffled CCs from the raw CCs (Burgos-Robles et al.et al., 2017; Csicsvari et al.et al., 2000; Narayanan and Laubach, 2009). These details and the information of the number of surge events/total recording time are now included in the Materials and methods (Cross-correlation). In addition, narrowing the length of the analysis window (±50 ms) did not change the spatial correlation (pre-robot vs. robot) of the robot cell-paired distal cells (no difference between the spatial correlations of the 100-ms vs. 50-ms cells; Author response image 3), but only reduced the number of distal cells (n=9) synchronized with BA cells, not allowing comparisons between the different types of the distal cells. Given the aforementioned studies and the present data, ±100 ms windows have been remained in our spike synchrony analyses.

Reviewer #3:

The authors investigate the impact of amygdala activity on coding of place in the hippocampus. They use a paradigm pioneered and established by this group in the past several years, which nicely combines foraging for food with predatory risk/fear. Rats were required to go out of their nest to look for food pellets while in an environment that includes a "scary" robot, designed to mimic predatory risk. This group has previously shown by lesions, inactivation, and disinhibition, that the amygdala regulates risk behavior (fear of the predator-robot) while foraging for food. Additionally, in a follow-up study, they recorded hippocampal place-cells and showed that spatial information is altered ("remapping") by foraging in the robot risky environment and that amygdala lesions prevent this remapping. In the prevent study they seek to establish this framework even further, and they therefore use two strategies: 1. Simultaneous recordings from the amygdala and the hippocampus that allow cross-correlations between single-units in both structures; and 2. Optogenetic excitation of amygdala cells while examining place coding and remapping in the hippocampus. Both approaches provide further evidence to the previous published findings and are overall well performed and reported with clarity. The conclusions are reasonably supported by the data, but the novelty is less clear, and the novel data does not provide clear insights.

The strengths of the paper are the simultaneous recordings of spikes in the amygdala and the hippocampus, which allow more direct evaluation of the effect of amygdala activity on remapping of hippocampal place-cells. The main finding is that remapping in the hippocampus occurred mainly at hippocampal cells that showed synchronous activity with robot-responsive amygdala cells. The other strength could be the optogenetic activation of amygdala cells and the effect on behavior and hippocampal remapping, providing a more concrete evidence that it is indeed increased activity in the amygdala that regulates behavior and place coding under threat.

The main weakness is that the results do not provide substantial additional insights beyond the already published studies.

The cross-correlations are a useful approach, but it is not clear how many of the overall CCs (1999) are independent, namely result from different pairs (vs how many include the same individual neuron). Adding to this the finding that the number of significant CCs is not really high and fluctuates around chance levels (5% or so), makes the finding hard to interpret.

As mentioned above (Reviewer 2, comment #7), the firing rate during the 2.5 s epoch (not the overall firing rate) was calculated to determine whether the CC analysis met the firing rate criterion (i.e., the firing rate must be > 0.1 Hz in both paired cell). Specifically, 714 out of 1999 pairs met the minimum firing rate requirement and 30% (210 out of 714 pairs) of the analyzed pairs showed significant synchrony. To exclude any possibility of covaried or random-overlapped correlations, the original data were analyzed by means of shift-predictor with 100 random shuffles and subtracting the shuffled CCs from the raw CCs (Burgos-Robles et al., 2017; Csicsvari et al., 2000; Narayanan and Laubach, 2009). This information is described in the Materials and methods (Cross-correlation).

Additionally, "non-robot" BA cells are defined as cells that did not respond to any event (robot or pellet), and these are therefore cells which potentially do not have any interest in the paradigm and of lower activity overall. As a result, they do not provide a proper control for CCs that might be related to "remapping" of hippocampal place cells. Finally, the correlation between position along the arena and the "remapping" are very nice but might well be a result of two groups (nest/proximal, and distal), rather than a real gradual correlation. This needs to be analyzed more carefully.

First, the nonRobot cells included the pellet-responsive cells (20.7% of the nonRobot cells) that increased firing to the pellet during the pre-robot session. We agree that the firing rate of the nonRobot cells was lower than that of the Robot cells during the robot session (Author response image 5A). However, the peak Z-score of the significant nonRobot cell-pair CCs was comparable with that of Robot cellpair CCs during the pre-surge epoch (Author response image 4B, left). Moreover, the peak Z-score of the nonRobot cell-pair CCs was higher than that of the Robot-cell pair CCs during the post-surge (Author response image 4B, right). Despite the significant spike synchrony, the nonRobot cell-paired distal place cells exhibited stable place fields across sessions unlike the Robot cell-paired distal place cells (Figure 2G,H in the revised manuscript). When further compared with the nest+proximal cells, the distal cells paired with the Robot cells, but not with the nonRobot cells, showed reduction in spatial correlation between the prerobot and robot sessions (Author response image 4C). These results indicate that while the nonRobot cells showed correlated firing with the dHPC place cells during the robot encounter, the nonRobot-place cell coupling did not affect the stability of distal place fields.

Author response image 5. Spatial correlations in nest + distal cells.

Author response image 5.

(A), proximal + distal cells (B), distal cells only (C), and nest + proximal cells (D) between pre-robot and robot sessions are plotted as a function of the peak firing location during the pre-robot session (left, nest; right, end of the foraging apparatus).

Author response image 4. Spike synchrony between the dorsal hippocampus and basal amygdala and its impact on spatial correlations of place cells.

Author response image 4.

(A) Firing rate differences between Robot, nonRobot and Robot+Pellet cells. (B) The dHPC spikes’ Z-score from significant Robot cell, nonRobot cell, and Robot+Pellet cell-paired CCs during the pre-surge (left) and post-surge (right). (C) The spatial correlations of nest vs. distal cells that were paired with Robot cells (left) or nonRobot cells (right).

Second, we further examined whether there was a gradual degradation of the spatial correlation as a function of the distance from the safe nest. To do so, we calculated the correlation coefficient between the peak firing location and spatial correlation in (i) nest + distal cells, (ii) proximal + distal cells, (iii) and distal cells only, and (iv) nest + proximal cells. In the first three conditions, we found significant correlations between the X-position and the spatial correlation (nest + distal, r = -0.2376; proximal + distal, r = -0.4488; distal only, r = -0.2459; Author response image 5A-C). There was no such correlation in the nest and proximal cells (r = 0.04118; Author response image 5D), consistent with our current and previous findings that there were no group differences between the nest and proximal cells (Kim et el., 2015; current study) and animals successfully procured the pellet within the limit of the proximal region (Choi and Kim, 2010). These results confirm that place cells gradually, not area-distinctively, remapped more as their place fields were located farther from the safe nest.

The optogenetics is a strength in principle but limited as well. First, if the authors would like to claim that it is indeed BA->HPC, then the power of optogenetics should be used by injecting in one place and stimulating in the other. Second, a control region should be used in addition to the amygdala, to make sure that the stimulation itself (cell excitation) is not in itself a fearful experience for the animal.

We agree with the first comment if BA neurons supposedly influence dHPC neuronal activities via their monosynaptic projections. However, as originally stated in the manuscript, the majority of amygdala and dHPC projections is polysynaptic (via dorsal CA3 and ventral HPC areas). Given the sparsity of direct BA-dHPC connection and other reviewers’ recommendations (i.e., Reviewer 1’s comment #6 and Reviewer 2’s comment #6), the CTB tracing data are now removed.

As for the second comment, we do not have a different brain region stimulation ‘control’ group, which can potentially raise further questions because stimulating a different region can affect/alter other (e.g., nondefensive) behaviors and neural circuits. However, we do have three control conditions, (i) EYFP control (the traditional channelrhodopsin control), (ii) low laser power control, and (iii) optic fiber misplacement control. In all three control conditions, we did not detect defensive behaviors at the timing of light delivery, and in the case of ii and iii control groups, their place cells showed no remapping. These findings suggest that the BA stimulation per se (in the absence of eliciting defensive responses) is not sufficient to cause place cell remapping.

Finally, the "remapping" is the finding that spatial sensitivity has changed, but there is no constructive value in it. In other words, if a place has a predator associated with it, then cells should either represent this location better (to remember and to avoid it), or they should remap to code for something else (e.g. a place that has other pellets and no risk). While one cannot ask the data to show something if it does not, it currently does not provide much beyond the previous studies, and further analyses are required to help understand how remapping is modulated by the amygdala to enable future behavior (e.g. in the post-robot period).

Our remapping data are consistent with the general view that hippocampal remapping ensues as external geometry of the environment or internal states of the animal change (Knierim and McNaughton, 2001; Sanders et al., 2020). We have previously shown that relatively high (but not low) fear state induced hippocampal remapping under the same looming robot situation (Kim et al., 2015). By generating unstable (remapped) place fields near the threat location (where the pellet is situated), the same physical environment might be transiently recognized as a risky context by the animal. Given that hippocampal place cells interacting with fear-coding BA cells selectively showed reduced spatial stability, the fear-induced disruptions of distal place fields may serve to prepare or sensitize the animal to avoid the fearful location. The fact that the firing locations of the distal place cells moved toward the safe nest under a predatory condition (Author response image 6) supports a possible constructive value of the remapping by which place cells instruct animals to “avoid” the location that they (the animals) originally “approached.”

Author response image 6. The comparisons of the peak firing locations of all distal cells during the pre-robot and robot sessions.

Author response image 6.

(A) The peak firing locations of all distal cells (n=81) during the pre-robot (top) and robot (bottom) sessions. The x-axis denotes the distance from the nest. (B) The distance differences of the peak firing locations between the pre-robot and robot sessions in all distal cells (peak firing locationrobot – peak firing locationpre-robot). Below zero indicates that the firing location moved toward the nest.

In addition to what was mentioned in the previous section:

1. Some controls are required to make sure that place-coding was not disrupted (remapping) by differences in visiting the distal regions due to the robot risk (different trajectories, less sampling as evident by low success rate etc.).

The original manuscript explicitly addressed this concern (pg. 5): “Because the looming robot prevented the animals from reaching the pellet location, all neural analyses was based on equating the nest-to-foraging distance in each trial of pre-robot, robot and post-robot sessions (Figure 1A).” However, to better clarify this, we added a note “limit for place field analysis” in Figure 1A and now state that “Because the looming robot prevented the animals from reaching the pellet location, the distal cells that had place fields beyond the foraging limit (where the animal did not visit during the robot session) were excluded from place cell analyses to equate the nest-to-foraging distance throughout the sessions.” And as mentioned above, the narrowing of the foraging pathway (21.3 cm width; Figure 1A in the revised manuscript), to ensure that pixel bins were sampled adequately for analyses, minimized the variability in foraging locations and trajectories.

2. The division between proximal to distal should be uniform, either in distance and/or in number of place-cells, both are required for correct interpretation.

In the previous place cell recording study (Kim et al.et al., 2015), we defined the proximal region as the foraging area between 0-25 cm from the nest since rats failed to procure the pellet beyond this proximal-distal boundary when facing a looming robot (Choi and Kim, 2010). We have also reported that when the distal zone was subdivided into two areas (one relatively nearer to the nest and other farther from the nest), there was no reliable difference in spatial correlation and the peak distance between the two distal areas.

3. Remapping (and also BA activity could result from distance from the nest (less safety), and this has been shown in many studies. Currently there is no way to dissociate the effect of the robot from the effect of the distance from the nest (they complement each other). Because all sessions are the same: pre-robot, robot, and post-robot, and there are not specific differences between cells in robot and post-robot, it is hard to dissociate the two factors. A future study can include sessions when a robot surges in a proximal location.

Our spatial correlation data showing distal place fields were stable during the pre-robot and post-robot sessions suggest that remapping cannot be explained merely by the distance from the nest (Figure 2─figure supplement 2C in the revised manuscript). Though we believe the present findings and additional analyses strongly support the idea that robot-induced fear (not the robot itself) instructs different populations of the place cells to encode safe (stable coding) vs. dangerous (unstable coding) locations differently, we also agree with the reviewer that clear dissociation between the effects of the predator and distance from the nest will provide useful information. The reviewer’s excellent suggestion for a future study—to test whether a looming robot closer to the nest would disrupt proximal place fields—is now mentioned in the discussion.

4. Another way to think about the previous concern, is to notice that by definition, a robot cell is a distal cell in the amygdala, and therefore CCs are expected (as nicely exemplified in the scheme in figure 5). a better design can dissociate the two factors.

This also relates to Reviewer 1’s comments #3-5 to which we responded that the significance of CCs cannot be attributed merely to the firing rate changes in both BA and dHPC. To directly compare the peak firing times of the BA Robot cells and dHPC distal cells that showed significant spike synchrony, we aligned the population activities of the Robot-distal pairs to the robot activations (t=0). Robot cell showed robot-evoked firing increases while the distal cells showed double-peaked responses since they fired when the animals visited the distal area, both nearing the robot and escaping from the robot (Figure 2─figure supplement 4A,B in the revised manuscript). Further, the peak firing times of the individual Robot-distal (paired) cells did not fall within a 500-ms time bin except two pairs (marked in red) that showed peaks beyond the post-surge epoch (3.5 s after the robot activation). The firing time differences suggest BA cells tended to respond to robot activation in a time-locked manner whereas dHPC cells fired in a location-specific manner. In addition, 18% (n=37 pairs) of the significant CCs were from dHPCnonRobot cell pairs, indicating firing increase is not always the direct cause of the spike synchrony between BA and dHPC.

5. The findings of CCs, central to the study, are not reported in a clear manner and one has to follow the numbers and the segmentation very carefully.

We now include detailed information concerning CCs in the Materials and methods (Crosscorrelation).

6. It is not clear when exactly photostimulation was delivered during the session.

The photostimulation timing information is now clearly described in the revised manuscript (line 297-298: approximating the robot trigger distance in Figure 1 experiment, ~ 25 cm from the pellet).

7. More "constructive" characterization of the remapping would really improve the study and its novelty. Do cells remap to code for a different place? How is it in relation to the pellet locations? Why should place-coding be disrupted if the animal wants to remember the location of a threat ?

Our remapping data are consistent with the general view that hippocampal remapping ensues as external geometry of the environment or internal states of the animal change (Knierim and McNaughton, 2001; Sanders et al.et al., 2020). We have previously shown that relatively high (but not low) fear state induced hippocampal remapping under the same looming robot situation (Kim et al.et al., 2015). By generating unstable (remapped) place fields near the threat location (where the pellet is situated), the same physical environment might be transiently recognized as a risky context by the animal. Given that hippocampal place cells interacting with fear-coding BA cells selectively showed reduced spatial stability, the fear-induced disruptions of distal place fields may serve to prepare or sensitize the animal to avoid the fearful location. The fact that the firing locations of the distal place cells moved toward the safe nest under a predatory condition (Author response image 6) supports a possible constructive value of the remapping by which place cells instruct animals to “avoid” the location that they (the animals) originally “approached.”

[Editors’ note: what follows is the authors’ response to the second round of review.]

Essential revisions:

Reviewer #1:

The authors have addressed most of my previous concerns and focused the paper around the more novel aspects of the findings related to the role of spiking synchronization between basal amygdala (BA) and dorsal hippocampus (dHPC) neurons during aversive experiences and the role of this process in producing experience dependent remapping of dHPC cells. This remapping is maintained transiently after the predator is removed but while animals are still exhibiting avoidance behaviors and not correlated with changes in firing rate, concerns from past reviews. Notably, BA optogenetic stimulation alone is sufficient to reduce foraging behavior and induce dHPC cell remapping. This provides a physiological mechanism for the authors' previous finding that BA lesions block predator induced dHPC cell remapping.

While these results are interesting, there is one remaining issue which should be addressed: Related to Figure 1 showing BA-dHPC synchrony, the authors report the percentage of cells showing synchrony around the pre/post predator encounter and they show that this did not occur in these aversive cell pairs during a non-aversive experiences (i.e. pre/post pellet procurement). However, they did not report any data on the pre/post pellet encounter, explicitly examining the percentage of cells showing significant cross-correlations (CCs) during these periods. This should be included along with an analysis of the overlap between cells with significant CCs during aversive or rewarding experiences if there is a large population of cells showing this for the pellet encounters. This will give the reader a better understanding of the nature of this synchronization, whether it is related specifically to aversive encounters and, if so, whether it occurs in separate populations of cells during these different types of experiences.

This is an excellent suggestion. To determine whether BA and dHPC cells show synchronized spiking during the appetitive experience, we performed additional analyses of CCs during pre-pellet and post-pellet epochs (2.5 s before and after the pellet procurement during the pre-robot session). We found a total of 175 pairs (excluding 4-overlapped pairs in both epochs) that showed significant synchrony during the pre-pellet (Figure 1─figure supplement 1D in the updated manuscript) or post-pellet epoch (Figure 1─figure supplement 1E in the manuscript). As shown with BA-dHPC cell pairs in robot encounters (pre- and post-surge epochs; Figure 1E and G), the significant (aligned) CCs observed in pellet procurements (pre- or post-pellet epoch) disappeared in other epochs.

We next quantified the selective synchrony in comparison with the pairs from robot encounters (Figure 1─figure supplement 1F in the manuscript). We found that the majority of pairs were selectively synchronized during the pellet or robot experiences (146 pairs during the pellet procurement; 174 pairs during the robot encounter), and there were only 29 pairs that showed significant synchrony during both experiences. The small number of (robot encounter and pellet procurement) overlapped pairs indicates that the BA and dHPC actively communicate not only during aversive but also appetitive experiences by recruiting different sets of BA-dHPC pairs. These results are now mentioned in the Results (Spike synchrony between BA and dHPC units during the predatory encounter).

Reviewer #2:

The authors did a fine job addressing most of the concerns, and performed additional analyses producing new figures and results.

Yet, I still feel that the main concern: "The main weakness is that the results do not provide substantial additional insights beyond the already published studies.", did not receive a direct and appropriate response in the letter. The CC and the optogenetics are an obvious novelty on one hand, yet on the other, the finding that BA activity in fearful environments is a pre-cursor for remapping of a [any] behavioral correlate that is relevant for the task, is not really novel. If the details and the mechanisms were more convincing, revealing something new about BA-HPC interactions, or about the remapping itself, then it could have been a more interesting study. Overall, I do not have a strong objection to the work, but I admit I am not convinced that it will make a major impact beyond previous work.

In addition, some concerns were not fully addressed. For example:

The optogenetics is a strength in principle, but limited as well. First, if the authors would like to claim that it is indeed BA->HPC, then the power of optogenetics should be used by injecting in one place and stimulating in the other. Second, a control region should be used in addition to the amygdala, to make sure that the stimulation itself (cell excitation) is not in itself a fearful experience for the animal.

Their answer: We agree with the first comment if BA neurons supposedly influence dHPC neuronal activities via their monosynaptic projections. However, as originally stated in the manuscript, the majority of amygdala and dHPC projections is polysynaptic (via dorsal CA3 and ventral HPC areas). Given the sparsity of direct BA-dHPC connection and other reviewers' recommendations (i.e., Reviewer 1's comment #6 and Reviewer 2's comment #6), the CTB tracing data are now removed.

This is an argumentative response. If we generalize this type of response, then why do we need any kind of study that injects in one place and stimulate in the other? There are polysynaptic connections between almost any two regions in the brain, hence stimulating one does not demonstrate conclusively that changes that occur in the other are caused by it. Perhaps the BA responses are what they are: BA responses to a fearful environment (as we know fo many years), and HPC remapping occurs due to other inputs from other region independent of the BA? I admit the CCs and the general common sense (hypothesis) in the field makes this less likely, but that is exactly my point about the novelty. Either you show the BA-HPC in a more convincing way, or it remains a correlational nice study with limited novelty.

In the previous version of the manuscript, we acknowledged the limitations of our optogenetic BA stimulation by stating: “The relative contributions of polysynaptic vs. monosynaptic amygdala-dHPC projections to the present results, however, requires further research employing circuit-specific and genetically defined cell type-specific manipulations in transgenic mice models…” We plan to investigate, in the mouse version of ‘approach food-avoid predator’ paradigm, selective stimulations of retrogradely labeled BA neurons that sparsely project to the dHPC place cells or multi-step stimulations/recordings including the di-synaptic BA-CA3/vHPC-dHPC circuits, which is a major research endeavor.

We agree with the reviewer that mechanisms of the causal relationship between the BA-dHPC have not been clearly demonstrated in our study, which is now mentioned in the Discussion. Nonetheless, we believe that this does not diminish the main finding that the place field remapping occurs only in dHPC place cell activities synchronized with BA fear-sensitive cell activities and as a function of escalating risk location. Also, note that the possibility of “HPC remapping occurs due to other inputs from other region independent of the BA” is unlikely given that amygdalar lesions abolished HPC remapping (Kim et al.et al., 2015).

Their answer: As for the second comment, we do not have a different brain region stimulation 'control' group, which can potentially raise further questions because stimulating a different region can affect/alter other (e.g., nondefensive) behaviors and neural circuits. However, we do have three control conditions, (i) EYFP control (the traditional channelrhodopsin control), (ii) low laser power control, and (iii) optic fiber misplacement control. In all three control conditions, we did not detect defensive behaviors at the timing of light delivery, and in the case of ii and iii control groups, their place cells showed no remapping. These findings suggest that the BA stimulation per se (in the absence of eliciting defensive responses) is not sufficient to cause place cell remapping.

I do not understand why they did not perform few additional experiments with this control?

Their claim that "stimulating a different region can affect/alter other (e.g., nondefensive) behaviors and neural circuits" is directly what they would want to test – that it is indeed BA inputs per-se, and not other changes. Moreover, their response "BA stimulation per se (in the absence of eliciting defensive responses)" indeed raises the possibility that BA stimulation induced a fearful state not because it was in the BA, but because the animal felt something unknown (i and ii do not address this) inducing a fearful state, and hence remapping (and again we are left without knowing if it is via the BA).

To emphasize again: I have no doubt that their hypothesis is likely correct, but the study as-is does not tell us much more than we already knew.

We apologize for the oversight of replying ‘BA stimulation per se’ (instead of ‘optical stimulation per se’) when referring to our EYFP and low laser power controls. We now explicitly state the caveats and potential limitations of the single-site stimulation approach in the Discussion. “…while the optogenetic stimulation results may be consistent with the notion that endogenous activation of BA pyramidal neurons disrupted spatial stability of dHPC place cells and impeded successful foraging, a major caveat of our single-site stimulation approach is that neither the possibility of nonspecific stimulation effects nor involvement of other brain regions can be excluded. The latter possibility, however, is unlikely given that amygdalar lesions effectively blocked predatory robot-induced fear and remapping of dHPC place cells (Kim et al.et al., 2015).”

1. Some controls are required to make sure that place-coding was not disrupted (remapping) by differences in visiting the distal regions due to the robot risk (different trajectories, less sampling as evident by low success rate etc.).

Their answer: The original manuscript explicitly addressed this concern (pg. 5): "Because the looming robot prevented the animals from reaching the pellet location, all neural analyses was based on equating the nest-to-foraging distance in each trial of pre-robot, robot and post-robot sessions (Figure 1A)." However, to better clarify this, we added a note…

This does not answer the main concern. It does address the analyses, but it does not address the potential confound those different trajectories and frequency of visiting distal regions contributed to the remapping. Namely that behaviors that are "outside" of the time/place taken for analyses, took part in remapping. Perhaps I am missing something in their controls?

To clarify, we matched the frequency of visiting the distal zone between the pre-robot and robot sessions (8-10 trials, detailed information can be found in the Materials and methods section; Behavioral paradigms). Specifically, the robot was activated only when the animal visited the pellet vicinity (~ 25 cm from the pellet). In other words, since one robot activation was counted as one robot trial, the animals visited the distal zone the comparable number of times across sessions. Second, selective remapping in distal cells was also observed in our optogenetics experiment, where animals showed relatively linear foraging trajectories and no hesitancy in foraging behavior as there were no discernable external threat (see Figure 4A in the updated manuscript). Hence, the selective remapping in distal cells cannot be accounted by different trajectories or less sampling between pre-robot vs. robot trials.

2. The division between proximal to distal should be uniform, either in distance and/or in number of place-cells, both are required for correct interpretation.

In the previous place cell recording study (Kim et al.et al., 2015), we defined the proximal region as the foraging area between 0-25 cm from the nest since rats failed to procure the pellet beyond this proximal-distal boundary when facing a looming robot (Choi and Kim, 2010). We have also reported that when the distal zone was subdivided into two areas (one relatively nearer to the nest and other farther from the nest), there was no reliable difference in spatial correlation and the peak distance between the two distal areas.

This is great. Why not repeat the same analyses here and show it is similar? One cannot rely on a previous study for such controls.

As suggested, we have repeated the same analyses (cf. Kim et al.et al., 2015) by separating the distal cells into two groups based on their max firing locations: one with a max firing location nearer to the nest (25-75 cm from the nest, n=53) and the other with a max firing location farther from the nest (75-125 cm from the nest, n=28). We then compared their spatial correlations and peak distances between the pre-robot and robot sessions to confirm our definition of the distal zone. We found no reliable differences in spatial correlations (Author response image 7A, Nearer vs. Farther) and peak distances (Author response image 7B; Nearer vs. Farther) between the two distal cell sub-groups. These results are consistent with our earlier report (Choi and Kim, 2010; Kim et al.et al., 2015) and suggest that our definition of proximal and distal zones is not arbitrary but supported by behavioral and electrophysiological data. Also, note that remapping observed in both distal cell sub-groups (i.e., Nearer and Farther) addresses, at least partly, the potential confounds of different trajectories affecting remapping in distal cells.

Author response image 7. Spatial correlations and peak distances between the pre-robot vs. robot sessions from the nest, proximal, nearer distal, and farther distal cells.

Author response image 7.

(A) Spatial correlations between the pre-robot and robot sessions from the nest, proximal, and distal cells (Nearer distal cells: fired relatively nearer to the nest; Farther distal cells: fired farther from the nest). (B) Peak distances between the pre-robot and robot sessions from the nest, proximal, and distal cells (Nearer distal cells: fired relatively nearer to the nest; Farther distal cells: fired farther from the nest).

Associated Data

    This section collects any data citations, data availability statements, or supplementary materials included in this article.

    Data Citations

    1. Kong M, Kim E, Park S, Zweifel L, Huh Y, Cho J, Kim J. 2021. BA-dHPC simultaneous recording. Dryad Digital Repository. [DOI]

    Supplementary Materials

    Supplementary file 1. Supplementary file 1A.

    The percentage of the basal amygdala (BA) cell types. A total of 250 pyramidal cells were recorded. The bottom table shows the percentage of the cells showing the same, different, or no responses between the pre-robot and the robot sessions. Supplementary file 1B. Firing properties of dHPC place cells during the pre-robot, robot, and post-robot sessions. Kruskal–Wallis test (average firing rate, peak rate, spatial info, and running speed) and one-way ANOVA (field size); *p<0.05, **p<0.01, and ***p<0.001 compared to the nest cells; #p<0.05 compared to the proximal cells. Supplementary file 1C. Firing properties of place cells during the pre-stimulation, stimulation, and post-stimulation sessions. Data are from the rats with behavioral effects to the photostimulations. Kruskal–Wallis test; **p<0.01 and ***p<0.001 compared to the nest cells; #p<0.05, ##p<0.01, and ###p<0.001 compared to the proximal cells. Supplementary file 1D. Firing properties of place cells during the pre-stimulation, stimulation, and post-stimulation sessions. Data are from the rats without behavioral effects to the photostimulations. Kruskal–Wallis test; *p<0.05 and ***p<0.001 compared to the nest cells; #p<0.05 compared to the proximal cells. Supplementary file 1E. Descriptions and coordinates for each experiment. Supplementary file 1F. Summary of statistical tests performed.

    elife-72040-supp1.docx (51.2KB, docx)
    Transparent reporting form

    Data Availability Statement

    The data that support the findings of this study are available under the project DOI: https://doi.org/105061/dryad2z34tmpn0. The customized analysis tools are deposited on GitHub: https://github.com/KimLab-UW/Crosscorrelation (copy archived at swh:1:rev:f016d43afc82c855ecf0603ca52a881b9895689e, Kim, 2019a) and https://github.com/KimLab-UW/Behavioral_Analysis, (copy archived at swh:1:rev:d866f2f89f53588840d79f4d730f796378e81dad, Kim, 2019b).

    The data that support the findings of this study are available under the project DOI https://doi.org/10.5061/dryad.2z34tmpn0. The customized analysis tools are deposited on GitHub at https://github.com/KimLab-UW/Behavioral_Analysis (copy archived at swh:1:rev:d866f2f89f53588840d79f4d730f796378e81dad) and https://github.com/KimLab-UW/Crosscorrelation (copy archived at swh:1:rev:f016d43afc82c855ecf0603ca52a881b9895689e).

    The following dataset was generated:

    Kong M, Kim E, Park S, Zweifel L, Huh Y, Cho J, Kim J. 2021. BA-dHPC simultaneous recording. Dryad Digital Repository.


    Articles from eLife are provided here courtesy of eLife Sciences Publications, Ltd

    RESOURCES