Abstract
Purpose:
We evaluated the prognostic value of 10 putative tumor markers by immunohistochemistry in a large multi-institutional cohort of patients with locally advanced urothelial cancer of the bladder (UCB) with the aim to validate their clinical value and to harmonize protocols for their evaluation.
Materials and Methods:
Primary tumor specimens from 576 patients with pathologic (p)T3 UCB were collected from 24 institutions in North America and Europe. Three replicate 0.6-mm core diameter samples were collected for the construction of a tissue microarray (TMA). Immunohistochemistry (IHC) for 10 previously described tumor markers was performed and scored at three laboratories independently according to a standardized protocol. Associations between marker positivity and freedom from recurrence (FFR) or overall survival (OS) were analyzed separately for each individual laboratory using Cox regression analysis.
Results:
The overall agreement of the IHC scoring among laboratories was poor. Correlation among the three laboratories varied across the 10 markers. There was generally a lack of association between the individual markers and FFR or OS. The number of altered cell cycle regulators (p53, Rb, and p21) was associated with increased risk of cancer recurrence (p < 0.032). There was no clear pattern in the relationship between the percentage of markers altered in an 8-marker panel and FFR or OS.
Conclusions:
This large international TMA of locally advanced (pT3) UCB suggests that altered expression of p53, Rb, and p21 is associated with worse outcome. However this study also highlights limitations in the reproducibility of IHC even in the most expert hands.
Keywords: Prognostic Markers, Bladder Cancer, Tissue Microarray
INTRODUCTION
Urothelial carcinoma of the bladder (UCB) is a heterogeneous disease characterized by multiple molecular alterations and a variable clinical course.1 Beginning with the finding that point mutations in the p53 cell cycle regulatory gene correlated strongly with increased expression of the non-functional protein due to increased half-life2, Esrig et al showed that overexpression of p53 was strongly associated with UCB recurrence and death, especially in early invasive disease (pT1–2)3. Subsequently, Cote et al showed that alterations in p53 made UCB more susceptible to cisplatin-based therapy4, which led to the first clinical trial in UCB that used the alteration of a molecular marker (p53) to stratify patients for adjuvant treatment5.
Subsequent studies demonstrated that other cell cycle regulatory genes and proteins, including p21 and pRB, are associated with UCB clinical outcome in patients undergoing cystectomy.6–14 Chatterjee first reported that a combination of alterations in cell cycle regulatory proteins (p53, p21, pRb) provided more information regarding recurrence and death from UCB than any single marker alone15. Lotan et al, in a multicenter analysis, validated and extended these findings using a panel of five immunohistochemical markers related to the cell cycle and proliferation (p53, p21, p27, cyclin E1, and Ki-67) that correlated with recurrence and cause-specific mortality after radical cystectomy for muscle invasive UCB. However, many marker studies have been limited by small sample size, by the use of univariate statistical analysis to identify the putative marker of interest, by not analyzing coexpression of other potential biomarkers, and by lack of independent validation.
The primary goal of this study was to evaluate the prognostic value of 10 predefined putative tumor markers in a large multi-institutional cohort of patients with pT3 UCB. Stage pT3 was selected because these patients are often considered for adjuvant therapy, and we aimed to test if established biomarkers could be used to stratify risk in patients being considered for adjuvant therapy. To address this aim, we created tissue microarrays (TMA) by using submitted tumor specimens from all participating institutions, taking advantage of the collaboration between the Bladder Cancer SPORE Project and the International Bladder Cancer Network.16 A tissue microarray (TMA) is extremely useful to analyze many molecular markers in a large number of samples concurrently.17 We also aimed to evaluate the reproducibility of immunohistochemistry (IHC) for the 10 selected markers by comparing results across three independent, experienced laboratories.
MATERIALS AND METHODS
Patient Selection
Primary tumor specimens from 576 patients with muscle invasive UCB were collected from 24 institutions in North America (13 centers; 335 patients) and Europe (11 centers; 241 patients). The specimens were staged and graded according to the American Joint Committee on Cancer’s AJCC Cancer Staging Manual, 7th Edition, and the 2004 World Health Organization classification, respectively.18,19 All samples were derived from radical cystectomy specimens with tumors extending into perivesical fat (pT3) without distinction of microscopic (pT3a) versus gross (pT3b) invasion. At least one lymph node had to be examined in each patient to ensure that some degree of pelvic lymph node dissection had been performed. Only patients with a minimum of 3 years of clinical follow-up were included unless a recurrence event occurred before this time. Patients receiving neoadjuvant chemotherapy and/or radiation therapy were excluded. No restrictions were made regarding adjuvant therapy. Squamous and/or glandular differentiation was allowed, but other variant histologic patterns or pure adenocarcinoma or squamous cell carcinoma were excluded. The corresponding pathologic and clinical data were provided for each patient by the contributing institutions and were approved by each institutional review board.
Tissue Microarray
The TMA was constructed by an expert bladder cancer pathologist at one center (G.S.). Histologic features, tumor grade, and disease stage were confirmed by blinded review of new hematoxylin and eosin (H&E)-stained sections cut from duplicate archival paraffin blocks for each radical cystectomy case. Three replicate samples of 0.6-mm core diameter were collected from the tumor area and placed on separate randomly arranged spaces for the purpose of constructing TMA blocks. Sections (3–4 μm) were obtained from the TMA and were stained with H&E to confirm a high proportion of tumor and to review again the tumor histologic features and other pathologic parameters of the sampled tissue. Cores from 18 normal control tissues from heart, skin, prostate, kidney, colon, lung and endometrium were included on the TMA (Figure 1).
Figure 1:
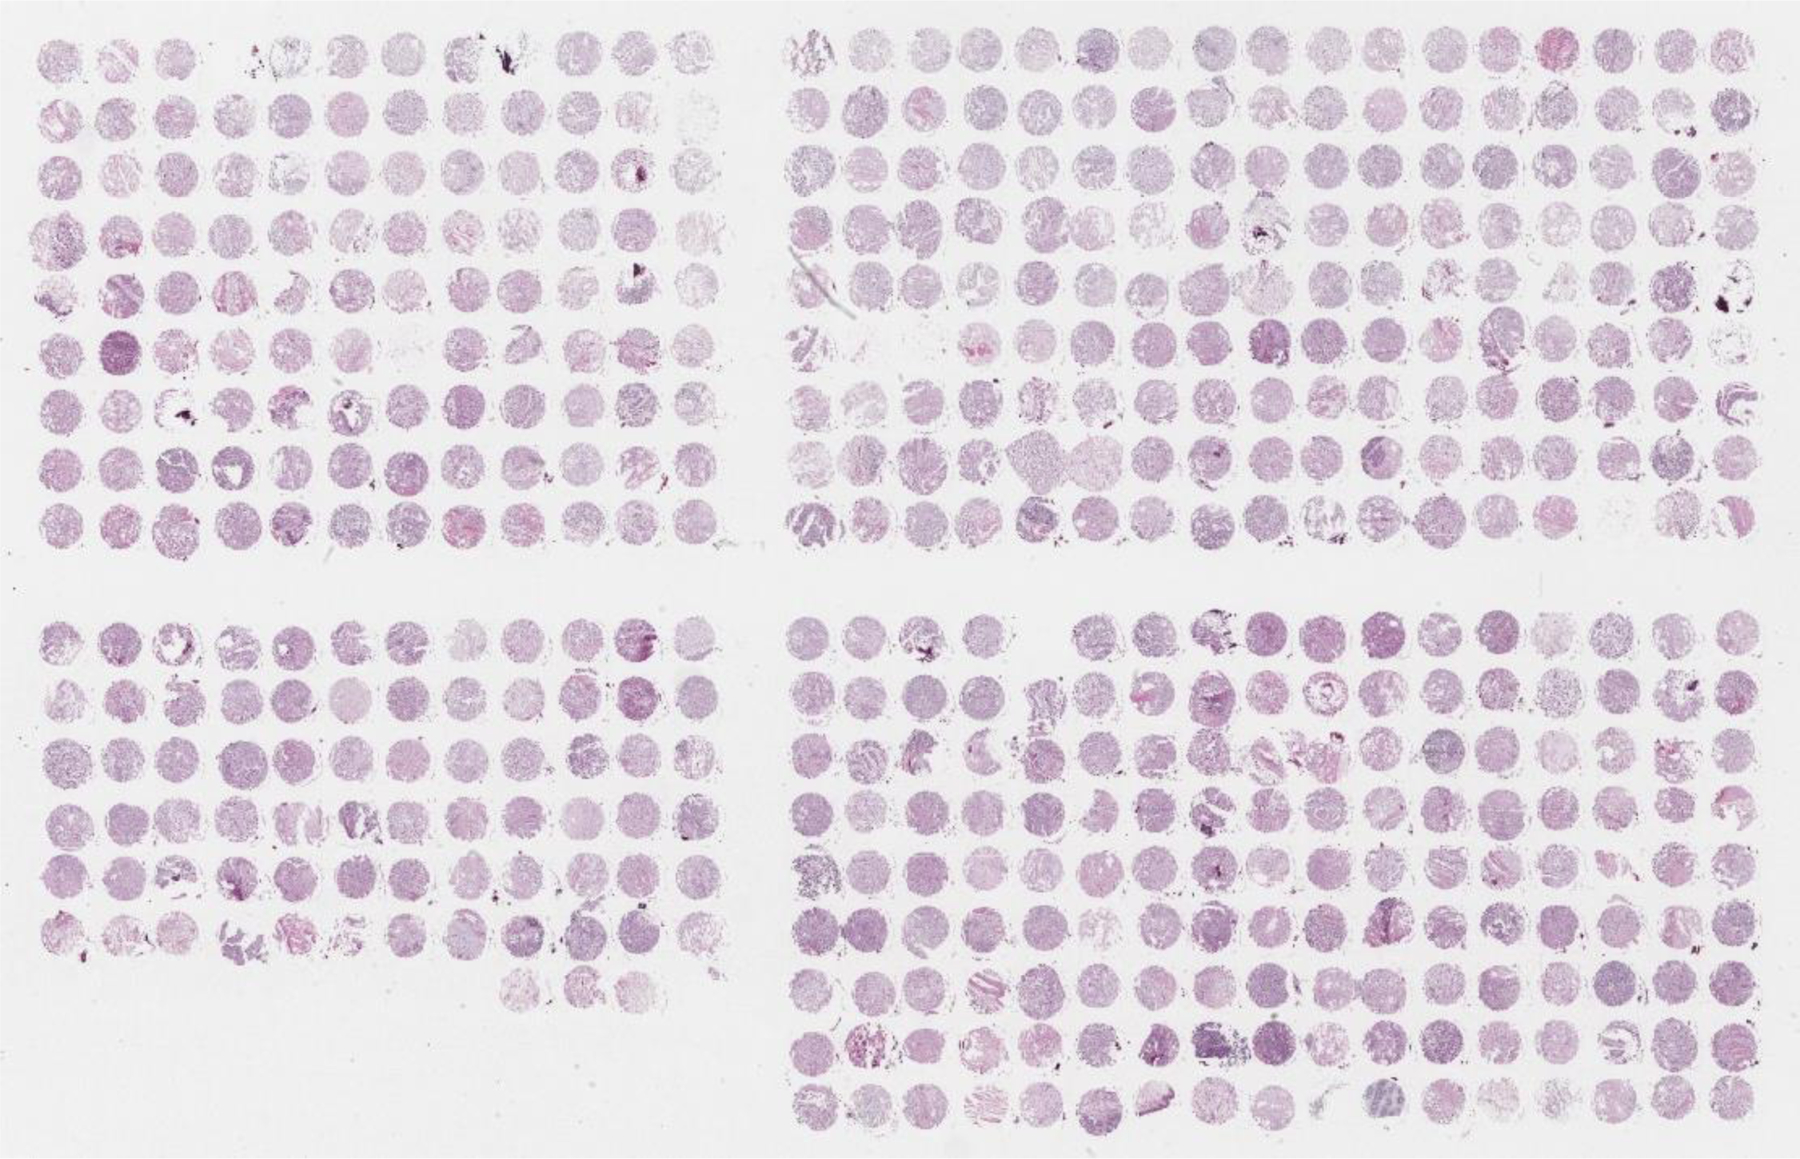
Hematoxylin & eosin-stained slide of the tissue microarray.
IHC Analysis
All IHC analyses were performed independently at three laboratories (CC at Columbia University, New York City; FW at University of California, San Francisco; and RC at University of Southern California, Los Angeles). One section of the TMA was stained with H&E and one with each of the 10 antibodies listed in Table 1. Each laboratory used aliquots of each antibody from a single batch and followed standard protocols for staining, including the same antibody retrieval methods and the same antibody concentrations.
Table 1:
Antibodies used for immunohistochemical scoring
| Protein | Antibody | Manufacturer | Dilution | Preparation | Location | Threshold | Intensity |
|---|---|---|---|---|---|---|---|
| p53 (1801) | PAb1801 | Calbiochem | 1:100 | microwave in citrate buffer | nuclear | >10% | 1–3+ |
| p21 | EA10 (Ab-1) | Calbiochem | 1:20 | microwave in citrate buffer | nuclear | >10% | 1–3+ |
| p16 | 16PO7 | Neomarkers | 1:40 | microwave in citrate buffer | nuclear | >10% | 1–3+ |
| Retinoblastoma (Rb) | 3C8 | QED BioSci | 1:200 | microwave in citrate buffer | nuclear | <5% or ≥51% of cells positive | 1–3+ |
| Cyclin D1 | Ab-3 | Calbiochem | 1:20 | microwave in citrate buffer | nuclear | >10% | 1–3+ |
| E-Cadherin | HECD-1 | Zymed | 1:1000 | microwave in citrate buffer | membranous | >10% | 1–3+ |
| EGFR | 2–18C9 | Dako | 1:200 | proteinase K | membranous | >10% | 1–3+ |
| ErbB2 (HER-2/neu) | A0485 | Dako | undiluted | microwave in citrate buffer | membranous | >10% | 2–3+ |
| VEGF | JH121 | Neomarkers | 1:50 | steam in EDTA buffer | membranous | >10% | 1–3+ |
| Ki-67 | MIB1 | Dako | 1:100 | trypsin+microwave | nuclear | % of cells with 1–3+ intensity | 1–3+ |
Scoring
The results of IHC analyses were scored at each laboratory separately. The staining of each core on each section was graded according to the intensity of staining (0 = negative, 1 = weak, 2 = moderate, 3 = strong) and by the percentage of cells staining (0% to 100% in decile increments: 0%, 1%−10%, 11%−20%, etc.) in the selected cellular location (membranous, nuclear, cytoplasmic). For all but HER2/neu and Ki-67, the primary measure used for analysis was “positive” versus “negative” staining. The criteria for positive staining included staining in the appropriate subcellular location (Table 1) in more than 10% of cells with an intensity of 1+ to 3+. For HER2/neu, only 2+ and 3+ staining was considered positive. For Ki-67, the percentage of cells stained with an intensity of 1+ to 3+ was reported, and patients were categorized into lower (<33.3%), medium (33.3% to 66.6%), and upper (≥66.7%) tertiles on the basis of the percentage of cells stained. For Rb, we also determined differentiated altered Rb (<5% or ≥51% of cells stained) from wild-type Rb (5%−50% of cells stained) based on IHC criteria.
After determining the percentage of positive staining from each laboratory, we derived consensus scores: if all three laboratories scored a marker as positive or negative, or if two laboratories scored a marker as positive or negative and the third laboratory did not score it, we considered the overall score to be positive or negative, respectively. An indeterminate overall score was attributed to scores if the individual score was missing in two laboratories or if there was disagreement between the laboratories. If all three scores were missing, an overall score could not be given.
Statistical Analysis
The primary end point for this study was freedom from recurrence (FFR), and the secondary end point was overall survival (OS). Time to each endpoint was measured from the date of radical cystectomy. Associations between marker positivity and FFR or OS were analyzed separately for each individual laboratory by using Cox regression analysis.
We derived consensus scores of marker positivity by combining scoring results from the three laboratories as described above and examined the associations between the consensus scores and FFR or OS. The rules we used to combine the scoring results from the three laboratories were as follows: (1) For all markers except Ki-67, we used the rules described in Table 1. VEGF was excluded from the consensus analysis since one of the laboratories did not score this marker. (2) For Ki-67, a patient with a score of “High, High, High” or “High, High, Medium” or “High, High, Missing” across the three laboratories was considered to have high expression of Ki-67, and a patient with a score of “Low, Low, Low” or “Low, Low, Medium” or “Low, Low, Missing” across the laboratories was considered to have low expression of Ki-67. All other combinations of scores across the three laboratories were considered to be either indeterminate or missing. (3) For Rb, we calculated a consensus score for marker positivity, but also obtained a consensus score for whether Rb was altered or wild-type and assessed its association with FFR and OS.
Marker Panels
A 3-marker panel of cell cycle regulatory proteins was defined to include Rb, p21, and p53. Patients for whom any 1 of the 3 markers was not scored by a laboratory were considered missing and were excluded from the analyses. A second 8-marker panel was defined to include Rb, p21, p53, EGFR, HER2, E-cad, p16, and cyclin D1. VEGF was excluded because it was not done at one center and Ki67 was excluded because it was scored in percentage with no cut-off for positivity. Patients who had missing or indeterminate consensus results for 6 or more of these 8 markers were excluded from the consensus analyses. The proportion of markers that were altered in an individual patient was calculated as the number of altered markers according to the consensus scoring divided by the total number of markers that had a consensus score. The patients were further stratified according to the proportion of markers altered as: a) low: patients with ≤25% of the markers altered, b) intermediate: patients with >25% and ≤50% of the markers altered, c) high: patients with >50% of the markers altered.
RESULTS
Clinical Characteristics and Outcomes
Complete clinical data were available for 504 of 576 patients. Results from all 576 patients were used to test the reproducibility of staining between the different centers. Eligibility criteria were not met in 44 and 61 were excluded due to insufficient follow-up, which left 399 patients for analysis of the association between marker status by IHC and clinical outcomes. The clinicopathologic characteristics and outcomes of these 399 patients are summarized in Table 2. The actuarial FFS probability was 75.9% at 1 year, 51.1% at 5 years, and 45.1% at 10 years (Figure S1). The actuarial OS probability was 81.0% at 1 year, 43.1% at 5 years, and 27.1% at 10 years. Nodal metastasis, which was identified at the time of cystectomy in 99 (24.8%) patients, was strongly associated with decreased FFR (Figure 2A) and OS (Figure 2B).
Table 2:
Clinical and pathological characteristics of patients with corresponding clinical outcomes
| Characteristics (N=399) | N | FFR |
OS |
||||
|---|---|---|---|---|---|---|---|
| 5-year Rate±SE |
Logrank p value |
HR (95% CI) |
5-year Rate±SE |
Logrank p value |
HR (95% CI) |
||
|
| |||||||
| Overall | 399 | 51±3% | -- | -- | 43±3% | -- | -- |
|
| |||||||
| Area | |||||||
| North America | 278 | 51±3% | Ref | 46±3% | ref | ||
| Europe | 121 | 50±5% | 0.97 | 1.0 (0.71, 1.4) | 36±5% | 0.38 | 1.1 (0.86, 1.5) |
|
| |||||||
| Age at Cystectomy | |||||||
| <65 years | 151 | 57±4% | ref | 50±4% | ref | ||
| >=65 years | 237 | 49±4% | 0.17 | 1.2 (0.91, 1.7) | 38±3% | 0.003 | 1.5 (1.2, 2.0) |
| Unknown | 11 | 12±11% | (excluded) | 40±15% | (excluded) | ||
|
| |||||||
| Sex | |||||||
| Male | 301 | 50±3% | ref | 42±3% | ref | ||
| Female | 98 | 54±6% | 0.38 | 0.85 (0.58, 1.2) | 45±5% | 0.48 | 0.90 (0.66, 1.2) |
|
| |||||||
| Histologic Diagnosis | |||||||
| Urothelial Ca Only | 326 | 50±3% | ref | 42±3% | ref | ||
| Urothelial Ca with Other | 73 | 53±6% | 0.95 | 0.99 (0.67, 1.5) | 46±6% | 0.74 | 0.94 (0.67, 1.3) |
|
| |||||||
| N-Stage | |||||||
| N0 | 300 | 57±3% | ref | 50±3% | ref | ||
| N1–3 | 99 | 26±6% | <0.001 | 2.2 (1.6, 3.0) | 20±5% | <0.001 | 2.0 (1.5, 2.7) |
|
| |||||||
| CIS Presence | |||||||
| Absent | 246 | 58±4% | ref | 49±3% | ref | ||
| Present | 128 | 39±5% | <0.001 | 1.7 (1.3, 2.4) | 34±5% | 0.002 | 1.5 (1.2, 2.0) |
| Missing | 25 | 29±11% | (excluded) | 32±10% | (excluded) | ||
|
| |||||||
| Margin Status | |||||||
| Negative | 347 | 52±3% | ref | 47±3% | ref | ||
| Positive | 18 | 13±12% | 0.008 | 2.4 (1.2, 4.8) | 19±12% | 0.006 | 2.2 (1.2, 4.0) |
| Missing | 34 | 48±10% | (excluded) | 21±7% | (excluded) | ||
Figure 2: Freedom from recurrence (A) and overall survival (B) stratified by pathologic N-Stage.
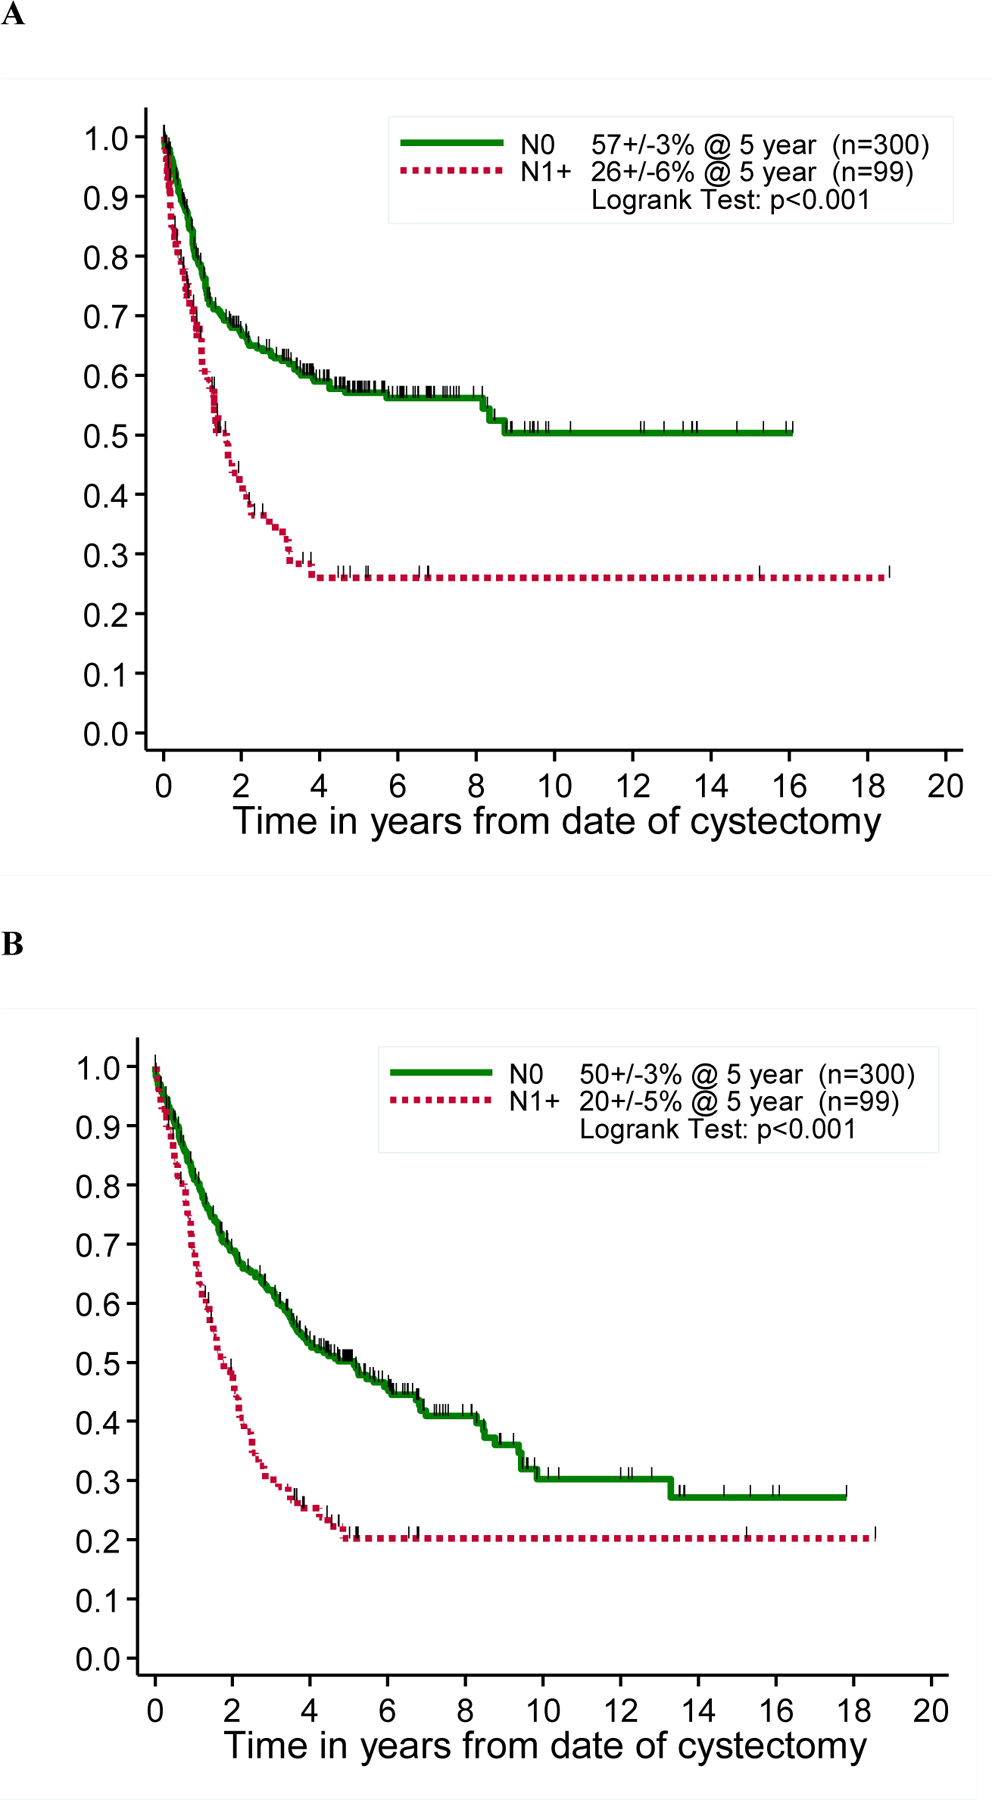
Kaplan-Meier curve depicting freedom from recurrence (FFR) and overall survival (OS), by N-stage of the disease.
Consensus scoring among the laboratories
The number of patients with successful staining results for each of the 10 protein markers is indicated in Table 3 along with the rate of marker positivity for each individual marker in each laboratory, and according to consensus scoring. Table 3 also describes the agreement between pairs of laboratories according to the percentage of cases for which both laboratories agreed that staining was positive or negative. The rate of disagreement ranged widely from 5% to 80%. The Spearman rank correlation was calculated for Ki-67 staining. These data were used to estimate the agreement between the pairs of laboratories as measured by the Kappa statistic (Table 4). This analysis suggested best agreement for p16 (72–90%) and p53 (59–78%) and worst agreement for EGFR (17–54%). Overall the agreement between laboratories was poor.
Table 3:
Summary of pairwise agreements among 3 laboratories (n=576)
| Lab B and Lab A | Lab B and Lab C | Lab A and Lab C | consensus | |||||||||||
|---|---|---|---|---|---|---|---|---|---|---|---|---|---|---|
| Marker | N | % of Cases | N | % of Cases | N | % of Cases | N | Positive (%) | ||||||
| Both Positive | Both Negative | Disagree | Both Positive | Both Negative | Disagree | Both Positive | Both Negative | Disagree | ||||||
| p53 | 397 | 29% | 56% | 15% | 384 | 26% | 65% | 9% | 388 | 28% | 53% | 19% | 322 | 104 (32%) |
| p21 | 410 | 15% | 50% | 35% | 401 | 13% | 64% | 23% | 452 | 30% | 47% | 23% | 283 | 64 (23%) |
| p16 | 400 | 32% | 55% | 13% | 373 | 32% | 56% | 12% | 397 | 41% | 54% | 5% | 369 | 138 (37%) |
| Rb | 397 | 18% | 54% | 28% | 370 | 19% | 38% | 43% | 412 | 45% | 38% | 17% | 270 | 91 (34%) |
| Cyclin D1 | 385 | 5% | 88% | 7% | 372 | 5% | 90% | 5% | 418 | 7% | 86% | 7% | 408 | 21 (5%) |
| E-cadherin | 396 | 11% | 63% | 26% | 370 | 6% | 84% | 10% | 392 | 10% | 62% | 28% | 306 | 29 (10%) |
| EGFR | 386 | 30% | 32% | 38% | 361 | 31% | 18% | 51% | 381 | 66% | 17% | 17% | 208 | 130 (63%) |
| Her-2 | 416 | 6% | 77% | 17% | 404 | 6% | 84% | 10% | 427 | 14% | 75% | 11% | 367 | 29 (8%) |
| VEGF | 186 | 10% | 10% | 80% | 0 | 0 | 37 | 18 (49%) | ||||||
| Ki-67 (Spearman Rank Corr) | 403 | r=0.77 | 393 | r=0.68 | 415 | r=0.69 | ||||||||
Table 4:
Summary of pairwise agreement between 3 laboratories (n=576): Kappa estimate (95% confidence interval)*
| Marker | Lab B and Lab A | Lab B and Lab C | Lab A and Lab C | ||
|---|---|---|---|---|---|
| p53 | 68% (61%, 75%) |
78% (71%, 85%) |
59% (51%, 67%) |
||
| p21 | 29% (23%, 36%) |
40% (31%, 49%) |
53% (45%, 60%) |
||
| p16 | 72% (66%, 79%) |
75% (68%, 81%) |
90% (85%, 94%) |
||
| Rb | 41% (34%, 49%) |
25% (19%, 31%) |
67% (61%, 74%) |
||
| E-cadherin | 36% (27%, 44%) |
52% (38%, 65%) |
31% (23%, 39%) |
||
| Cylin D1 | 55% (40%, 70%) |
63% (48%, 79%) |
65% (53%, 77%) |
||
| EGFR | 33% (26%, 39%) |
17% (12%, 22%) |
54% (45%, 64%) |
||
| Her-2 | 35% (25%, 46%) |
51% (39%, 64%) |
66% (57%, 75%) |
||
| VEGF | 1.40% (−1%, 4%) |
- | - |
A value of 100% indicates perfect agreement and a value of 0% indicates a random relationship
Prognostic Values of Individual Markers
FFR and OS were analyzed in univariate fashion with respect to each of the 10 markers individually according to the scoring of each laboratory separately (Figure 3) and according to the consensus determinations of positive and negative staining (Figure 4). Ki-67 was analyzed in a similar fashion by tertiles (upper and middle versus lower), and Rb was analyzed as altered versus wild-type (Figure 3). No marker showed a significant association with the primary end point of FFR except for p21 and EGFR scored by Lab C. Similarly, no association was found between marker positivity and OS except for cyclin D1 in Lab B. We also calculated the hazard ratio (HR) and 95% CI on the log scale for patients with a consensus-positive score compared with those with a consensus-negative score for each marker, as well as for Rb altered compared with Rb wild-type and for high Ki-67 compared with low Ki-67 (Table S1). All confidence intervals cross 1.0 widely, indicating again that there was a lack of association between consensus marker scores and either FFR or OS.
Figure 3: Patient outcome according to marker status.
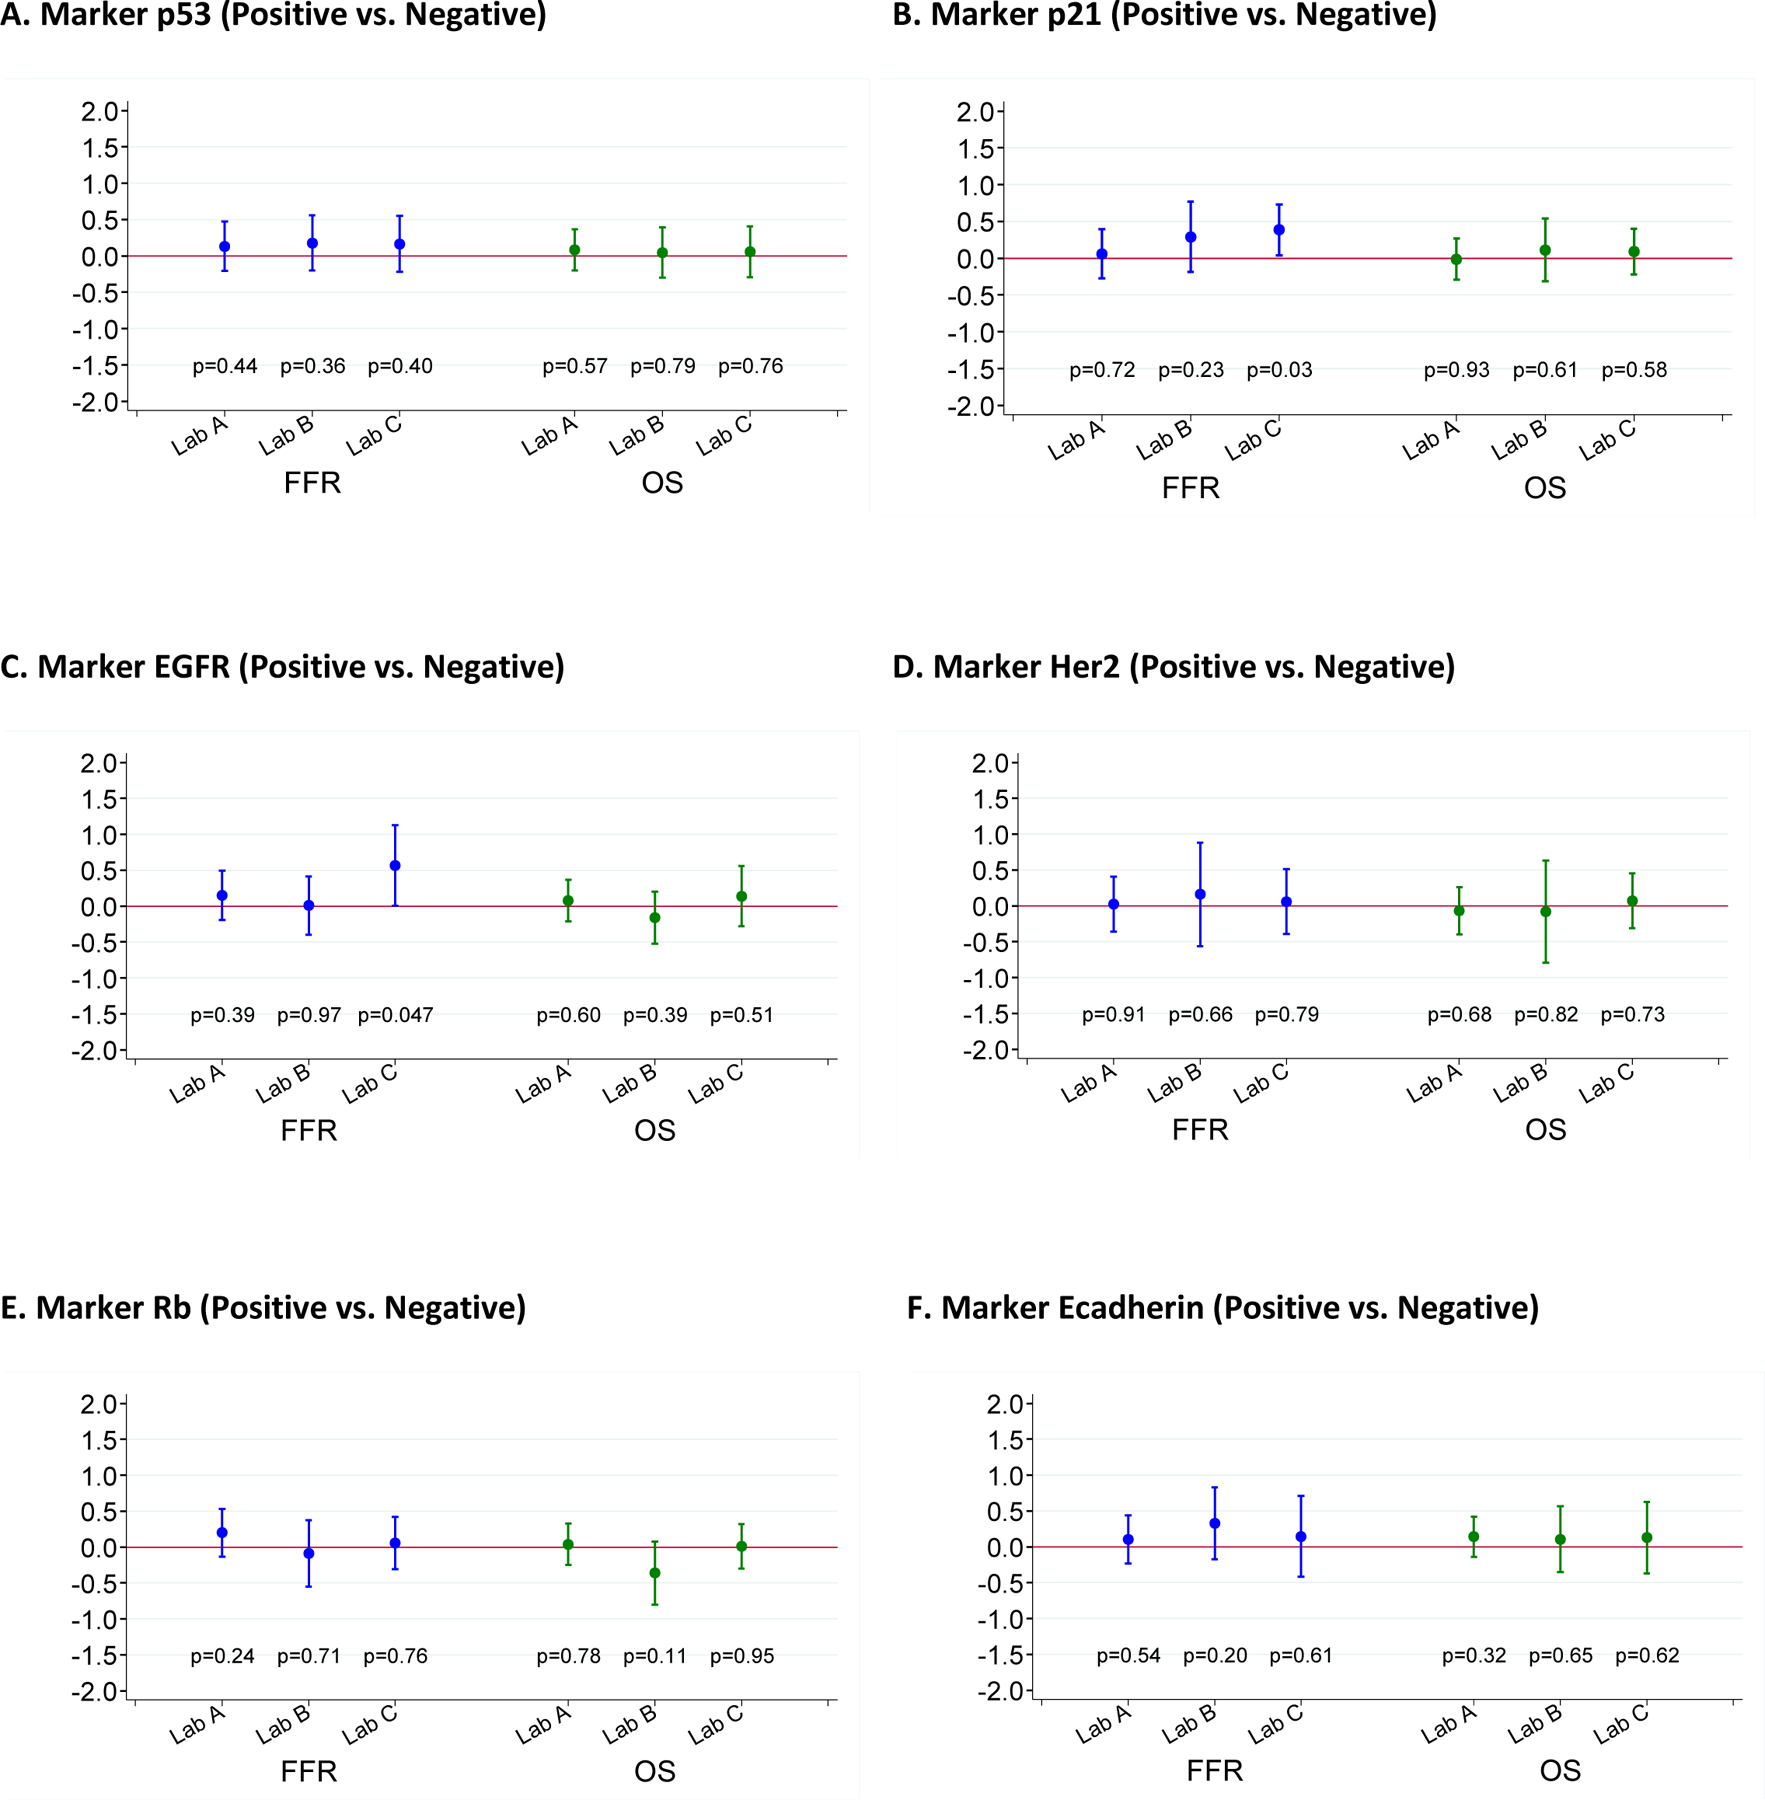
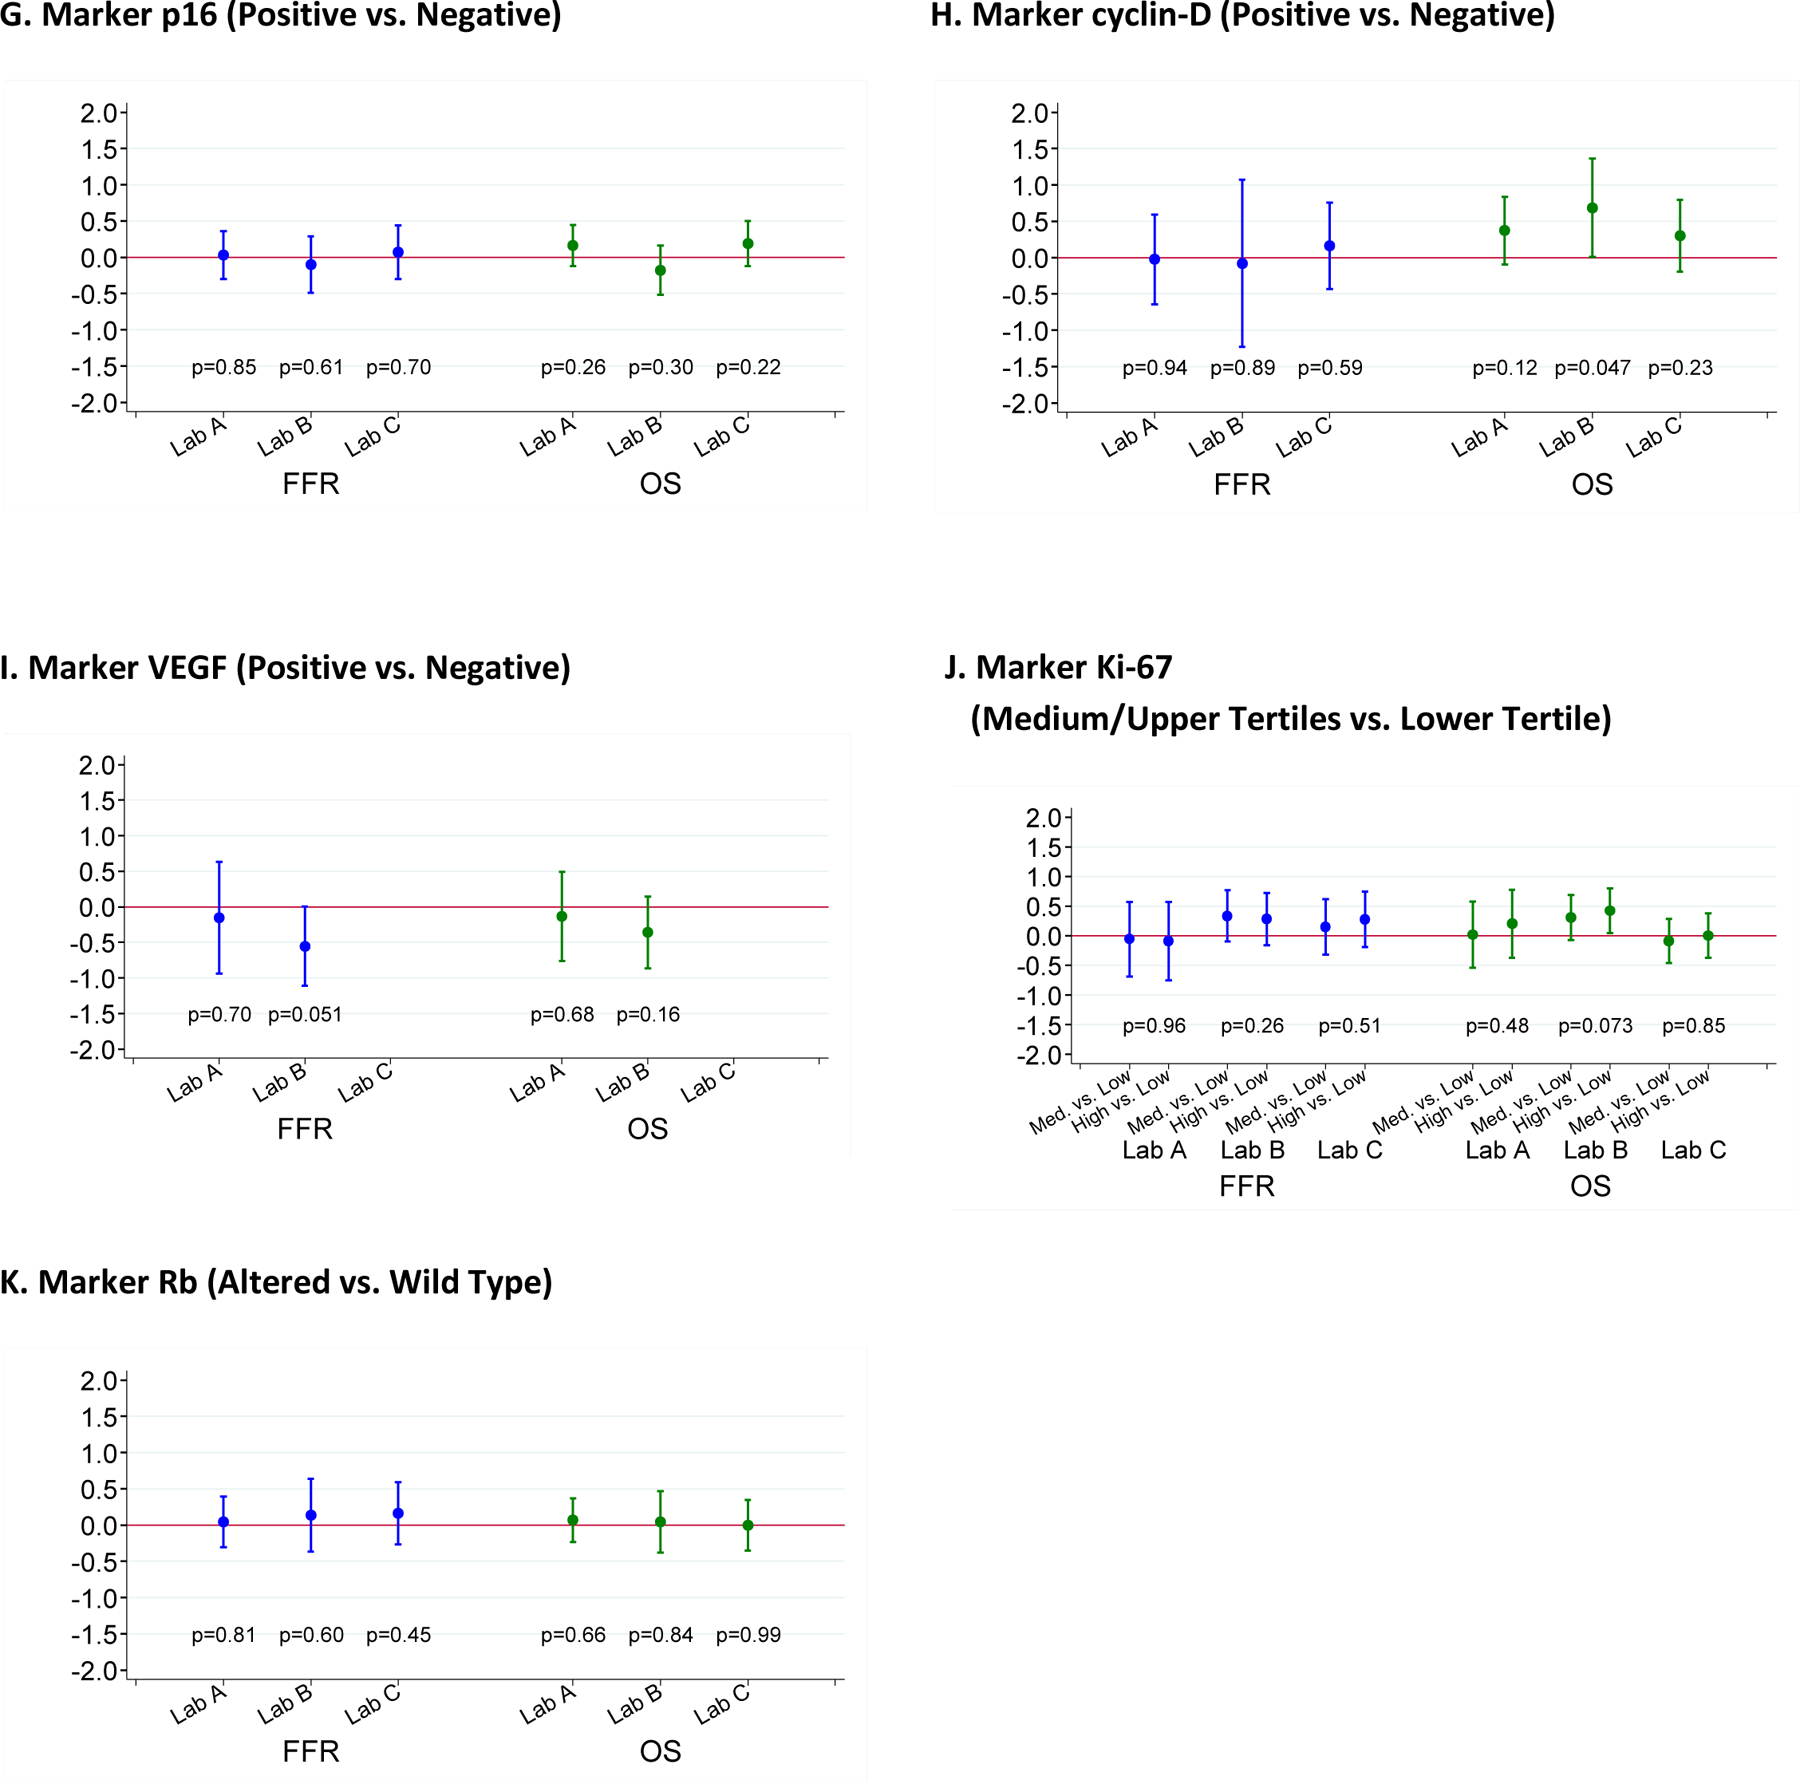
Log of hazard ratios (HR) and 95% confidence intervals for patients scored as marker positive compared to those scored as marker negative. A HR of 0 on the log scale corresponds to a HR of 1, indicating a lack of association. If HR on the log scale is >0 (i.e., HR>1), it indicates that the marker positivity is associated with an unfavorable outcome.
Figure 4: Consensus Analyses.
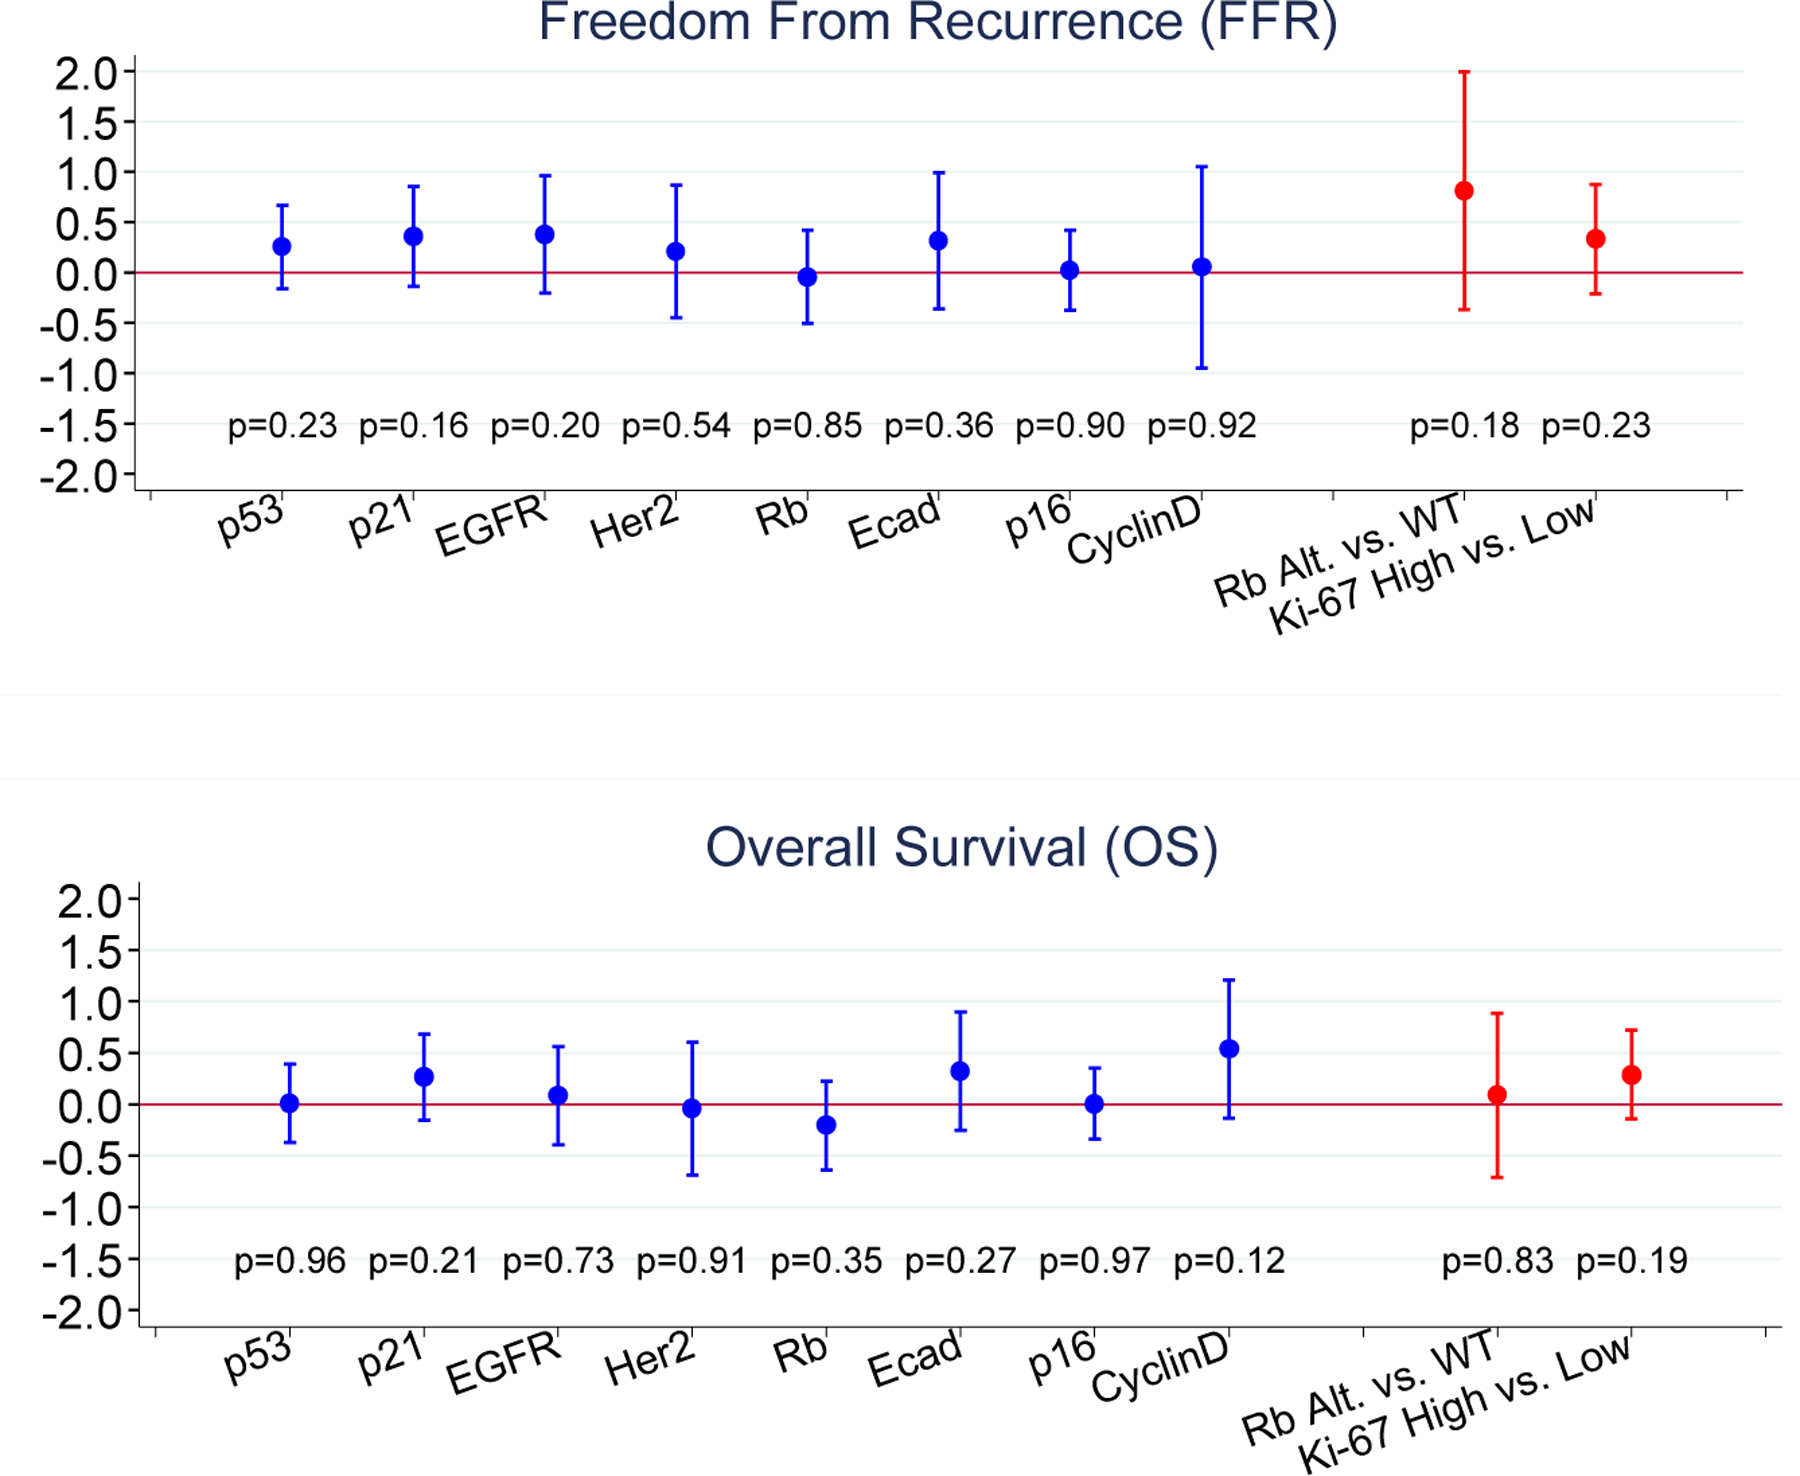
-- Log of hazard ratios and 95% confidence intervals for patients scored as marker positive compared to those scored as marker negative.
Prognostic Values of Marker Panels
Moving beyond single marker analysis, we also determined whether combinations of altered markers correlated to FFR or OS. VEGF and Ki-67 were excluded, and altered was defined as positive staining for the other markers, except for Rb, which was scored as altered or wild-type as described above.
We first investigated whether the 3-marker panel (Rb, p21, and p53) was associated with FFR or OS. When looking at data from each laboratory separately, there seemed to be a general trend toward HRs that were <1 (or log of HR <0), indicating that patients with fewer markers altered tended to have better outcomes than did those with all 3 markers altered (Figure 5A–C, Fig. S2A–C). However, none of these associations reached statistical significance (p <0.05). An analysis of combined results from the three laboratories in form of consensus scores was severely limited by the small number of samples (n=41) for which a consensus could be determined, so that these results are essentially uninformative (Figure 5D, Figure S2D).
Figure 5: Freedom from recurrence stratified by the number of altered markers in a panel of three cell cycle regulators (Rb, p21 and p53).
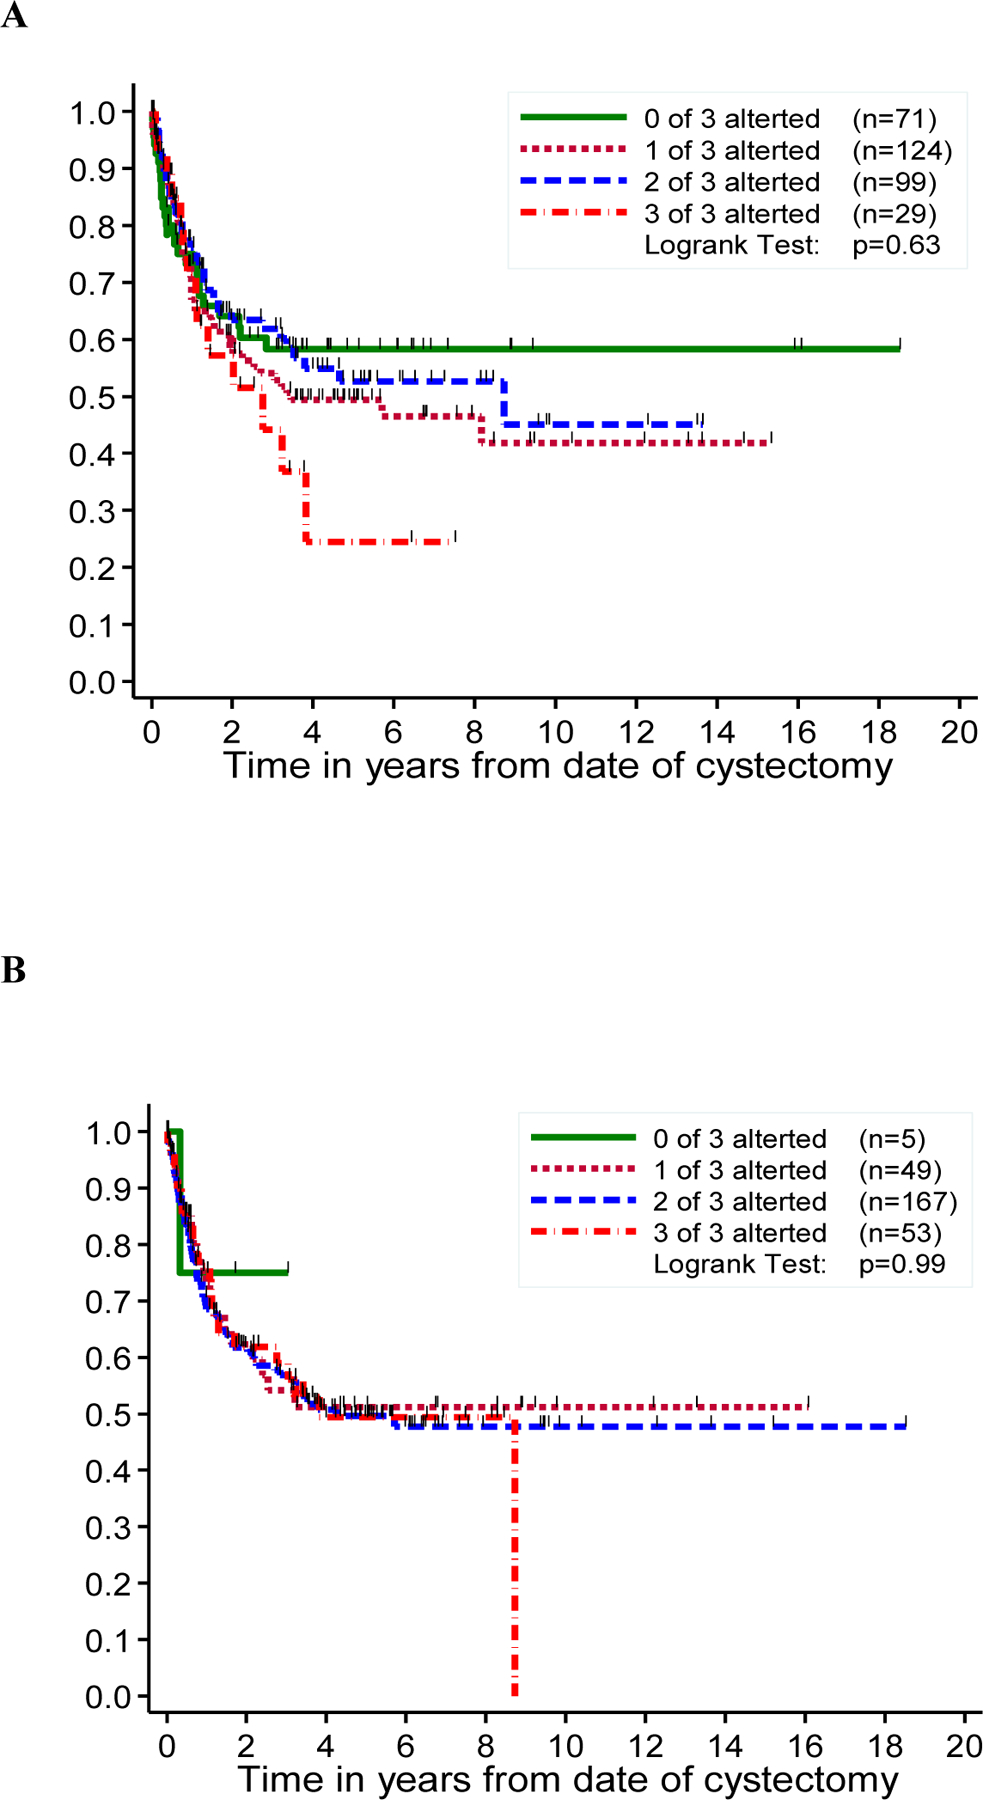
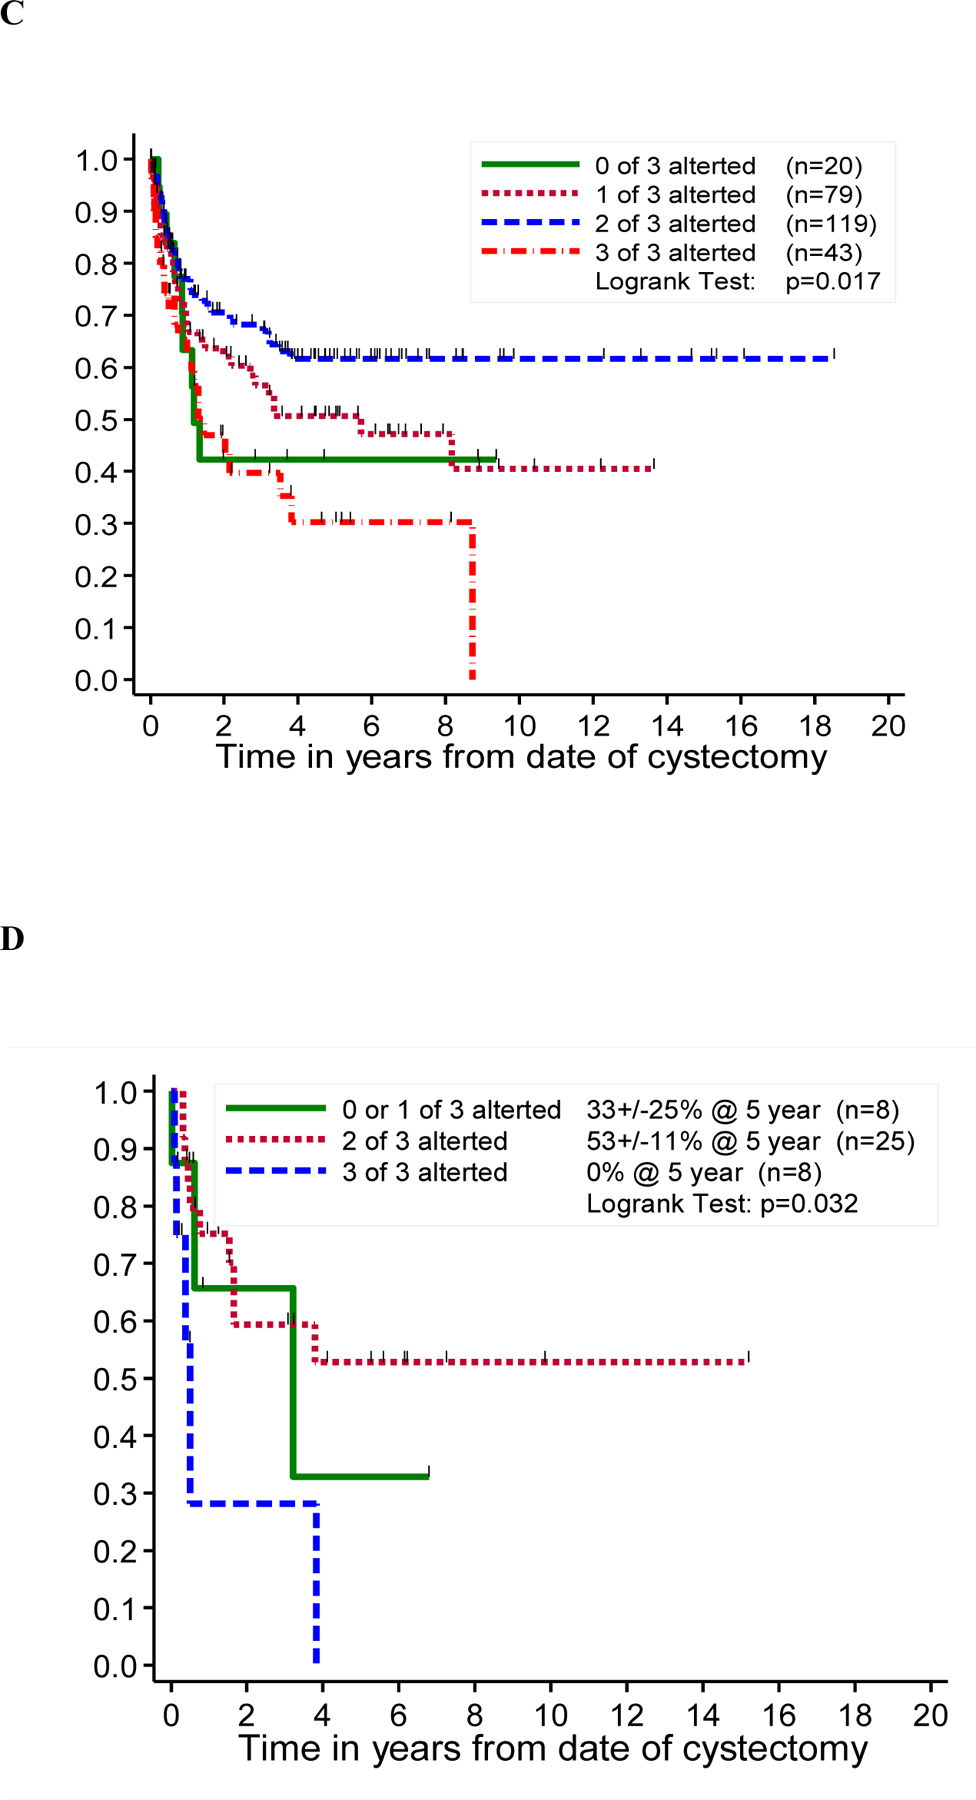
Kaplan-Meier curve depicting freedom from recurrence (FFR) by the number of altered markers (Rb, p21 and p53), in Lab A (A), Lab B (B), Lab C (C) and consensus analysis (D).
We then looked into the association of altered markers and FFR or OS based on an 8-marker panel including: p53, p21, p16, Rb, cyclin D1, E-cad, EGFR, and HER2. For the 8-marker panel, the proportion of altered markers was stratified as low, intermediate and high. The log of HRs and the 95% CIs were calculated for patients with a low or intermediate proportion of markers altered compared with patients with a high proportion of markers altered, for FFR and OS, respectively. There was no clear pattern in the relationship between the proportion of markers altered and FFR or OS when looking at data from each laboratory separately or when combining the scoring from the three laboratories (Figure S3).
DISCUSSION
The nidus of this project was the United States National Cancer Institute Bladder Cancer Marker Network, which aimed to evaluate the reproducibility of IHC features for measuring p53 expression in bladder tumors.20 This international initiative ended up compiling IHC results from 3,570 individual patients from 26 different studies of p53 alterations in patients with UCB, which was published primarily by the International Bladder Cancer Network (IBCN).21,22 The IBCN subsequently launched this current international collaboration to establish this multi-center bladder cancer TMA, which was funded through the MD Anderson Cancer Center’s Specialized Program of Research Excellence (SPORE) in bladder cancer. This proved to be a successful cooperation and yielded a common TMA derived from 576 patients from 24 different institutions, all with locally advanced (pT3) UCB. As far as we know, this cohort still represents the largest international and interdisciplinary TMA of UCB.
In this project we used the international TMAs to evaluate the prognostic value of 10 predefined putative tumor markers. These markers were chosen based on previous studies showing their clinical significance and based on knowledge of their biological role in UCB.4,23–34 Many of these proteins represent members of the retinoblastoma proliferation pathway (Ki-67, Rb, p53, p21, and cyclin D1). ErbB2 and EGFR are tyrosine receptor kinases that are overexpressed in a large number of bladder tumors, although their clinical significance is controversial.35 E-cadherin, which plays a role in cell-cell interactions, is frequently altered in high-stage bladder tumors.36 Finally, VEGF, which has a role in angiogenesis and neovascularization, is believed also to have an important role in cell invasion and metastasis.37
The key finding, and a significant limitation, of our study is not the lack of prognostic value of the selected markers, but instead the heterogeneity of the IHC results across three highly experienced centers using standardized staining and scoring protocols, as well as identical antibodies from the same vial. The lack of association of individual markers and even panels of markers with clinical outcomes is likely due in large part to the lack of agreement in the IHC analyses across the three laboratories. Some heterogeneity may have resulted from the use of 30 sections of the TMA which was needed to perform analysis on 10 markers at 3 centers. Use of whole sections, as would usually be done in clinical practice, may also improve the results. Understanding the source of the observed discordance in IHC results will require additional analyses. We did not conduct a central review of all stained TMA slides which could have aided in determining what proportion of the interobserver variability was due to the scoring itself. We observed the most consistent results using the markers that are most commonly used in clinical practice (e.g. p53, p16, cyclinD1 and HER2), suggesting that experience with staining methods and interpretation is important to reduce variability. Furthermore, alternative scoring methods such as the scoring systems for estrogen receptor (for markers with nuclear staining), and HER2 (for markers with membranous staining) might reduce interobserver variability.
There is no real consensus of what “good agreement” is. Nonetheless, magnitude guidelines have appeared in the literature. Landis and Koch 38 characterized values of <0% as indicating no agreement, 0%–20% as slight, 21%–40% as fair, 41%–60% as moderate, 61%–80% as substantial, and 81%–100% as almost perfect agreement. This set of guidelines, however, is based on expert opinion and is not universally accepted. Equally arbitrary guidelines by Fleiss characterize kappa values of >75% as excellent, 40% to 75% as fair to good, and <40% as poor.39
A previous study showed considerable inter-laboratory differences in the intensity and percentage of Ki67 nuclear staining, suggesting that antigen retrieval or staining techniques are predominantly responsible for the inter-laboratory variability, and the cut-off levels for distinguishing prognostic subgroups appear to have limited reproducibility in a multi-center approach.40 Regardless of the nuances of cut-offs, the level of agreement between laboratories suggests that there is further work to be done to determine the “true” status of an IHC marker. One approach to this, utilized by Esrig et al for p53, is to demonstrate the association of the scoring of a molecular marker with gene status2.
IHC remains a frequently utilized and reliable tool in tissue diagnosis. Many independent single institution and multi-institutional studies have clearly shown that alterations in cell cycle regulatory proteins are independent predictors of UCB clinical outcome2–4,7–10,12–15,21–29,33. However, our results clearly demonstrate that routine use of prognostic markers where the IHC results have not been independently correlated with gene status and outcome remains problematic, with poor reproducibility. Another potential problem of the present study is that it focused on locally advanced (pT3) UCB, while the primary impact on prognosis, especially for cell cycle regulatory proteins, is in early stage invasive (pT1–2) disease3,12,14,15. Thus, the full potential of prognostic/predictive markers in UCB has yet to be realized, and is deserving of further study. This may gain renewed interest in the current era of molecular subtyping, where several groups have suggested IHC staining as an inexpensive and pragmatic substitute for transcriptomic analysis.41,42
There is no question that IHC for specific markers is firmly established in the clinical management of defined patient populations with cancer in different organ sites. Efforts to enhance the performance and reproducibility of IHC include automated quantitative analysis and machine learning with application of artificial intelligence algorithms43. Furthermore, multiplex assays measuring multiple markers on one tissue section may overcome the heterogeneity between sections and allow for co-localization studies, which are particularly important for immune markers44. Advanced technologies, including especially next generation sequencing, are entering clinical practice, for example for FGFR testing in advanced bladder cancer or for measuring total mutational burden. Next generation sequencing is critical for evaluating some of the same markers we have assessed by IHC, including especially p53, Rb and HER2 (ErbB2). These assays are able to move from tissue to circulating tumor DNA and circulating tumor cells, which allow longitudinal assessment of the molecular landscape of the tumor in response to therapy, and may help overcome limitations of intra- and intertumor heterogeneity45.
CONCLUSION
A panel of 10 established oncogenes and tumor suppressor genes in UCB failed to provide prognostic information in a large international cohort of patients with locally advanced (pT3) UCB, either alone or in combination. The analysis did, however, provide valuable insight into interlaboratory differences in IHC analysis of common prognostic markers. This highlights the need to standardize the IHC staining of these and other biomarkers for UCB. This remains particularly pertinent with ongoing studies of PD-L1 IHC as a predictive marker for treatment with immune checkpoint inhibitors.
Supplementary Material
Highlights.
Expression p53, Rb and p21 was associated with outcome after cystectomy
The fraction of markers altered in an 8-marker panel did not correlate with outcome
IHC score agreement between 3 laboratories for 10 cell cycle markers was poor
Acknowledgement:
This project was supported by NIH/NCI Cancer Center Core Grant P30CA16672 and the GU Bladder Cancer SPORE CA91846 (NCI). Support was also received by the NCI Bladder Marker Network U01CA070903, and the NCI p53/MVAC Trial R01CA071921
Footnotes
Publisher's Disclaimer: This is a PDF file of an unedited manuscript that has been accepted for publication. As a service to our customers we are providing this early version of the manuscript. The manuscript will undergo copyediting, typesetting, and review of the resulting proof before it is published in its final form. Please note that during the production process errors may be discovered which could affect the content, and all legal disclaimers that apply to the journal pertain.
REFERENCES
- 1.Shariat SF, Karakiewicz PI, Palapattu GS, et al. Outcomes of radical cystectomy for transitional cell carcinoma of the bladder: A contemporary series from the bladder cancer research consortium. Journal of Urology. 2006;176(6):2414–2422. [DOI] [PubMed] [Google Scholar]
- 2.Esrig D, Spruck CH 3rd, Nichols PW, et al. p53 nuclear protein accumulation correlates with mutations in the p53 gene, tumor grade, and stage in bladder cancer. The American journal of pathology. 1993;143(5):1389–1397. [PMC free article] [PubMed] [Google Scholar]
- 3.Esrig D, Elmajian D, Groshen S, et al. Accumulation of nuclear p53 and tumor progression in bladder cancer. The New England journal of medicine. 1994;331(19):1259–1264. [DOI] [PubMed] [Google Scholar]
- 4.Cote RJ, Esrig D, Groshen S, Jones PA, Skinner DG. p53 and treatment of bladder cancer. Nature. 1997;385(6612):123–124. [DOI] [PubMed] [Google Scholar]
- 5.Stadler WM, Lerner SP, Groshen S, et al. Phase III study of molecularly targeted adjuvant therapy in locally advanced urothelial cancer of the bladder based on p53 status. Journal of clinical oncology : official journal of the American Society of Clinical Oncology. 2011;29(25):3443–3449. [DOI] [PMC free article] [PubMed] [Google Scholar]
- 6.Shariat SF, Karakiewicz PI, Ashfaq R, et al. Multiple biomarkers improve prediction of bladder cancer recurrence and mortality in patients undergoing cystectomy. Cancer. 2008;112(2):315–325. [DOI] [PubMed] [Google Scholar]
- 7.Shariat SF, Chade DC, Karakiewicz PI, et al. Combination of Multiple Molecular Markers Can Improve Prognostication in Patients With Locally Advanced and Lymph Node Positive Bladder Cancer. Journal of Urology. 2010;183(1):68–75. [DOI] [PubMed] [Google Scholar]
- 8.Lotan Y, Bagrodia A, Passoni N, et al. Prospective Evaluation of a Molecular Marker Panel for Prediction of Recurrence and Cancer-specific Survival After Radical Cystectomy. European Urology. 2013;64(3):465–471. [DOI] [PubMed] [Google Scholar]
- 9.Kriegmair MC, Balk M, Wirtz R, et al. Expression of the p53 Inhibitors MDM2 and MDM4 as Outcome Predictor in Muscle-invasive Bladder Cancer. Anticancer Research. 2016;36(10):5205–5213. [DOI] [PubMed] [Google Scholar]
- 10.Tian YJ, Ma ZM, Chen ZH, et al. Clinicopathological and Prognostic Value of Ki-67 Expression in Bladder Cancer: A Systematic Review and Meta-Analysis. Plos One. 2016;11(7). [DOI] [PMC free article] [PubMed] [Google Scholar]
- 11.Robertson AG, Kim J, Al-Ahmadie H, et al. Comprehensive Molecular Characterization of Muscle-Invasive Bladder Cancer. Cell. 2017;171(3):540–556 e525. [DOI] [PMC free article] [PubMed] [Google Scholar]
- 12.Stein JP, Ginsberg DA, Grossfeld GD, et al. Effect of p21WAF1/CIP1 expression on tumor progression in bladder cancer. Journal of the National Cancer Institute. 1998;90(14):1072–1079. [DOI] [PubMed] [Google Scholar]
- 13.Chatterjee SJ, George B, Goebell PJ, et al. Hyperphosphorylation of pRb: a mechanism for RB tumour suppressor pathway inactivation in bladder cancer. The Journal of pathology. 2004;203(3):762–770. [DOI] [PubMed] [Google Scholar]
- 14.Cote RJ, Dunn MD, Chatterjee SJ, et al. Elevated and absent pRb expression is associated with bladder cancer progression and has cooperative effects with p53. Cancer research. 1998;58(6):1090–1094. [PubMed] [Google Scholar]
- 15.Chatterjee SJ, Datar R, Youssefzadeh D, et al. Combined effects of p53, p21, and pRb expression in the progression of bladder transitional cell carcinoma. Journal of clinical oncology : official journal of the American Society of Clinical Oncology. 2004;22(6):1007–1013. [DOI] [PubMed] [Google Scholar]
- 16.Grossman HB, Dinney CPN, Schmitz-Drager BJ, Goebell PJ. The International Bladder Cancer Network. Urologic Oncology-Seminars and Original Investigations. 2010;28(4):375–376. [DOI] [PubMed] [Google Scholar]
- 17.Kononen J, Bubendorf L, Kallioniemi A, et al. Tissue microarrays for high-throughput molecular profiling of tumor specimens. Nature Medicine. 1998;4(7):844–847. [DOI] [PubMed] [Google Scholar]
- 18.Eble JN, Sauter G, Epstein JI, Sesterhenn IA, eds. WHO Classification of Tumours of the Urinary System and Male Genital Organs. 3th ed. Lyon: International Agency for Research on Cancer (IARC); 2004. Kleihues P, Sobin LH, eds. World Health Organization Classification of Tumours. [Google Scholar]
- 19.Edge SB, Fritzen AG, Byrd DR, Greene FL, Compton CC, Trotti A, eds. AJCC Cancer Staging Manual. 7th ed 2010.
- 20.McShane LM, Aamodt R, Cordon-Cardo C, et al. Reproducibility of p53 immunohistochemistry in bladder tumors. Clinical Cancer Research. 2000;6(5):1854–1864. [PubMed] [Google Scholar]
- 21.Schmitz-Drager BJ, Goebell PJ, Heydthausen M, Isbc. p53 immunohistochemistry in bladder cancer - Combined analysis: a way to go? Urologic Oncology. 2000;5(5):204–210. [DOI] [PubMed] [Google Scholar]
- 22.Goebell PJ, Groshen SG, Schmitz-Drager BJ, Canc IS-IB. p53 immunohistochemistry in bladder cancer-a new approach to an old question. Urologic Oncology-Seminars and Original Investigations. 2010;28(4):377–388. [DOI] [PubMed] [Google Scholar]
- 23.Sarkis AS, Dalbagni G, Cordoncardo C, et al. Nuclear Overexpression of P53-Protein in Transitional Cell Bladder-Carcinoma - a Marker for Disease Progression. Journal of the National Cancer Institute. 1993;85(1):53–59. [DOI] [PubMed] [Google Scholar]
- 24.Sarkis AS, Bajorin DF, Reuter VE, et al. Prognostic Value of P53 Nuclear Overexpression in Patients with Invasive Bladder-Cancer Treated with Neoadjuvant Mvac. Journal of Clinical Oncology. 1995;13(6):1384–1390. [DOI] [PubMed] [Google Scholar]
- 25.Logothetis CJ, Xu HJ, Ro JY, et al. Altered Expression of Retinoblastoma Protein and Known Prognostic Variables in Locally Advanced Bladder-Cancer. Journal of the National Cancer Institute. 1992;84(16):1256–1261. [DOI] [PubMed] [Google Scholar]
- 26.Cordon Cardo C, Wartinger D, Petrylak D, et al. Altered Expression of the Retinoblastoma Gene-Product - Prognostic Indicator in Bladder-Cancer. Journal of the National Cancer Institute. 1992;84(16):1251–1256. [DOI] [PubMed] [Google Scholar]
- 27.Jahnson S, Karlsson MG. Predictive value of p53 and pRb immunostaining in locally advanced bladder cancer treated with cystectomy. Journal of Urology. 1998;160(4):1291–1296. [PubMed] [Google Scholar]
- 28.Mulder AH, Vanhootegem JCSP, Sylvester R, et al. Prognostic Factors in Bladder-Carcinoma - Histologic Parameters and Expression of a Cell Cycle-Related Nuclear Antigen (Ki-67). Journal of Pathology. 1992;166(1):37–43. [DOI] [PubMed] [Google Scholar]
- 29.Sgambato A, Migaldi M, Faraglia B, et al. Cyclin D1 expression in papillary superficial bladder cancer: Its association with other cell cycle-associated proteins, cell proliferation and clinical outcome. International Journal of Cancer. 2002;97(5):671–678. [DOI] [PubMed] [Google Scholar]
- 30.Izawa JI, Slaton JW, Kedar D, et al. Differential expression of progression-related genes in the evolution of superficial to invasive transitional cell carcinoma of the bladder. Oncology Reports. 2001;8(1):9–15. [DOI] [PubMed] [Google Scholar]
- 31.Tetu B, Fradet Y, Allard P, Veilleux C, Roberge N, Bernard P. Prevalence and clinical significance of HER-2/neu, p53 and rb expression in primary superficial bladder cancer. Journal of Urology. 1996;155(5):1784–1788. [PubMed] [Google Scholar]
- 32.Otto T, Birchmeier W, Schmidt U, et al. Inverse Relation of E-Cadherin and Autocrine Motility Factor-Receptor Expression as a Prognostic Factor in Patients with Bladder Carcinomas. Cancer research. 1994;54(12):3120–3123. [PubMed] [Google Scholar]
- 33.Bringuier PP, Umbas R, Schaafsma HE, Karthaus HFM, Debruyne FMJ, Schalken JA. Decreased E-Cadherin Immunoreactivity Correlates with Poor Survival in Patients with Bladder-Tumors. Cancer research. 1993;53(14):3241–3245. [PubMed] [Google Scholar]
- 34.Bochner BH, Cote RJ, Weidner N, et al. Angiogenesis in Bladder-Cancer - Relationship between Microvessel Density and Tumor Prognosis. Journal of the National Cancer Institute. 1995;87(21):1603–1612. [DOI] [PubMed] [Google Scholar]
- 35.Kassouf W, Black PC, Tuziak T, et al. Distinctive expression pattern of ErbB family receptors signifies an aggressive variant of bladder cancer. J Urol. 2008;179(1):353–358. [DOI] [PMC free article] [PubMed] [Google Scholar]
- 36.Baumgart E, Cohen MS, Silva Neto B, et al. Identification and prognostic significance of an epithelial-mesenchymal transition expression profile in human bladder tumors. Clin Cancer Res. 2007;13(6):1685–1694. [DOI] [PubMed] [Google Scholar]
- 37.Slaton JW, Millikan R, Inoue K, et al. Correlation of metastasis related gene expression and relapse-free survival in patients with locally advanced bladder cancer treated with cystectomy and chemotherapy. J Urol. 2004;171(2 Pt 1):570–574. [DOI] [PubMed] [Google Scholar]
- 38.Landis JR, Koch GG. Measurement of Observer Agreement for Categorical Data. Biometrics. 1977;33(1):159–174. [PubMed] [Google Scholar]
- 39.Davies M, Fleiss JL. Measuring Agreement for Multinomial Data. Biometrics. 1982;38(4):1047–1051. [Google Scholar]
- 40.Mengel M, von Wasielewski R, Wiese B, Rudiger T, Muller-Hermelink HK, Kreipe H. Inter-laboratory and interobserver reproducibility of immunohistochemical assessment of the Ki-67 labelling index in a large multi-centre trial. The Journal of pathology. 2002;198(3):292–299. [DOI] [PubMed] [Google Scholar]
- 41.Dadhania V, Zhang M, Zhang L, et al. Meta-Analysis of the Luminal and Basal Subtypes of Bladder Cancer and the Identification of Signature Immunohistochemical Markers for Clinical Use. Ebiomedicine. 2016;12:105–117. [DOI] [PMC free article] [PubMed] [Google Scholar]
- 42.Sjödahl G Molecular Subtype Profiling of Urothelial Carcinoma Using a Subtype-Specific Immunohistochemistry Panel. In: Schulz W, Hoffmann M, Niegisch G, eds. Urothelial Carcinoma. Methods in Molecular Biology. Vol 1655. Humana Press; 2018:53–64. [DOI] [PubMed] [Google Scholar]
- 43.Nir G, Karimi D, Goldenberg SL, et al. Comparison of Artificial Intelligence Techniques to Evaluate Performance of a Classifier for Automatic Grading of Prostate Cancer From Digitized Histopathologic Images. JAMA Netw Open. 2019;2(3):e190442. [DOI] [PMC free article] [PubMed] [Google Scholar]
- 44.Enfield KSS, Martin SD, Marshall EA, et al. Hyperspectral cell sociology reveals spatial tumor-immune cell interactions associated with lung cancer recurrence. J Immunother Cancer. 2019;7(1):13. [DOI] [PMC free article] [PubMed] [Google Scholar]
- 45.Vandekerkhove G, Struss WJ, Annala M, et al. Circulating Tumor DNA Abundance and Potential Utility in De Novo Metastatic Prostate Cancer. Eur Urol. 2019;75(4):667–675. [DOI] [PubMed] [Google Scholar]
Associated Data
This section collects any data citations, data availability statements, or supplementary materials included in this article.


