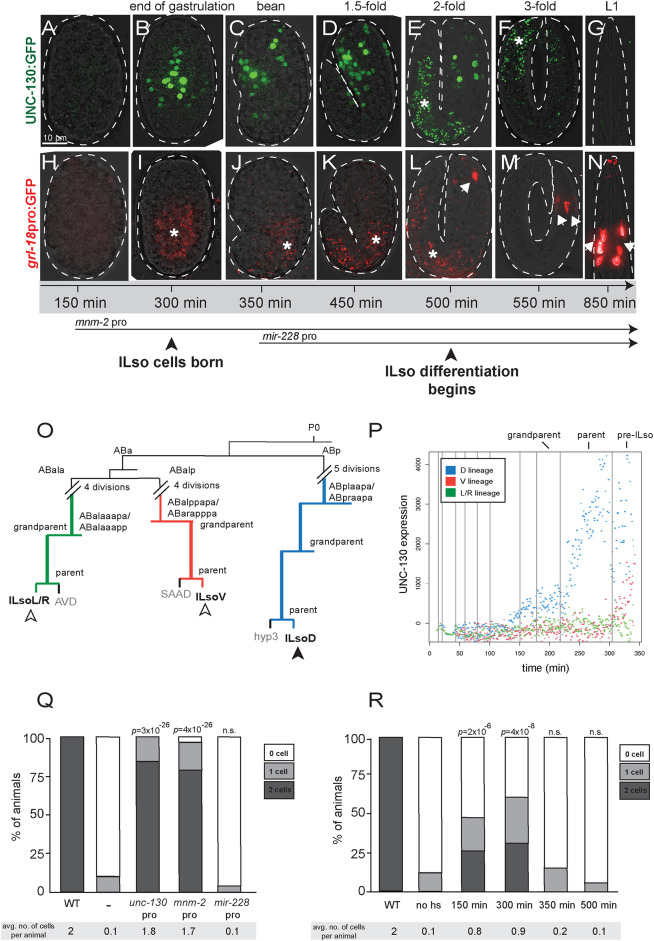
Fig. 3.
UNC-130 is expressed in a restricted lineage before the onset of differentiation. (A-G) Time course of embryos expressing UNC-130:GFP. (H-N) Time course of embryos expressing grl-18pro:GFP (pseudo-colored red). Asterisks indicate gut autofluorescence. Arrows indicate grl-18+ ILso cells. (O) Lineage diagram of a subset of embryonic cell divisions derived from the AB blastomere that gives rise to ILsoD (blue), ILsoV (red) and ILsoL/R (green) glia. (P) Levels of UNC-130:GFP signal in ILsoD (blue), ILsoV (red) and ILsoL/R (green) lineages over developmental time. Vertical lines indicate cell divisions. Subtraction of background fluorescence signal results in negative values for some cells. (Q) Heterologous promoters were used to drive expression of unc-130 in the unc-130 mutant strain, and the extent of rescue was assessed. Timing of mnm-2pro and mir-228pro expression is marked in A. Percentage of animals expressing grl-18pro:YFP in zero, one or two ILsoD glia in each condition. Average number of cells marked per animal is listed under each condition. n=50 animals per condition. P-values were calculated by Fisher's Exact test. (R) unc-130 mutant embryos expressing hsp:unc-130 were heat shocked at different time points and the extent of rescue was assessed. Percentage of animals expressing grl-18pro:YFP in zero, one or two ILsoD glia in each condition. Average number of cells marked per animal is listed under each condition. n=50 animals per condition. P-values were calculated by Fisher's Exact test.

