

Abstract
Objective:
Improving mechanisms to detect adverse drug reactions (ADRs) is key to strengthening post-marketing drug safety surveillance. Signal detection is presently unimodal, relying on a single information source. Multimodal signal detection is based on jointly analyzing multiple information sources. Building on, and expanding the work done in prior studies, the aim of the article is to further research on multimodal signal detection, explore its potential benefits, and propose methods for its construction and evaluation.
Material and Methods:
Four data sources are investigated; FDA’s adverse event reporting system, insurance claims, the MEDLINE citation database, and the logs of major Web search engines. Published methods are used to generate and combine signals from each data source. Two distinct reference benchmarks corresponding to well-established and recently labeled ADRs respectively are used to evaluate the performance of multimodal signal detection in terms of area under the ROC curve (AUC) and lead-time-to-detection, with the latter relative to labeling revision dates.
Results:
Limited to our reference benchmarks, multimodal signal detection provides AUC improvements ranging from 0.04–0.09 based on a widely used evaluation benchmark, and a comparative added lead-time of 7–22 months relative to labeling revision dates from a time-indexed benchmark.
Conclusions:
The results support the notion that utilizing and jointly analyzing multiple data sources may lead to improved signal detection. Given certain data and benchmark limitations, the early stage of development, and the complexity of ADRs, it is currently not possible to make definitive statements about the ultimate utility of the concept. Continued development of multimodal signal detection requires a deeper understanding the data sources used, additional benchmarks, and further research on methods to generate and synthesize signals.
Keywords: drug safety, pharmacovigilance, adverse drug reactions, signal detection, multimodal
Graphical Abstract
1. Introduction
The increasing harm and monetary burden associated with adverse drug reactions (ADRs) has made post-marketing drug safety surveillance (DSS) a top priority for health systems worldwide, and led to new legislative and research initiatives[1–6]. DSS presently relies on analysis of adverse event reports stored in spontaneous reporting systems (SRS)[7, 8] such as the U.S. Food and Drug Administration (FDA) Adverse Event Reporting System (FAERS)[9, 10] and the VigiBase maintained by the World Health Organization (WHO)[11].
The complexity associated with numerous natural phenomena (such as the mechanisms, occurrence, or identification of ADRs) makes it is unlikely that a single information source provides complete knowledge of the phenomenon of interest. In many scientific domains, information about a given phenomenon can be acquired from multiple sources. Each such acquisition framework is referred to as a modality and is associated with one data source[12]. A system that provides access to information from multiple modalities is known as multimodal. The fusion and joint analysis of multiple modalities promises a more unified and global view of the problem at hand, and a solution that is greater than the sum of its parts.
The benefits that may come from multimodality have recently been extended to DSS with the ability to process and analyze new kinds of observational, experimental, and knowledge-based data sources containing pertinent information about the effects, mechanisms, and safety of medical products. Among these data sources are: electronic health records and administrative claims[6, 13–17], the biomedical literature[18–20], social media (e.g., health forums and social networks)[21–24], behavioral data drawn from the logs of search engines[25–27], and mechanistic information extracted from chemical and biological knowledge bases[28]. Together with SRS, each data source promises to provide a unique vantage point for shaping our understanding of a drug’s safety profile, for contributing scientific evidence needed for causal assessment of adverse reactions, and for improving the timeliness of ADR identification.
In recent years, a large amount of research has been conducted on repurposing and analyzing safety information from such data sources, but relatively less progress has been made on development of multimodal approaches to jointly analyze the information provided by each data source.
A core component of DSS is ADR detection, and use of computational techniques known as signal detection are among its primary facilitators. These techniques enable drug safety researchers to analyze large volumes of data and generate hypotheses (signals) of new post-approval ADRs. Upon review, strong signals may lead to regulatory interventions such as drug withdrawals and the issuance of public warnings. From a technical standpoint, signal detection consists of applying computational methodologies to large databases in order to identify unexpected associations between drugs and potential adverse reactions[10].
Prior studies have demonstrated that pair-wise combinations of safety signals from several sources with FAERS can improve the accuracy of signal detection. Examples of signals that have been combined with those from FAERS include signals from EHRs[29, 30], claims data[31], biomedical literature[32], chemical data[33], and Internet search logs[25]. Additional studies with less focus on signaling considered other forms of joint analysis of safety data[34, 35].
The aim of this article is to strengthen empirical support for multimodal signal detection and provide additional insights on its performance characteristics. Building on, and extending the work performed in prior studies, we consider the joint analysis of more than just two data sources, and investigate a larger number of methods to synthesize signal statistics. Rather than relying on a single benchmark of well-known ADRs, we extend the evaluation with an additional benchmark of relatively new ADRs, and importantly, we incorporate the time aspect of signal detection into our performance evaluation. In doing so we propose new performance indices that blend both the accuracy of detection and the lead-time-to-detection.
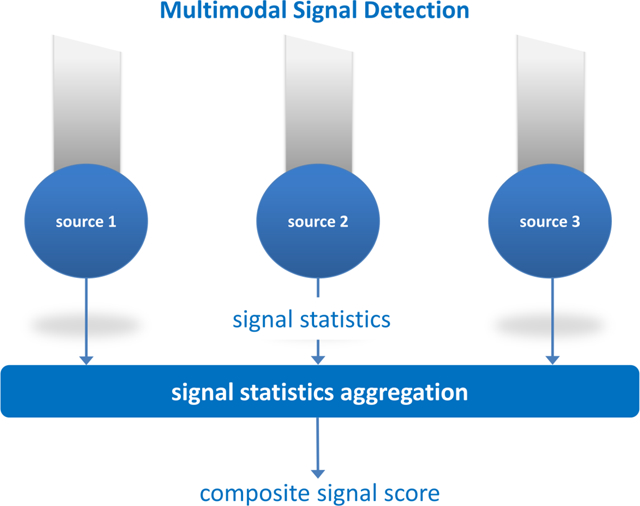
We envision a multimodal signal detection system as one which pools and aggregates signal statistics from multiple data sources to produce a composite signal statistic (Figure 1). In characterizing such a system, we examine four data sources, including three representative sources that would likely play a significant role in future systems, and a fourth novel, yet non-standard source that demonstrates promise. We use FDA’s FAERS as a representative of SRS. As healthcare data we use a large database of administrative claims from millions of U.S. patients. The U.S. National Library of Medicine® (NLM) MEDLINE® citation database[36] serves as a source of biomedical literature, and health-related queries captured in the logs of major Web search engines are used as a source of consumer behavioral data.
Figure 1.
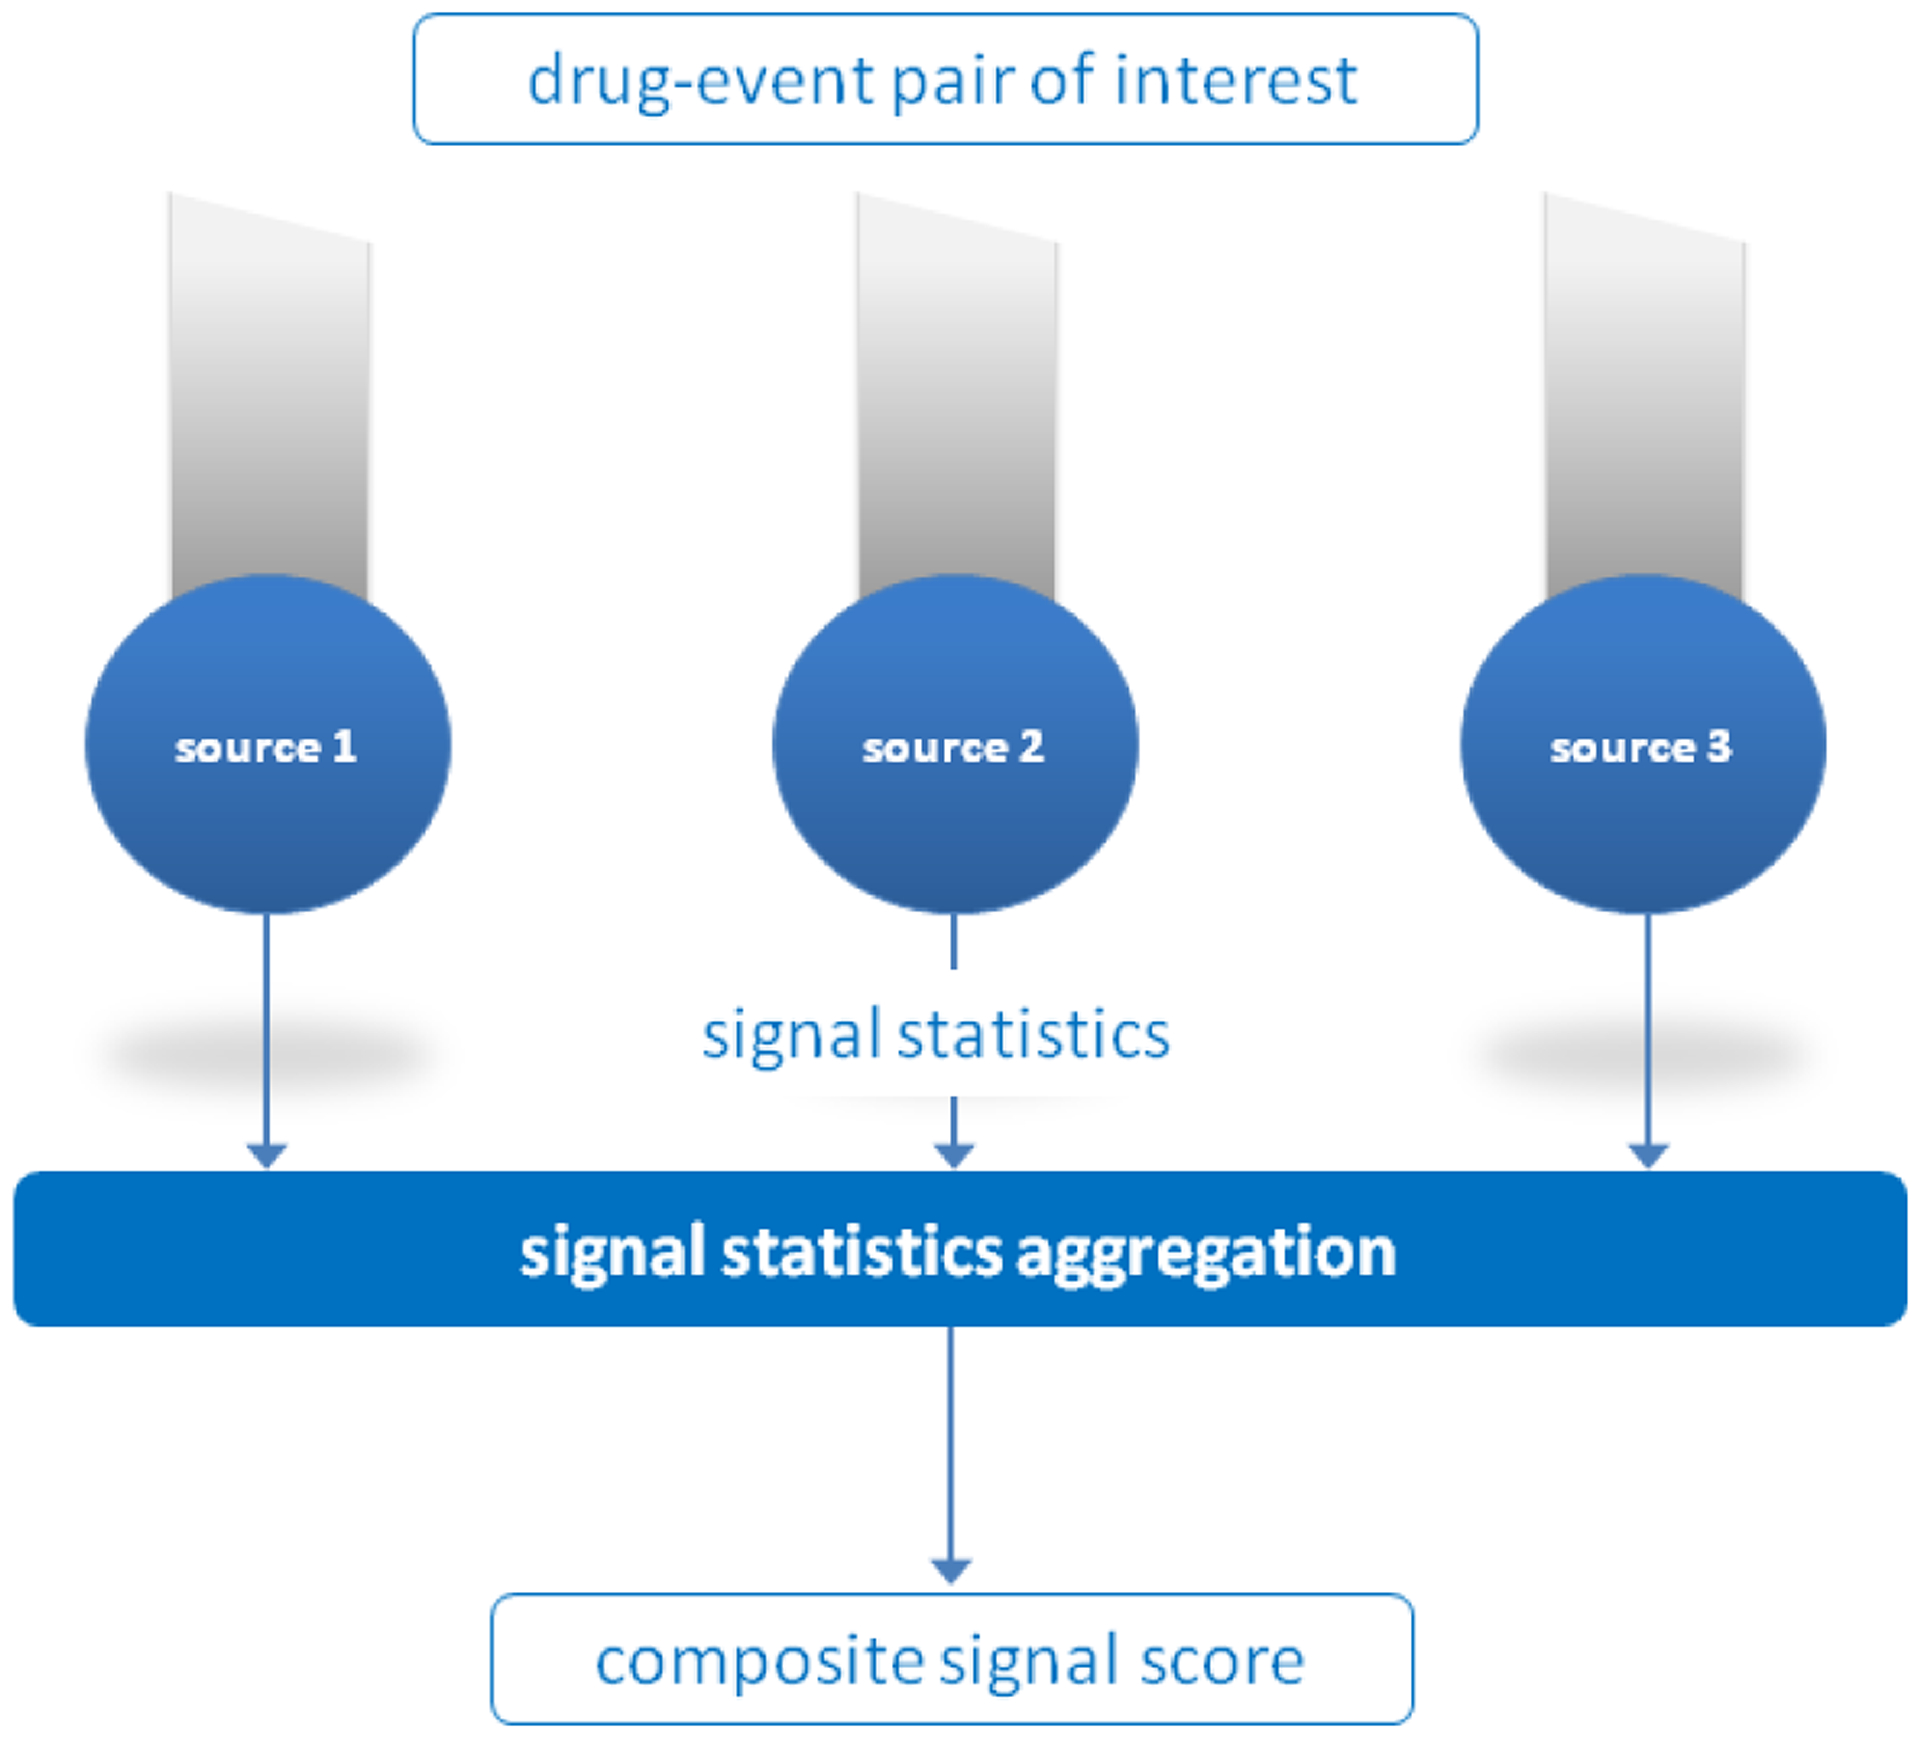
Architecture of a multimodal signal detection system. Signal statistics are pooled and aggregated from different data sources to produce a composite signal statistic.
Published methods are used to process and generate safety signals from each data source individually, and a range of recognized statistical approaches is investigated to transform signal statistics from each data source into a composite signal score. Performance is assessed through the use of both the retrospective and backdated prospective evaluation strategies, which are based on reference benchmarks made of well-established ADRs and recently labeled ADRs respectively.
2. Material and methods
2.1. Data Sources
The FAERS data consists of approximately six million reports collected by the FDA since the inception of the system (1968) to 2014Q2[37]. The reports were preprocessed to correct reporting artifacts and were made available by Oracle Health Sciences.
Analysis of healthcare data was made possible through the Innovation in Medical Evidence Development and Surveillance Research Laboratory[38], which provides a secure computing environment, research tools, and five de-identified healthcare datasets for analysis. Of these datasets, we used the largest dataset called ‘MarketScan Commercial Claims and Encounters’, containing administrative claims from a privately insured U.S. population of approximately 142 million patients spanning the years 2003–2013 (inclusive).
Analysis of NLM’s Medical Subject Headings (MeSH®)[39] descriptors was used to generate signals from MEDLINE bibliographic citations spanning the period from 1968 to May 2014. The algorithms for computationally identifying and extracting MEDLINE MeSH terms associated with ADRs are described by Winnenburg et al.[20]. The process resulted in approximately 360,000 ADR-related article citations and approximately 500,000 unique drug-event pairs potentially associated as ADRs, which were supplied along with other article metadata by the NLM.
De-identified search queries submitted to the Google, Bing, and Yahoo search engines by 80 million users during the period 2011–2013 were analyzed to generate signals based on behavioral data. This data source was accessed in collaboration with Microsoft Research, and described by White et al.[25]
2.2. Benchmarks
Our retrospective performance evaluation uses the Observational Medical Outcomes Partnership (OMOP) benchmark[40]. The OMOP benchmark consists of 399 unique drug-event pairs (test cases) of which 165 represent established true ADRs and 234 represent negative controls—pairs that are highly unlikely to be associated. Each pair is made of one of 181 drugs, and one of four serious adverse events (acute myocardial infarction, acute renal failure, acute liver injury, and upper gastrointestinal bleeding). 40 potentially misclassified negative controls were omitted from the benchmark as recommended by Hauben et al.[41] The OMOP benchmark was designed for retrospective evaluations, in which all data available from a given data source is typically used to evaluate historical associations.
Our backdated prospective performance evaluation uses the time-indexed benchmark[42], which is derived from drug labeling revisions issued by the FDA throughout the year 2013. The benchmark includes 62 positive test cases that represent recently labeled ADRs, and 75 negative controls. It covers 44 drugs and 38 adverse events ranging from mild to rare and serious. Each positive test case is time-stamped with the date on which the underlying ADR was added to the label.
The drugs in each of the benchmarks are specified by RxNorm[43] main ingredients, whereas each event in the benchmarks is defined by a set of MedDRA[44] preferred terms (PTs). To identify drug and event occurrences in each data source, the drugs and events from our benchmarks were mapped to the underlying vocabulary used by each data source, e.g, ATC[45] and MedDRA (FAERS), RxNorm and SNOMED CT®[46] (claims), and MeSH descriptors or supplementary concept records (MEDLINE). For our claims and MEDLINE data the mapping included an expansion to children terms. A data source record was tagged with a given event if it contained a mapped term that corresponds to any of event’s defining MedDRA PTs. The process for identifying drug and event occurrences in our search logs was similar, with the inclusion event symptoms and a mapping to consumer level terminology[25].
2.3. Signal statistics
As our core signal statistic we use a Bayesian smoothed observed-to-expected ratio. This signal statistic is computed for each combination of test case, analysis period, and data source being evaluated, and is defined as
| (1) |
where N denotes the observed co-occurrence rate of a particular drug-event pair (test case), E its expected rate (under certain conditions), c a normalizing factor, and α a smoothing parameter. This ratio corresponds to the posterior expectation of a Gamma-Poisson model of counts, and forms the basis of several routinely applied Bayesian signal detection algorithms for SRS including those of both the WHO[47, 48] and the FDA[9, 10, 49]. For example, the commonly cited IC statistic[48] originally proposed by the WHO is equivalent to the log2 of this ratio with c=1, α=0.5. The Bayesian nature of this ratio provides the benefits of smoothing (shrinkage) and imputation.
Signal statistics for FAERS and MEDLINE were generated based on eq. 1 directly. For our claims and search logs data signals were generated by the self-controlled cohort (SCC) method developed by the OMOP[50], and the method described by White et al.[25] respectively. The signals produced by these two methods were then cast to the ratio of eq. 1, thus enabling the use of a uniform signal statistic across all data sources. The suggested value α=0.5 was used throughout our study. Table 1 provides additional details about the calculation of signal statistics from each data source.
Table 1.
Description of signal statistics (observed to expected ratios) generated from each data source
| Modality | Parameters | Method Description |
|---|---|---|
| FAERS | c=1, α=0.5 | N corresponds to number of spontaneous reports containing both the drug and event investigated. E corresponds to a stratified expected count under the assumption of independence (providing some level of confounding control). The stratification is done by age (9 categories), gender, and year of report. The method produces a disproportionality statistic equivalent to exponential (2x) of the IC statistic developed by the WHO[48], and thus is fundamentally the same method. The widely applied MGPS[49] method provided essentially equivalent performance (for this study), but its calculation diverges from the consistent formulation chosen for this study. |
| Claims | c=tN/tE, α=0.5 | SCC[50] represents a ‘self-controlled’ study design, wherein subjects serve as their own controls by comparing outcome rates for periods when a subject is exposed to a drug to periods when the subject is unexposed to the drug, thus providing a mechanism to account for time-invariant confounding factors. In SCC N represents the total number of outcomes (events) recorded for patients in a database, which occur within pre-defined exposure windows (time at risk), and tN is the sum of the number of days in these exposure windows. E and tE are the equivalent quantities for the comparator group (same patients for unexposed periods). Averaged across the four OMOP events, SCC was found to be the best performing method[51]. |
| MEDLINE | c=1, α=0.5 | N represents the number of articles including MeSH terms for the drug and event investigated, and E its standard expected value under the independence assumption. No confounding control was applied. |
| Web Logs | c=tN/tE, α=0.5 | Method based on the SRR statistic described by white et al.[25], which is produced by a method similar to SCC. N represents the number of unique users that queried for the drug and event of interest within a pre-defined time period tN after the first query for the drug of interest, and E and tE are the equivalent quantities prior to the first query for the drug of interest. tN and tE were both set to 60 days. |
The descriptions refer to the observed to expected ratio s=(N+α)/(cE+ α) defined in eq. 1
When no data is observed for the particular test case (N=0), it can be seen from eq. 1 that a signal statistic is imputed for the test case. This allowed the large majority of test cases to be included in our evaluation rather than being unused or misused with trivial values. Test cases whose underlying mapped drug or event were not captured in any of the data sources (E=0) at a given analysis period (e.g., drug approved after the analysis period) were omitted from the analysis period.
For each evaluation category we used the better performing of either the ratio above or the lower 5% limit of its credible interval often used a ‘safer’ alternative[10]. The lower 5% limit of the credible interval is computed using the quantile function of the Gamma distribution (posterior distribution of the Gamma-Poisson model underlying the signal statistics) with shape and rate parameters N + α and cE + α respectively.
2.4. Combining signal statistics
To generate composite signal statistics, we examined two classes of methodologies: those based on predictive algorithms, and those based on different weighted averaging schemes.
The predictive algorithms we investigated included: random forests, logistic regression, support vectors machines, and a methodology we call naive Bayes smoothing developed for this study. The predictors/features used by these methods are the signal statistics s (eq. 1) generated from each data source at the analysis period. The composite signal score produced by these methods represents the probability that a given association is true given the predictors’ values.
The class of methods based on weighted averaging included the arithmetic and geometric averages, the weighted averaging implied by fixed and random effects meta-analysis, and the averaging implied by an earlier method we developed[31]. The averaging was composed of the signal statistics s (eq. 1) generated from each data sources together with their standard errors. Table 2 provides additional details about the methodologies we evaluated.
Table 2.
Methods used to combine signal statistics
| Method | Description |
|---|---|
| Random Forests | Uses the R package ‘randomForest’. Predictors: s1, s2, …, sK. Parameters: ntree=100, mtry=2 (ntree: number of trees in the forest, mtry: number of variables randomly sampled as candidates at each tree split). Uses out-of-sample predictions. |
| Logistic Regression | Uses the R package ‘glm’. Predictors: s1, s2, …, sK. |
| Support Vector Machines | Uses the R package ‘e1071’. Predictors: s1, s2, …, sK. Parameters: kernel=“radial”, method = “C-classification” (for classification vs regression). The remaining parameters were set to their default values. |
| Naive Bayes Smoothing |
Model: P(GT|s1, s2, …, sK) = η∏kP(GT|sk)/P(GT)K−1. η is a normalizing constant st the class conditional probabilities on the LHS sum to 1. P(GT|sk) is obtained by fitting a logistic regression to the set of test case signal statistics generated from data source k. The modal combines these probabilities by assuming that P(s1, s2, …, sK|GT) = ∏k P(sk|GT), hence Naive Bayes. P(GT) was set to the value 0.5. |
| Arithmetic Average | Model: |
| Geometric Average | Model: |
| Fixed Effects |
Model: |
| Random Effects |
Model: , τ2 is estimated using the DerSimonian and Laird method[52]. |
| Empirical Bayes |
Model: , α = τ2/(τ2 + v2), τ2 and θ are estimated via the EM algorithm. |
sk: signal statistic (ratio of eq. 1) produced from data source k for a given association (test case). s1, s2, …, sK : set signal statistics produced from data sources 1 to K for a given association. GT: ground truth assigned to a test case (true/false)
2.5. Retrospective Performance Evaluation
Retrospective performance evaluations were performed by using all data from a given data source up to the end of 2013 to generate signal statistics for each OMOP test case. The area under the receiver operating characteristic curve (AUC), was then used to measure the accuracy of signal detection.
Given that a large proportion of OMOP test cases were directly compiled from the scientific literature via literature review, using the OMOP benchmark to evaluate signals generated from literature derivatives is circular and would lead to fallacious results. Consequently, the MEDLINE modality was not used our retrospective evaluation of multimodal signal detection. The data sources whose signal statistics were combined in our retrospective evaluation include FAERS, our Claims data, and the Web search logs.
2.6. Backdated Prospective Performance Evaluation
In our backdated evaluations we use all data available from a given data source up to a pre-specified time point that is prior to an ADR’s index date (Figure 2). We define lead time as the time interval between signal detection and a ADR’s index date, and use the date on which the underlying ADR was added to the label as its index date.
Figure 2.
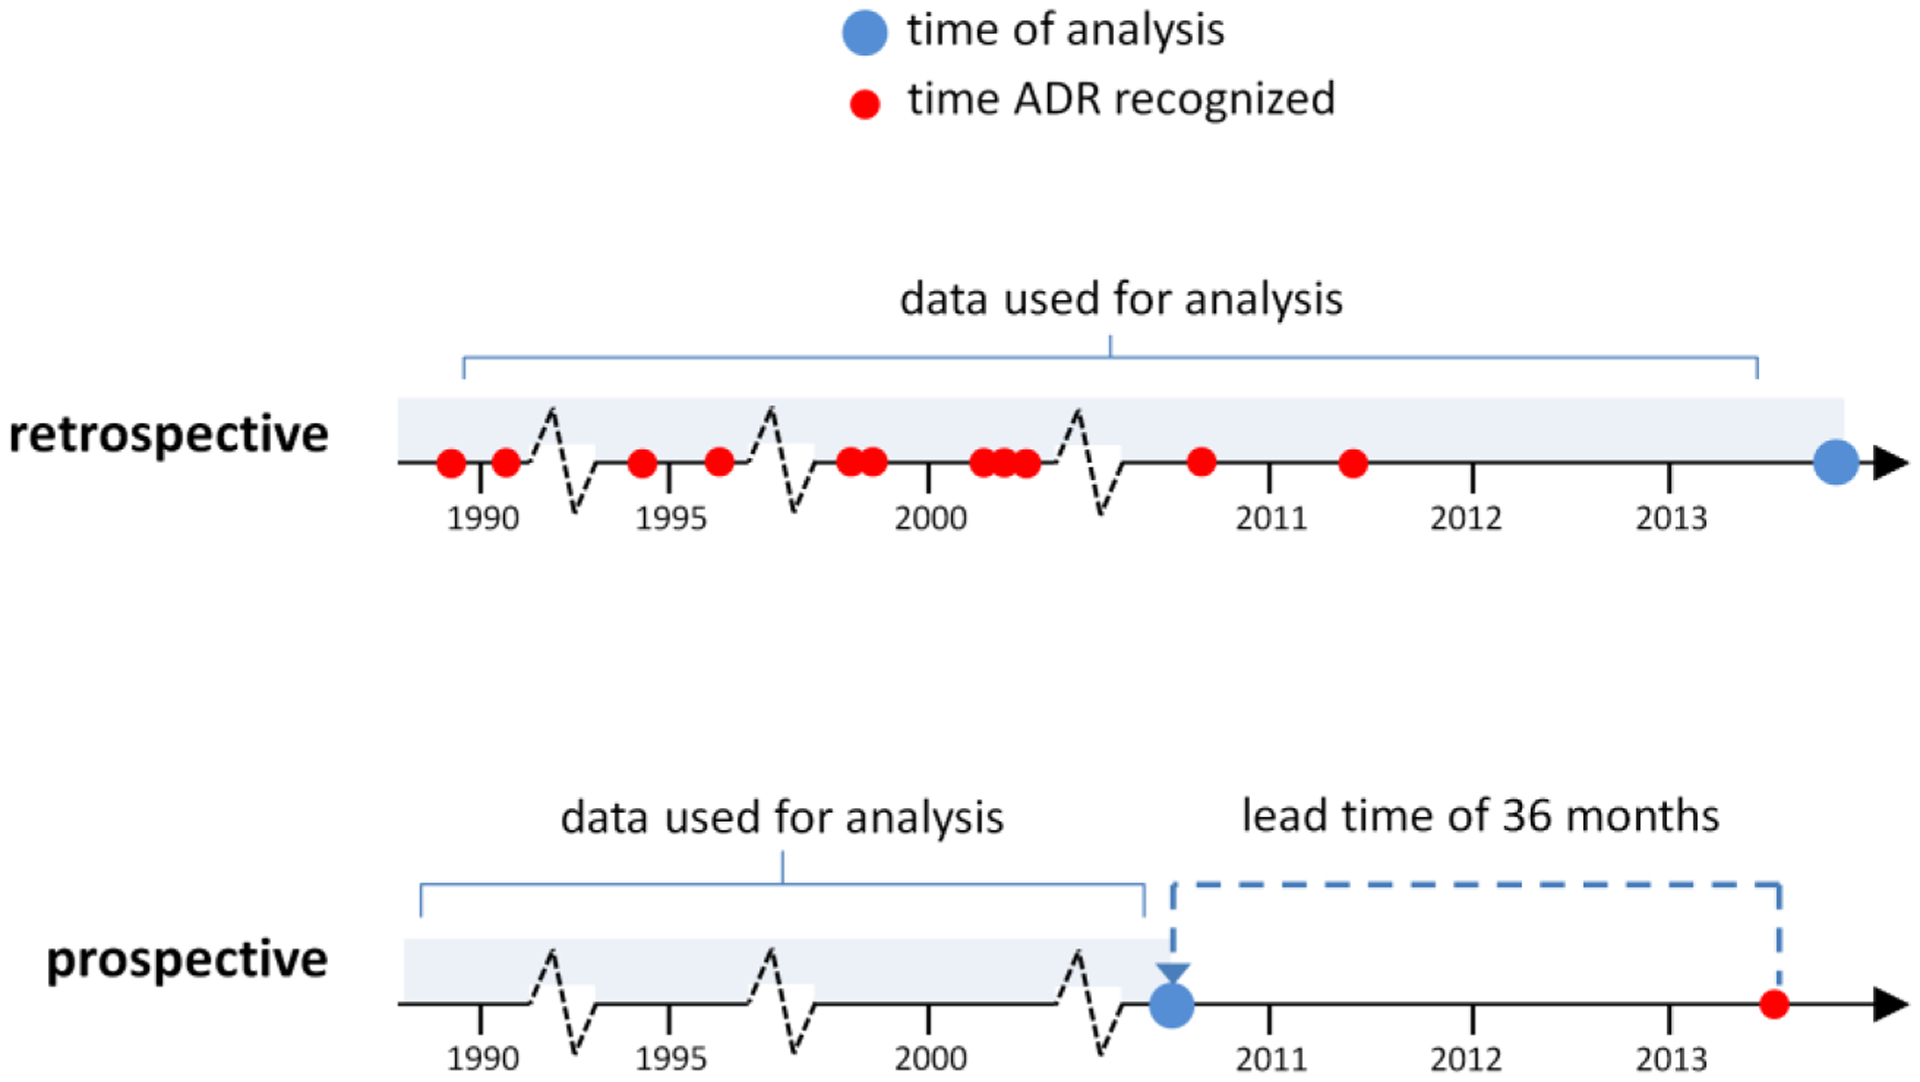
Retrospective versus prospective performance evaluation. In the retrospective evaluation all data up to the end of 2013 is used to generate signals for historical, known associations (and negative controls) from the OMOP benchmark. A prospective evaluation is simulated by backdating the analysis to a time period preceding the recognition of a given labeled ADR by an amount specified as lead time (e.g., 36 months). At this time point signal statistics for labeled ADRs and negative controls are generated from each data source.
We propose two performance indices called longitudinal-AUC (LAUC) and mean lead time to detection (MLT2D) that blend both accuracy and lead time to detection.
LAUC enables the assessment of signal detection accuracy as a function of the ‘earliness’ of detection, permitting statements of the form: ‘with a lead time of 36 months method A detects signals more accurately than method B’. Calculating LAUC requires backdating the analysis of each positive test case to a different time period (depending on its index date), comparing its signal score to those of each negative test case, and computing a test statistic that longitudinally generalizes to the standard AUC statistic. This is not the same as repeated AUC calculations at different time periods, unless all test cases have the same index date. Formally, for a given lead time (lt) LAUC is defined as
where
| (2) |
and , denote the signal score of the ith positive test case and jth negative test case at time t respectively, and the index date (e.g., labeling date) of ith positive test case.
MLT2D is used quantify how early can ADRs be identified given a pre-specified tolerance for false alert rates. For a given ADR (positive test case), lead time to detection for the ADR is the earliest time point for which the proportion of negative test cases having a signal score larger than the investigated ADR is equal to or less than the pre-specified false alert rate. Mean lead time to detection is the average lead time to detection across all positive test cases. Building on the notation above, for a given false alert rate ϵ, and a time series of lead times lt1, …, ltk, MLT2D is formally defined as
Where ltk(i) (ϵ) is the largest ltk that satisfies
| (3) |
Analysis of data from search logs was excluded our backdated evaluations due to the limited time span of the data (18 months)—a result of the terms of use under which the data were collected from Web searchers.
2.7. Quantifying performance gains
To quantify the improvement gained using composite signal scores in lieu of individual scores we use both absolute and relative differences in the AUC (or LAUC) that result from the use of two competing methods. We capture relative differences using the AUC (or LAUC) proportion of error reduction defined as
where K is the number of data sources being used for signal detection, Sk is the set of signal scores generated from data source k, and f(S1, …, SK) is the corresponding set of composite signal scores.
The AUC proportion of error reduction relates to a family of statistical measures known as Proportional Reduction Of Error (PRE), which are based on comparing predictive error levels that result from the use of two methods of prediction[53]. The AUC proportion of error reduction has also been used in prior studies of signal detection[25, 31, 37].
The AUC proportion of error reduction provides an added dimension in understanding performance gains that cannot be directly observed from absolute differences alone. Arguably, an absolute AUC difference of 0.05 between one method compared to a baseline method with an AUC of 0.8 is more interesting or more significant than the same 0.05 difference compared to a baseline method with an AUC of 0.5. Arguably, it is also harder to improve on a better performing method than on a weaker performing method. The former example results in an AUC proportion of error reduction of 25% while the latter results in an AUC proportion of error reduction of 10%, thus highlighting the significance of the former improvement. Notwithstanding, because the AUC proportion of error reduction is relative to prediction error rather than prediction accuracy, it may appear to amplify gains and should therefore be interpreted correctly. Consequently, we report and quantify performance gains in terms of both the absolute AUC difference and the proportion of error reduction.
2.8. Cross validation and significance tests
The performance of the predictive approaches for combining signals was determined using cross-validation. AUC/LAUC was determined using the recommended leave-pair-out cross-validation procedure[54], whereas MLT2D was determined using leave-one-out cross-validation. For the former the left-out pair consists of one positive and one negative test case. For the latter, the left-out observation consists of a positive test case. In leave-pair-out cross-validation we iterate through all combinations of pairs made of one positive and one negative test case. In each iteration, the training set consists of all test cases with the exclusion of a single pair. The trained model is then applied to predict a pair of signal scores for the held-out pair, which are then input to eq. 2 to compute AUC/LAUC.
DeLong’s test for the difference between correlated AUCs[55] (and by extension error reduction) was used to obtain one-sided p-values for the difference between the AUC of the multimodal (composite) signal statistics and those of the single modalities (differences significantly greater than zero). A trivial modification of DeLong’s original formulation was used to calculate cross-validated and LAUC-based p-values for evaluations that utilized the two. One-sided p-values for differences in MLT2D were obtained using paired T-tests.
3. Results
The full set of performance statistics generated for this study are provided in the Appendix. Here we summarize key findings and trends.
3.1. Retrospective performance evaluation
Figure 3 shows a performance comparison of signal detection modalities based on the OMOP benchmark. The best performing predictive approach to combine signals resulted in an AUC of 0.87, improving the AUC of the best performing single modality (FAERS) by 0.09, which represents an AUC error reduction of 41%. The best performing weighted averaging approach resulted in an AUC improvement of 0.07, which represents an AUC error reduction of 30%. All methods to combine signals with the exclusion of two weighted averaging approaches resulted in statistically significant (p<0.05) error reductions. Appendix A provides the full set performance statistics for this evaluation.
Figure 3.
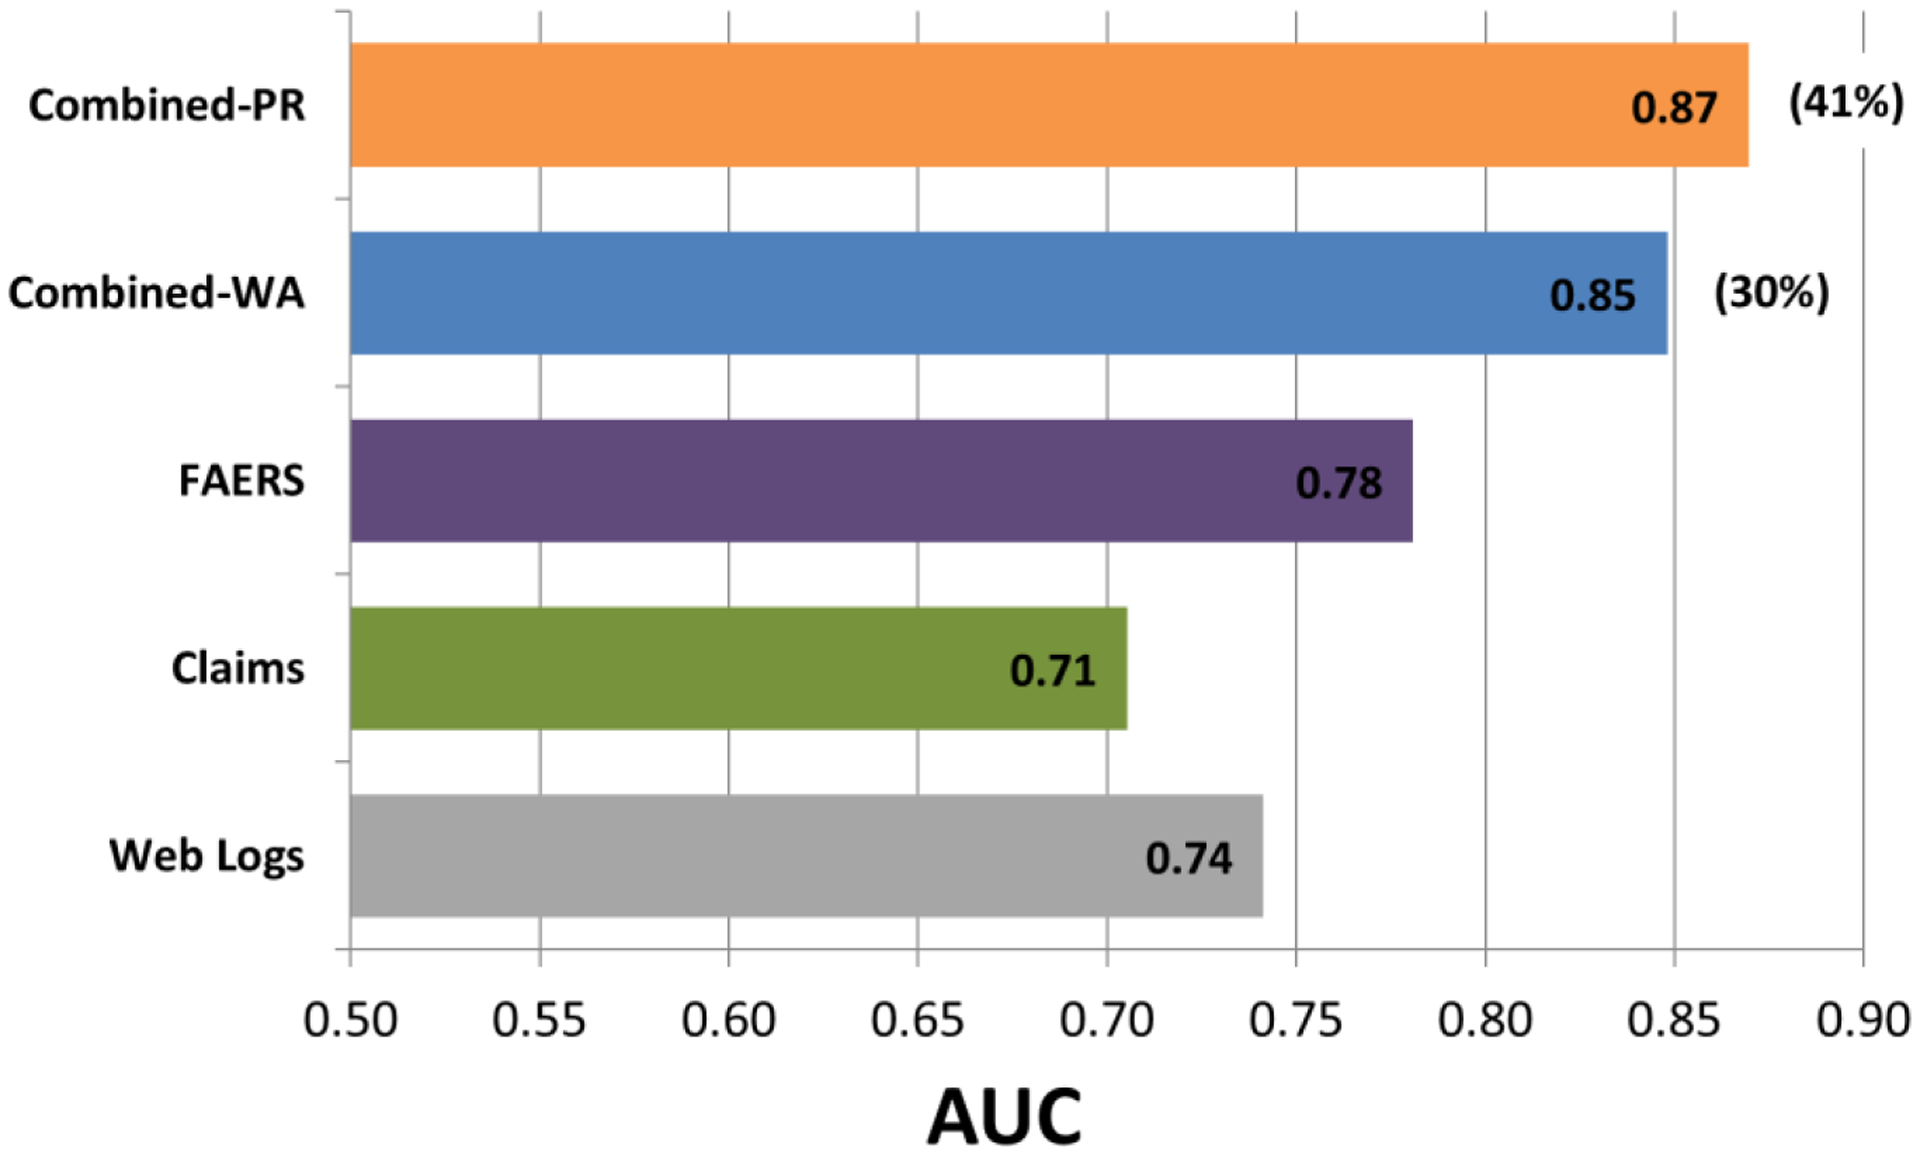
A performance comparison of signal detection modalities based on the OMOP benchmark. Percentages in parentheses represent proportions of AUC error reduction. Combined-PR; combined signals produced by the best performing predictive algorithm. Combined-WA; combined signals produced by the best performing weighted averaging approach.
3.2. Prospective performance evaluation
Figure 4 displays a performance comparison of signal detection modalities based on LAUC. The evaluation was performed for lead times ranging from 12 months to 72 months in 6 month intervals. The figure shows that the class-leading methods for combining signals result in LAUCs of in the range 0.78–0.86, AUC improvements in the range 0.04–0.09, which represent error reductions ranging from 17% to 37%. For example, given a lead time of 48 months, the multimodal approach provides an AUC improvement of 0.09 over MEDLINE and FAERS, which represents an AUC error reduction of 37%. For the majority of lead times, the LAUC error reductions provided by these leading methods are statistically significant. Appendix B provides the full set of performance statistics for this LAUC evaluation.
Figure 4.
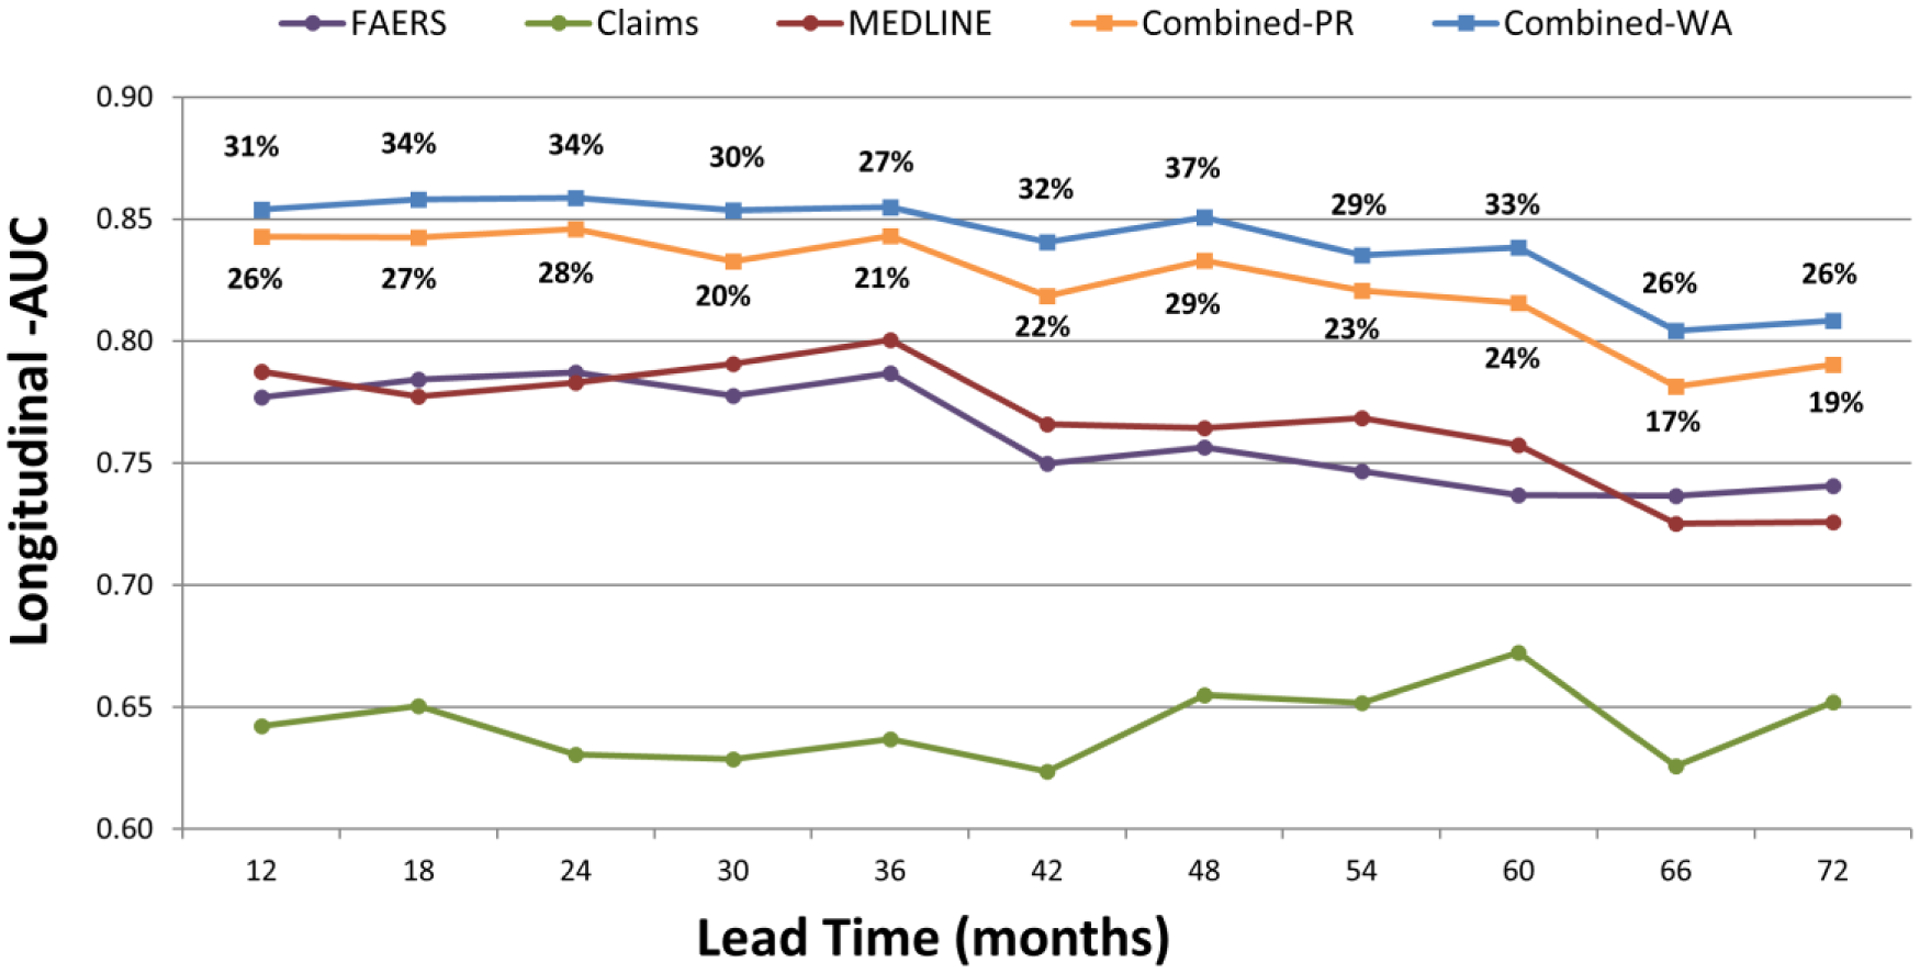
Longitudinal-AUCs based on the time-indexed benchmark (recently labeled ADRs) for leads times of 12–72 months. Percentages above/below curves represent error reductions. Combined-PR; combined signals produced by the best performing predictive algorithm. Combined-WA; combined signals produced by the best performing weighted averaging approach.
Figure 5 shows a comparison of MLT2D between modalities as a function of eight representative false alert rate cutoffs ranging from 1% to 30%. A total of 24 time points ranging from a lead time of 0 to 81 months, with three month intervals, were used to form a time series of signal scores for each test case, and a three-point moving average was used to smooth short-term signal score fluctuations.
Figure 5.
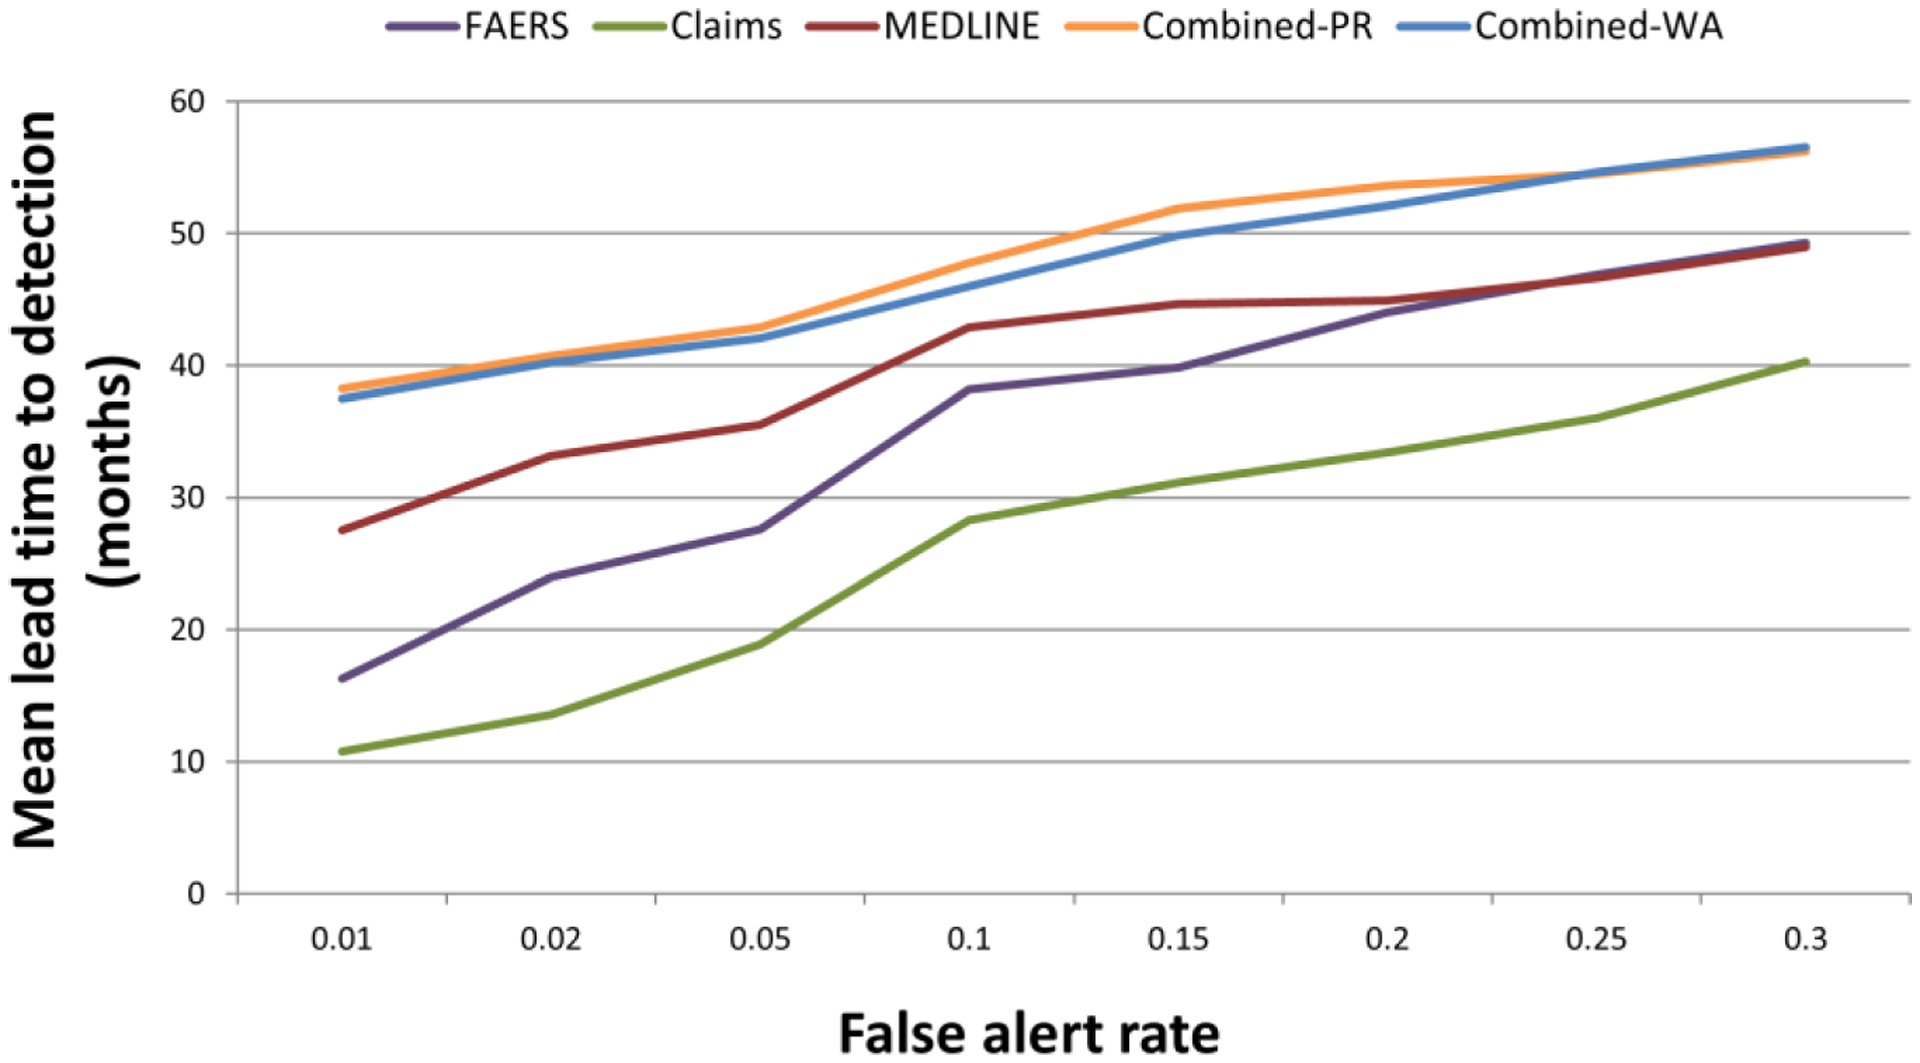
Mean lead time to detection as a function of eight representative false alert rates. Combined-PR; combined signals produced by the best performing predictive algorithm. Combined-WA; combined signals produced by the best performing weighted averaging approach. Note that the scale of the first two points on the x-axis is different from the remaining points.
Expectedly, the figure shows that lead time to detection increases as our tolerance for false alerts increases. For example, with a false alert rate of 5% the multimodal approach detects ADRs 3.5 years in advance of our index dates (labeling revision dates). A false alert tolerance of 30% would add one more year of lead time. Relative to our index dates, the added lead time provided by the multimodal approach over the MEDLINE modality ranges from 7 to 10 months, and 7 to 22 months over the FAERS modality. The class-leading methodologies to combine signals provided virtually equivalent performance, with statistically significant improvements over the single modalities for the majority of false alert rates.
The distribution of lead times resulting in MLT2D for the two class-leading methodologies is illustrated in Figure 6. The figure shows that the proportion of test cases with lead times at the time series boundaries (0–81 months) decreases from about 50% to 30% as we vary the false alert tolerance from 1% to 30%. The figure also shows that about 10% of our test cases are undetectable (lead time=0) and about 10% are always detectable (lead time=81) regardless of the false alert tolerance.
Figure 6.
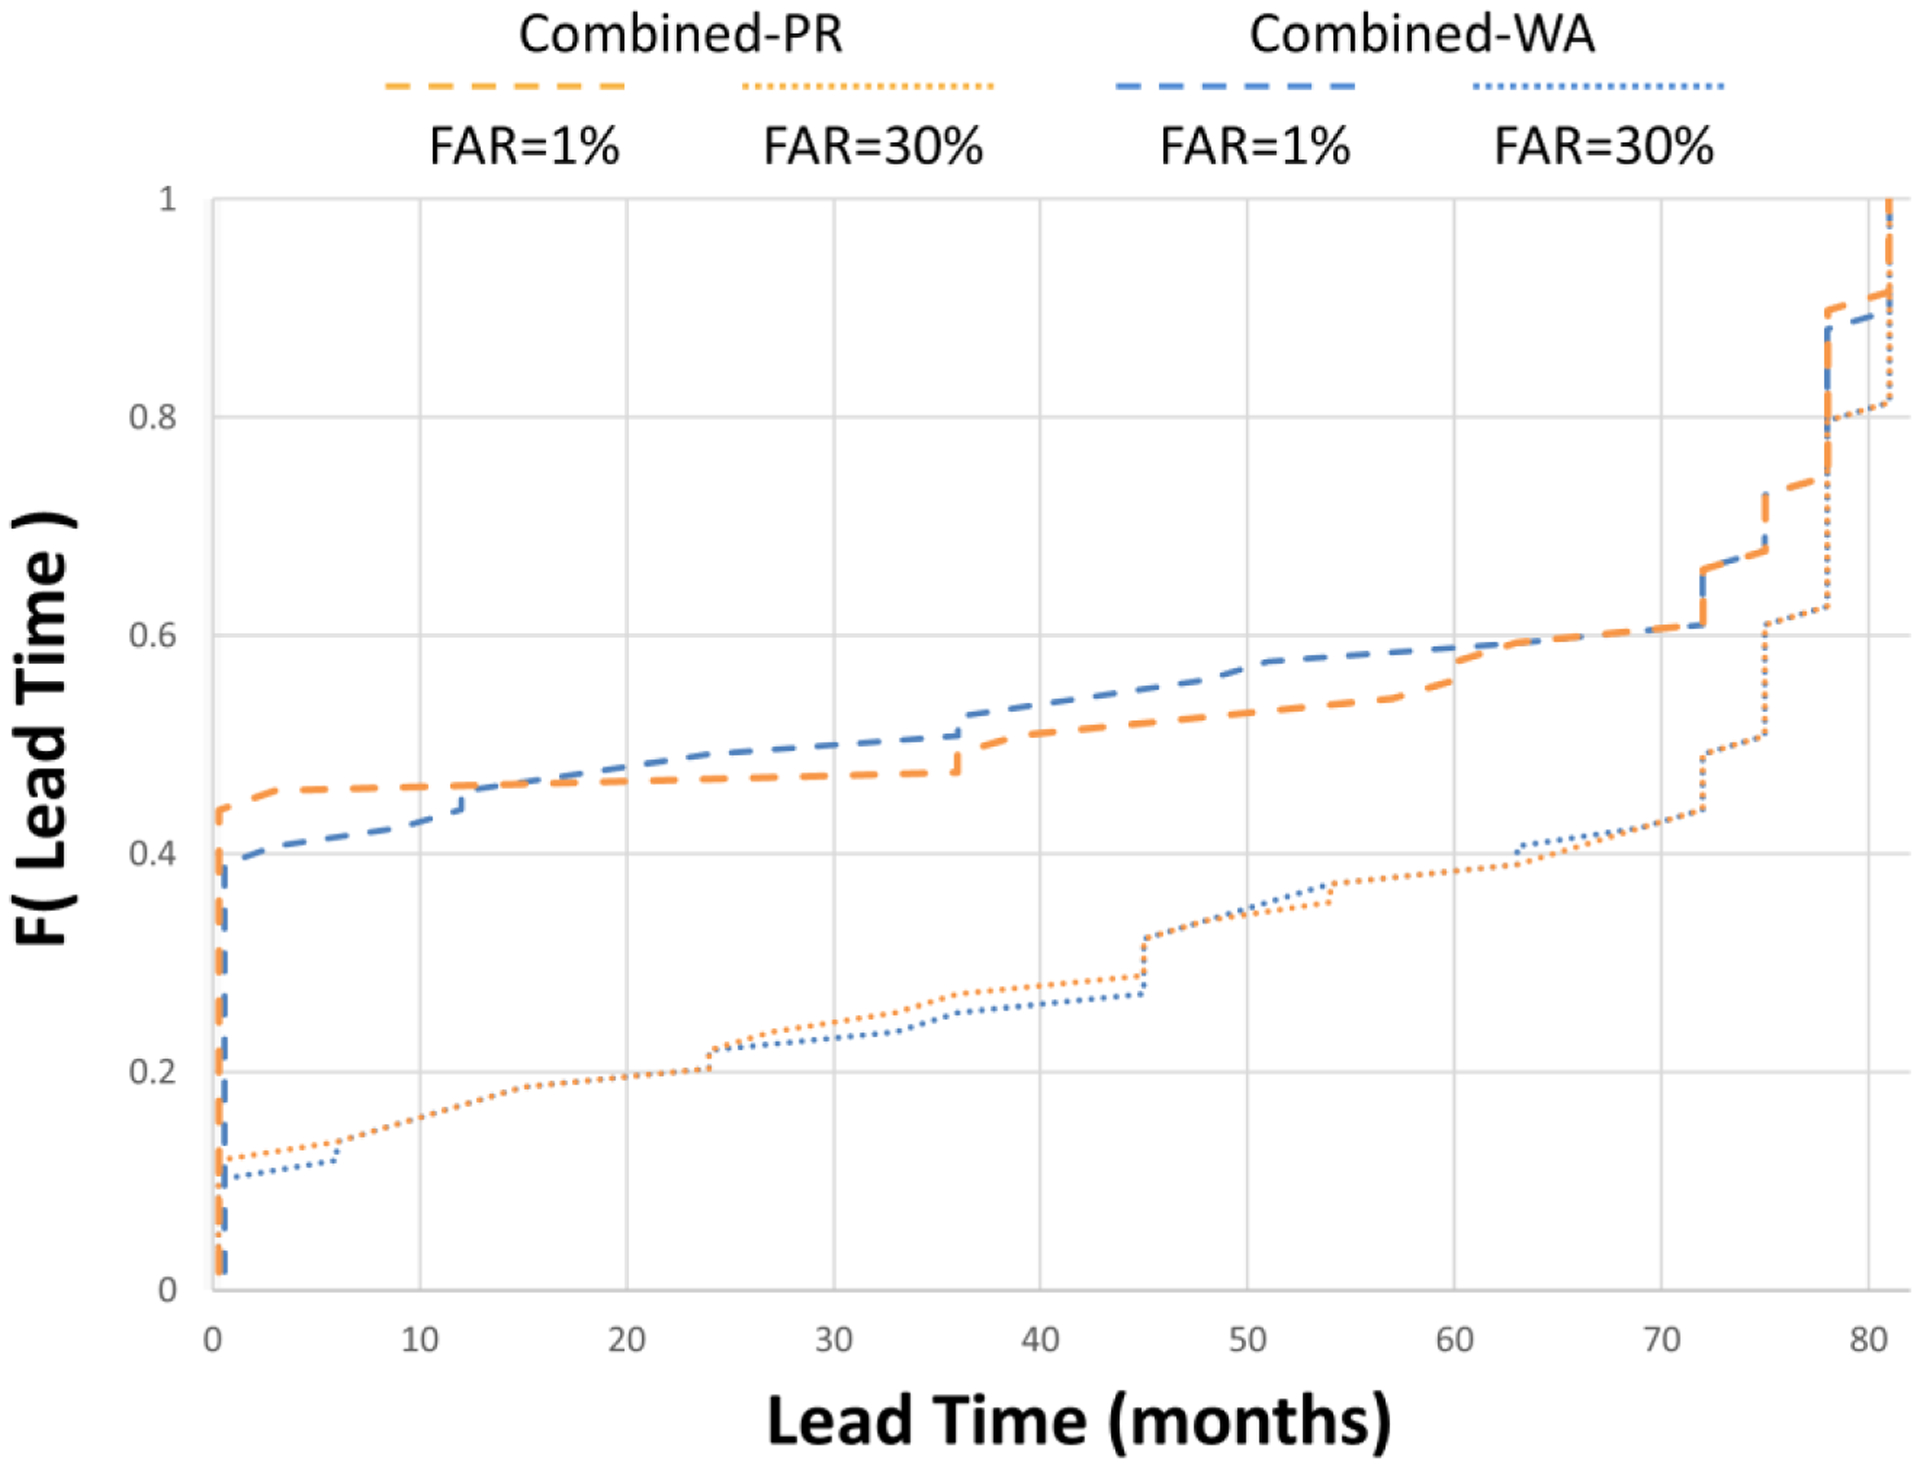
Cumulative distribution of lead times to detection for the class-leading methods to combine signals, given false alert rates of 1% and 30%. The lower the curve, the more probability mass attached to greater lead times. FAR; false alert rate. Combined-PR; combined signals produced by the best performing predictive algorithm. Combined-WA; combined signals produced by the best performing weighted averaging approach.
Appendix B provides the full set of performance statistics for the MLT2D evaluation, and an equivalent evaluation for median lead time to detection, with similar results, is also provided in Appendix B.
3.3. Method differences
The predictive class of approaches to combine signals generally performed better than the weighted averaging class of methods, but the performance differences between the class leaders were small and statistically insignificant. The within class performance variation was larger for the weighted averaging class, and while there was no clear winner among methods within the predictive class, their performance differences were minimal. The arithmetic and geometric average approaches resulted in near equivalent performance, usually better than their other class members. This was because the weights attached to each source, which are proportional to the amount of data available for a given association, was inversely related to predictive power of the data sources. Table 3 displays the best performing methods for each evaluation category. With the exclusion of FAERS and search logs in the retrospective evaluation, the point estimate s (eq. 1) provided greater performance than its 5% lower limit.
Table 3.
Best performing methods for each evaluation category
| Retrospective | Prospective | ||
|---|---|---|---|
| AUC | LAUC | MLT2D | |
| Combined - PR | RF | LR | SVM |
| Combined - WA | RE | AA | AA |
Combined-PR; class of predictive algorithms to combine signals. Combined-WA; class of approaches based on weighted averaging to combine signals. RF; random forests. LR; logistic regression. SVM; support vector machines. RE; weighted averaging implicit in random effects meta-analysis. AA; arithmetic average.
3.4. Removed test cases
For the OMOP benchmark 12 of the 359 test cases were deemed untestable (E=0) and removed from the evaluation. The number of test cases removed in the backdated evaluations for each of the lead times displayed in Figure 4 were: 5, 8, 8, 8, 9, 9, 13, 14, 14, 15, 16 respectively, of a total of 135 time-indexed test cases.
4. Discussion
The profusion and diversity of available information sources makes it difficult to ignore the potential benefits associated with multimodal approaches for drug safety surveillance. A key property of multimodality is complementarity, in the sense that each modality contributes to the whole some added value that cannot be obtained otherwise. This property allows data to inform each other by providing constraints that enhance robustness, uniqueness, interpretability, and other desired properties[12]. For signal detection these constraints translate to the potential of suppressing drawbacks of each modality; such as limited data, timeliness of detection, and low predictive power that may be associated with the detection of certain types of ADRs. Within the limitations of our evaluation framework, our results show that multimodal signal detection based on the idea of pooling and aggregating signal statistics may indeed lead to improved signal detection.
4.1. Benchmarks
As with most studies of this type, reliance on fixed benchmarks (based on predefined test cases) makes studies feasible, but does not guarantee generalizability to surveillance of other ADRs in the open world. The universe of ADRs, the way in which drugs are consumed, and the reasons for the occurrence of ADRs is too complex to be captured by limited benchmarks. In the same vein, a limitation of our time-indexed benchmark is that its index dates do not reflect the time in which initial concerns about ADRs may have surfaced, and therefore the exact timing for which early signal detection would need to occur. However, since the accurate ‘birth’ dates of all ADRs are not publicly documented, these index dates provide a reasonable surrogate to investigate the temporal aspect of signal detection. Consequently, our results about lead-time-to-detection should be interpreted as comparative approximations of method differences and not as the absolute added lead-time that may be provided by a methodology in real surveillance scenarios.
Because the status of ADRs is often determined based on evidence drawn from SRS and the literature, the potential correlation between content in these data sources and the classification of test cases in our benchmarks may have led to optimistically biased performance statistics. This could explain the superior performance of FAERS and MEDLINE compared to the other data sources, and suggest that our performance statistics for the multimodal approach are also upward biased. Consequently, our reported performance statistics should not be interpreted in absolute terms, and the reported relative differences should be viewed as approximations. However, this potential correlation pertains to only the interpretation of the absolute performance statistics and cannot explain the comparative improvements. In addition, this correlation weakens as we backdate evaluations to earlier time points since the amount of information about ADRs usually decreases as we move to earlier time points.
4.2. Modalities
All data sources that can contribute reliable safety evidence should be considered in a multimodal setting to maximize its potential. The addition of more reliable and complimentary signaling sources is likely to further improve performance; though possibly with diminishing gains. This work covered only a limited number of data sources, and the role of other data sources, including approaches based on mechanistic pharmacology, should also be investigated.
In some of our evaluations MEDLINE was found to be the best performing modality. This can be expected for benchmarks derived from the literature as is the case for our retrospective analysis—which is why the MEDLINE modality was omitted from our retrospective analysis. However, the high performance of MEDLINE is less expected in our backdated evaluation of recently labeled ADRs. A possible explanation could be the dependence of labeling decisions on evidence drawn from the biomedical literature. However, as shown in Figures 4–5, this correlation diminishes as we evaluate earlier time points in which case MEDLINE is no longer the best performing source. Another explanation is that MEDLINE is the only source included in our evaluation that spans the entire life cycle of a drug from early development through market life, is more diversified with respect to the safety evidence it includes (e.g., animal and in vitro studies), and is peer-reviewed. More research is needed to further understand the biomedical literature as a signaling source and its relationship with the determination of ADR status.
We also found that our claims data (MarketScan Commercial Claims and Encounters) provided marginal benefit to multimodal detection of emerging ADRs. However, this result cannot be generalized to other types of medical records, and it is unknown whether this result is just a consequence of the methodology we selected to generate signals from this data source.
Due to the limited time span of data that was available we were unable to determine the value of Internet search logs for the detection of emerging ADRs. However, within the limitations of the data available, a recent study demonstrated relatively high predictive value for emerging ADRs based on a smaller subset of the time-indexed benchmark[56].
4.3. Methods
To demonstrate the potential of multimodal signal detection we chose to highlight peak performance, and we acknowledge that our reported performance statistics should be critically judged as such. Nevertheless, the anticipated improvements of multimodal signal detection were consistently seen across a large number of methodologies we evaluated (with small differences, see Appendix), and across two distinctive benchmarks. It also clear that the methods we selected are only a sample of possible methods to generate and combine signals, and others should also be considered.
Although we found that the class of predictive approaches to combine signals generally resulted in greater performance and were more consistent, the approaches based on weighted averaging provide stronger support for the paradigm given that they are not fitted to the evaluation benchmarks. Their relative simplicity, ease of implementation, and somewhat surprisingly good performance, makes them attractive candidates for future implementations.
5. Conclusions
Within the scope of our evaluation framework, the results support the notion that utilizing and jointly analyzing multiple data sources may lead to improved signal detection. However, given several limitations associated with the data and benchmarks used in this work, it is currently not possible to make definitive statements about the ultimate utility, or quantifiable benefits of, or the implementation of multimodal signal detection. By highlighting the challenges and limitations involved in the construction and evaluation of multimodal signal detection, by exploring methodologies to combine signal statistics, and by developing methods to evaluate multimodal signal detection, the work embodied in this manuscript brings us closer to understanding the promise of multimodal signal detection. Further development requires deeper understanding of the data sources used in the construction of a multimodal system, their inherent biases and limitations, their relationships and interactions, and the mutual properties that would make them perform well in combination. The applicability of additional data sources must also be examined, as well as the utility of other methods to generate and synthesize signal statistics. Crucially, additional benchmarks will need to be developed to expand the scope of evaluated surveillance scenarios, to quantify gains from multimodal approaches, and to further characterize its potential benefits. Given the complexity of ADRs, benchmarks can only provide close approximations to the true performance characteristics of signal detection methodologies. To this end, our performance statistics should be interpreted as such approximations. Finally, our work contributes new performance indices that blend both the accuracy and the lead-time-to-detection. These indices are general enough to support other studies of signal detection, and in our view, are needed to capture the important time dimension of signal detection.
Supplementary Material
Highlights.
Improving signal detection is key to strengthening drug safety surveillance
Multimodal signal detection (MSD) is based on jointly analyzing multiple data sources
This manuscript broadens evaluations of MSD done in prior studies
The results provide support for MSD, but its ultimate utility cannot currently be proven
Further research is needed to determine the ultimate utility of MSD
ACKNOWLEDGMENTS
This work was partially supported by the National Institute of General Medical Sciences (NIGMS) grant R01 GM101430, and the intramural Research Program of the NIH, National Library of Medicine (NLM). This work also received support from the U.S. Food and Drug Administration (FDA) through the Center for Drug Evaluation and Research (CDER) Critical Path Program [interagency agreement with NLM (XLM12011 001)], from the Office of Translational Sciences at CDER, from the UCSF-Stanford CERSI award (U01FD004979), as well as from the ORISE Fellowship program at the FDA.
Footnotes
Publisher's Disclaimer: This is a PDF file of an unedited manuscript that has been accepted for publication. As a service to our customers we are providing this early version of the manuscript. The manuscript will undergo copyediting, typesetting, and review of the resulting proof before it is published in its final citable form. Please note that during the production process errors may be discovered which could affect the content, and all legal disclaimers that apply to the journal pertain.
COMPETING FINANCIAL INTERESTS
The authors declare no competing financial interests. Rave Harpaz and William DuMouchel are employed by Oracle Health Sciences. Nigam H Shah is a Science Advisor to Apixio Inc. and Learning Health Inc. Carol Friedman consults for Health Fidelity Inc. Martijn Schuemie is employed by Janssen Research and Development. Eric Horvitz and Ryen W White are employed by Microsoft.
Publisher's Disclaimer: DISCLAIMER
The findings and conclusions expressed in this report are those of the authors and do not necessarily represent the views of the U.S. FDA or the federal government.
REFERENCES
- [1].Prescription Drug User Fee Act (PDUFA V). http://www.fda.gov/ForIndustry/UserFees/PrescriptionDrugUserFee/ucm272170.htm.
- [2].REGULATION (EU) No 1235/2010 OF THE EUROPEAN PARLIAMENT AND OF THE COUNCIL of 15 December 2010. http://www.ema.europa.eu/ema/index.jsp?curl=pages/regulation/general/general_content_000492.jsp.
- [3].Food and Drug Administration Amendments Act (FDAAA) of 2007. http://www.fda.gov/regulatoryinformation/legislation/federalfooddrugandcosmeticactfdcact/significantamendmentstothefdcact/foodanddrugadministrationamendmentsactof2007/default.htm.
- [4].Altman RB, Khuri N, Salit M, Giacomini KM. Unmet needs: Research helps regulators do their jobs. Sci Transl Med. 2015;7:315ps22. [DOI] [PubMed] [Google Scholar]
- [5].Califf RM, Ostroff S. FDA as a catalyst for translation. Science Translational Medicine. 2015;7:296ed9–ed9. [DOI] [PubMed] [Google Scholar]
- [6].Platt R, Wilson M, Chan KA, Benner JS, Marchibroda J, McClellan M. The New Sentinel Network - Improving the Evidence of Medical-Product Safety. New England Journal of Medicine. 2009;361:645–7. [DOI] [PubMed] [Google Scholar]
- [7].Wysowski DK, Swartz L. Adverse drug event surveillance and drug withdrawals in the United States, 1969–2002: the importance of reporting suspected reactions. Arch Intern Med. 2005;165:1363–9. [DOI] [PubMed] [Google Scholar]
- [8].CIOMS Working Group VIII. Practical Aspects of Signal Detection in Pharmacovigilance: CIOMS; 2010. [Google Scholar]
- [9].Szarfman A, Machado SG, O’Neill RT. Use of screening algorithms and computer systems to efficiently signal higher-than-expected combinations of drugs and events in the US FDA’s spontaneous reports database. Drug Saf. 2002;25:381–92. [DOI] [PubMed] [Google Scholar]
- [10].Harpaz R, DuMouchel W, Shah NH, Madigan D, Ryan P, Friedman C. Novel data-mining methodologies for adverse drug event discovery and analysis. Clin Pharmacol Ther. 2012;91:1010–21. [DOI] [PMC free article] [PubMed] [Google Scholar]
- [11].Vigibase Lindquist M., the WHO Global ICSR Database System: Basic Facts. Drug Information Journal. 2008;42:409–19. [Google Scholar]
- [12].Lahat D, Adali T, Jutten C. Multimodal Data Fusion: An Overview of Methods, Challenges, and Prospects. Proceedings of the IEEE. 2015;103:1449–77. [Google Scholar]
- [13].Stang PE, Ryan PB, Racoosin JA, Overhage JM, Hartzema AG, Reich C, et al. Advancing the Science for Active Surveillance: Rationale and Design for the Observational Medical Outcomes Partnership. Annals of Internal Medicine. 2010;153:600–W206. [DOI] [PubMed] [Google Scholar]
- [14].Coloma PM, Schuemie MJ, Trifiro G, Gini R, Herings R, Hippisley-Cox J, et al. Combining electronic healthcare databases in Europe to allow for large-scale drug safety monitoring: the EU-ADR Project. PharmacoepidemiolDrug Saf. 2011;20:1–11. [DOI] [PubMed] [Google Scholar]
- [15].LePendu P, Iyer SV, Bauer-Mehren A, Harpaz R, Mortensen JM, Podchiyska T, et al. Pharmacovigilance using clinical notes. Clin Pharmacol Ther. 2013;93:547–55. [DOI] [PMC free article] [PubMed] [Google Scholar]
- [16].Haerian K, Varn D, Vaidya S, Ena L, Chase HS, Friedman C. Detection of pharmacovigilance-related adverse events using electronic health records and automated methods. Clin Pharmacol Ther. 2012;92:228–34. [DOI] [PMC free article] [PubMed] [Google Scholar]
- [17].Norén GN, Hopstadius J, Bate A, Star K, Edwards IR. Temporal pattern discovery in longitudinal electronic patient records. Data Mining and Knowledge Discovery. 2010;20:361–87. [Google Scholar]
- [18].Avillach P, Dufour JC, Diallo G, Salvo F, Joubert M, Thiessard F, et al. Design and validation of an automated method to detect known adverse drug reactions in MEDLINE: a contribution from the EU-ADR project. J Am Med Inform Assoc. 2013;20:446–52. [DOI] [PMC free article] [PubMed] [Google Scholar]
- [19].Pontes H, Clement M, Rollason V. Safety signal detection: the relevance of literature review. Drug Saf. 2014;37:471–9. [DOI] [PubMed] [Google Scholar]
- [20].Winnenburg R, Sorbello A, Ripple A, Harpaz R, Tonning J, Szarfman A, et al. Leveraging MEDLINE indexing for pharmacovigilance – Inherent limitations and mitigation strategies. Journal of Biomedical Informatics. 2015;57:425–35. [DOI] [PMC free article] [PubMed] [Google Scholar]
- [21].Sarker A, Ginn R, Nikfarjam A, O’Connor K, Smith K, Jayaraman S, et al. Utilizing social media data for pharmacovigilance: A review. J Biomed Inform. 2015;54:202–12. [DOI] [PMC free article] [PubMed] [Google Scholar]
- [22].Edwards IR, Lindquist M. Social Media and Networks in Pharmacovigilance. Drug Safety. 2011;34:267–71. [DOI] [PubMed] [Google Scholar]
- [23].Freifeld CC, Brownstein JS, Menone CM, Bao W, Filice R, Kass-Hout T, et al. Digital drug safety surveillance: monitoring pharmaceutical products in twitter. Drug Saf. 2014;37:343–50. [DOI] [PMC free article] [PubMed] [Google Scholar]
- [24].Harpaz R, Callahan A, Tamang S, Low Y, Odgers D, Finlayson S, et al. Text mining for adverse drug events: the promise, challenges, and state of the art. Drug Saf. 2014;37:777–90. [DOI] [PMC free article] [PubMed] [Google Scholar]
- [25].White RW, Harpaz R, Shah NH, DuMouchel W, Horvitz E. Toward enhanced pharmacovigilance using patient-generated data on the internet. Clin Pharmacol Ther. 2014;96:239–46. [DOI] [PMC free article] [PubMed] [Google Scholar]
- [26].Yom-Tov E, Gabrilovich E. Postmarket Drug Surveillance Without Trial Costs: Discovery of Adverse Drug Reactions Through Large-Scale Analysis of Web Search Queries. J Med Internet Res. 2013;15:e124. [DOI] [PMC free article] [PubMed] [Google Scholar]
- [27].White RW, Tatonetti NP, Shah NH, Altman RB, Horvitz E. Web-scale pharmacovigilance: listening to signals from the crowd. J Am Med Inform Assoc. 2013;20:404–8. [DOI] [PMC free article] [PubMed] [Google Scholar]
- [28].Abernethy DR, Woodcock J, Lesko LJ. Pharmacological mechanism-based drug safety assessment and prediction. Clin Pharmacol Ther. 2011;89:793–7. [DOI] [PubMed] [Google Scholar]
- [29].Harpaz R, Vilar S, Dumouchel W, Salmasian H, Haerian K, Shah NH, et al. Combing signals from spontaneous reports and electronic health records for detection of adverse drug reactions. J Am Med Inform Assoc. 2013;20:413–9. [DOI] [PMC free article] [PubMed] [Google Scholar]
- [30].Li Y, Ryan P, Wei Y, Friedman C. A Method to Combine Signals from Spontaneous Reporting Systems and Observational Healthcare Data to Detect Adverse Drug Reactions. Drug Safety. 2015:1–14. [DOI] [PMC free article] [PubMed] [Google Scholar]
- [31].Harpaz R, DuMouchel W, LePendu P, Shah NH. Empirical bayes model to combine signals of adverse drug reactions. Proceedings of the 19th ACM SIGKDD international conference on Knowledge discovery and data mining. Chicago, Illinois, USA: ACM; 2013. p. 1339–47. [Google Scholar]
- [32].Xu R, Wang Q. Large-scale combining signals from both biomedical literature and the FDA Adverse Event Reporting System (FAERS) to improve post-marketing drug safety signal detection. BMC Bioinformatics. 2014;15:17. [DOI] [PMC free article] [PubMed] [Google Scholar]
- [33].Vilar S, Harpaz R, Chase HS, Costanzi S, Rabadan R, Friedman C. Facilitating adverse drug event detection in pharmacovigilance databases using molecular structure similarity: application to rhabdomyolysis. JAmMedInformAssoc. 2011;18 Suppl 1:i73–i80. [DOI] [PMC free article] [PubMed] [Google Scholar]
- [34].Yeleswarapu S, Rao A, Joseph T, Saipradeep VG, Srinivasan R. A pipeline to extract drug-adverse event pairs from multiple data sources. BMC Med Inform Decis Mak. 2014;14:13. [DOI] [PMC free article] [PubMed] [Google Scholar]
- [35].Lopes P, Nunes T, Campos D, Furlong LI, Bauer-Mehren A, Sanz F, et al. Gathering and exploring scientific knowledge in pharmacovigilance. PLoS One. 2013;8:e83016. [DOI] [PMC free article] [PubMed] [Google Scholar]
- [36].MEDLINE. http://www.nlm.nih.gov/pubs/factsheets/medline.html.
- [37].Harpaz R, Dumouchel W, Lependu P, Bauer-Mehren A, Ryan P, Shah NH. Performance of pharmacovigilance signal-detection algorithms for the FDA adverse event reporting system. Clin Pharmacol Ther. 2013;93:539–46. [DOI] [PMC free article] [PubMed] [Google Scholar]
- [38].IMEDS Research Lab. http://imeds.reaganudall.org/ResearchLab.
- [39].Medical Subject Headings (MeSH). http://www.nlm.nih.gov/mesh.
- [40].Ryan PB, Schuemie MJ, Welebob E, Duke J, Valentine S, Hartzema AG. Defining a reference set to support methodological research in drug safety. Drug Saf. 2013;36 Suppl 1:S33–47. [DOI] [PubMed] [Google Scholar]
- [41].Hauben M, Aronson JK, Ferner RE. Evidence of Misclassification of Drug-Event Associations Classified as Gold Standard ‘Negative Controls’ by the Observational Medical Outcomes Partnership (OMOP). Drug Saf. 2016;39:421–32. [DOI] [PubMed] [Google Scholar]
- [42].Harpaz R, Odgers D, Gaskin G, DuMouchel W, Winnenburg R, Bodenreider O, et al. A time-indexed reference standard of adverse drug reactions. Sci Data. 2014;1:140043. [DOI] [PMC free article] [PubMed] [Google Scholar]
- [43].RxNorm. https://www.nlm.nih.gov/research/umls/rxnorm/.
- [44].Medical Dictionary for Regulatory Activities (MedDRA). http://www.meddra.org/. [DOI] [PubMed]
- [45].Anatomical Therapeutic Chemical classification system (ATC). http://www.whocc.no/atc.
- [46].Systemized Nomenclature of Medicine Clinical Terms (SNOMED CT). http://www.ihtsdo.org/snomed-ct/.
- [47].Bate A, Lindquist M, Edwards IR, Olsson S, Orre R, Lansner A, et al. A Bayesian neural network method for adverse drug reaction signal generation. Eur J Clin Pharmacol. 1998;54:315–21. [DOI] [PubMed] [Google Scholar]
- [48].Noren GN, Bate A, Orre R, Edwards IR. Extending the methods used to screen the WHO drug safety database towards analysis of complex associations and improved accuracy for rare events. Stat Med. 2006;25:3740–57. [DOI] [PubMed] [Google Scholar]
- [49].DuMouchel W, Pregibon D. Empirical bayes screening for multi-item associations. Proceedings of the seventh ACM SIGKDD international conference on Knowledge discovery and data mining. 2001:67–76. [Google Scholar]
- [50].Ryan PB, Schuemie MJ, Madigan D. Empirical performance of a self-controlled cohort method: lessons for developing a risk identification and analysis system. Drug Saf. 2013;36 Suppl 1:S95–106. [DOI] [PubMed] [Google Scholar]
- [51].Ryan PB, Stang PE, Overhage JM, Suchard MA, Hartzema AG, DuMouchel W, et al. A comparison of the empirical performance of methods for a risk identification system. Drug Saf. 2013;36 Suppl 1:S143–58. [DOI] [PubMed] [Google Scholar]
- [52].DerSimonian R, Laird N. Meta-analysis in clinical trials. Control Clin Trials. 1986;7:177–88. [DOI] [PubMed] [Google Scholar]
- [53].Lewis-Beck M, Bryman A, Futing Liao T. Proportional Reduction Of Error (PRE). In The SAGE Encyclopedia of Social Science Research Methods. 2004. [Google Scholar]
- [54].Airola TP Antti, Waegeman Willem, De Baets Bernard, Salakoski Tapio. A comparison of AUC estimators in small-sample studies. Proceedings of the 3rd International workshop on Machine Learning in Systems Biology. 2009:15–23. [Google Scholar]
- [55].DeLong ER, DeLong DM, Clarke-Pearson DL. Comparing the areas under two or more correlated receiver operating characteristic curves: a nonparametric approach. Biometrics. 1988;44:837–45. [PubMed] [Google Scholar]
- [56].White RW, Wang S, Pant A, Harpaz R, Shukla P, Sun W, et al. Early identification of adverse drug reactions from search log data. J Biomed Inform. 2016;59:42–28. [DOI] [PubMed] [Google Scholar]
Associated Data
This section collects any data citations, data availability statements, or supplementary materials included in this article.