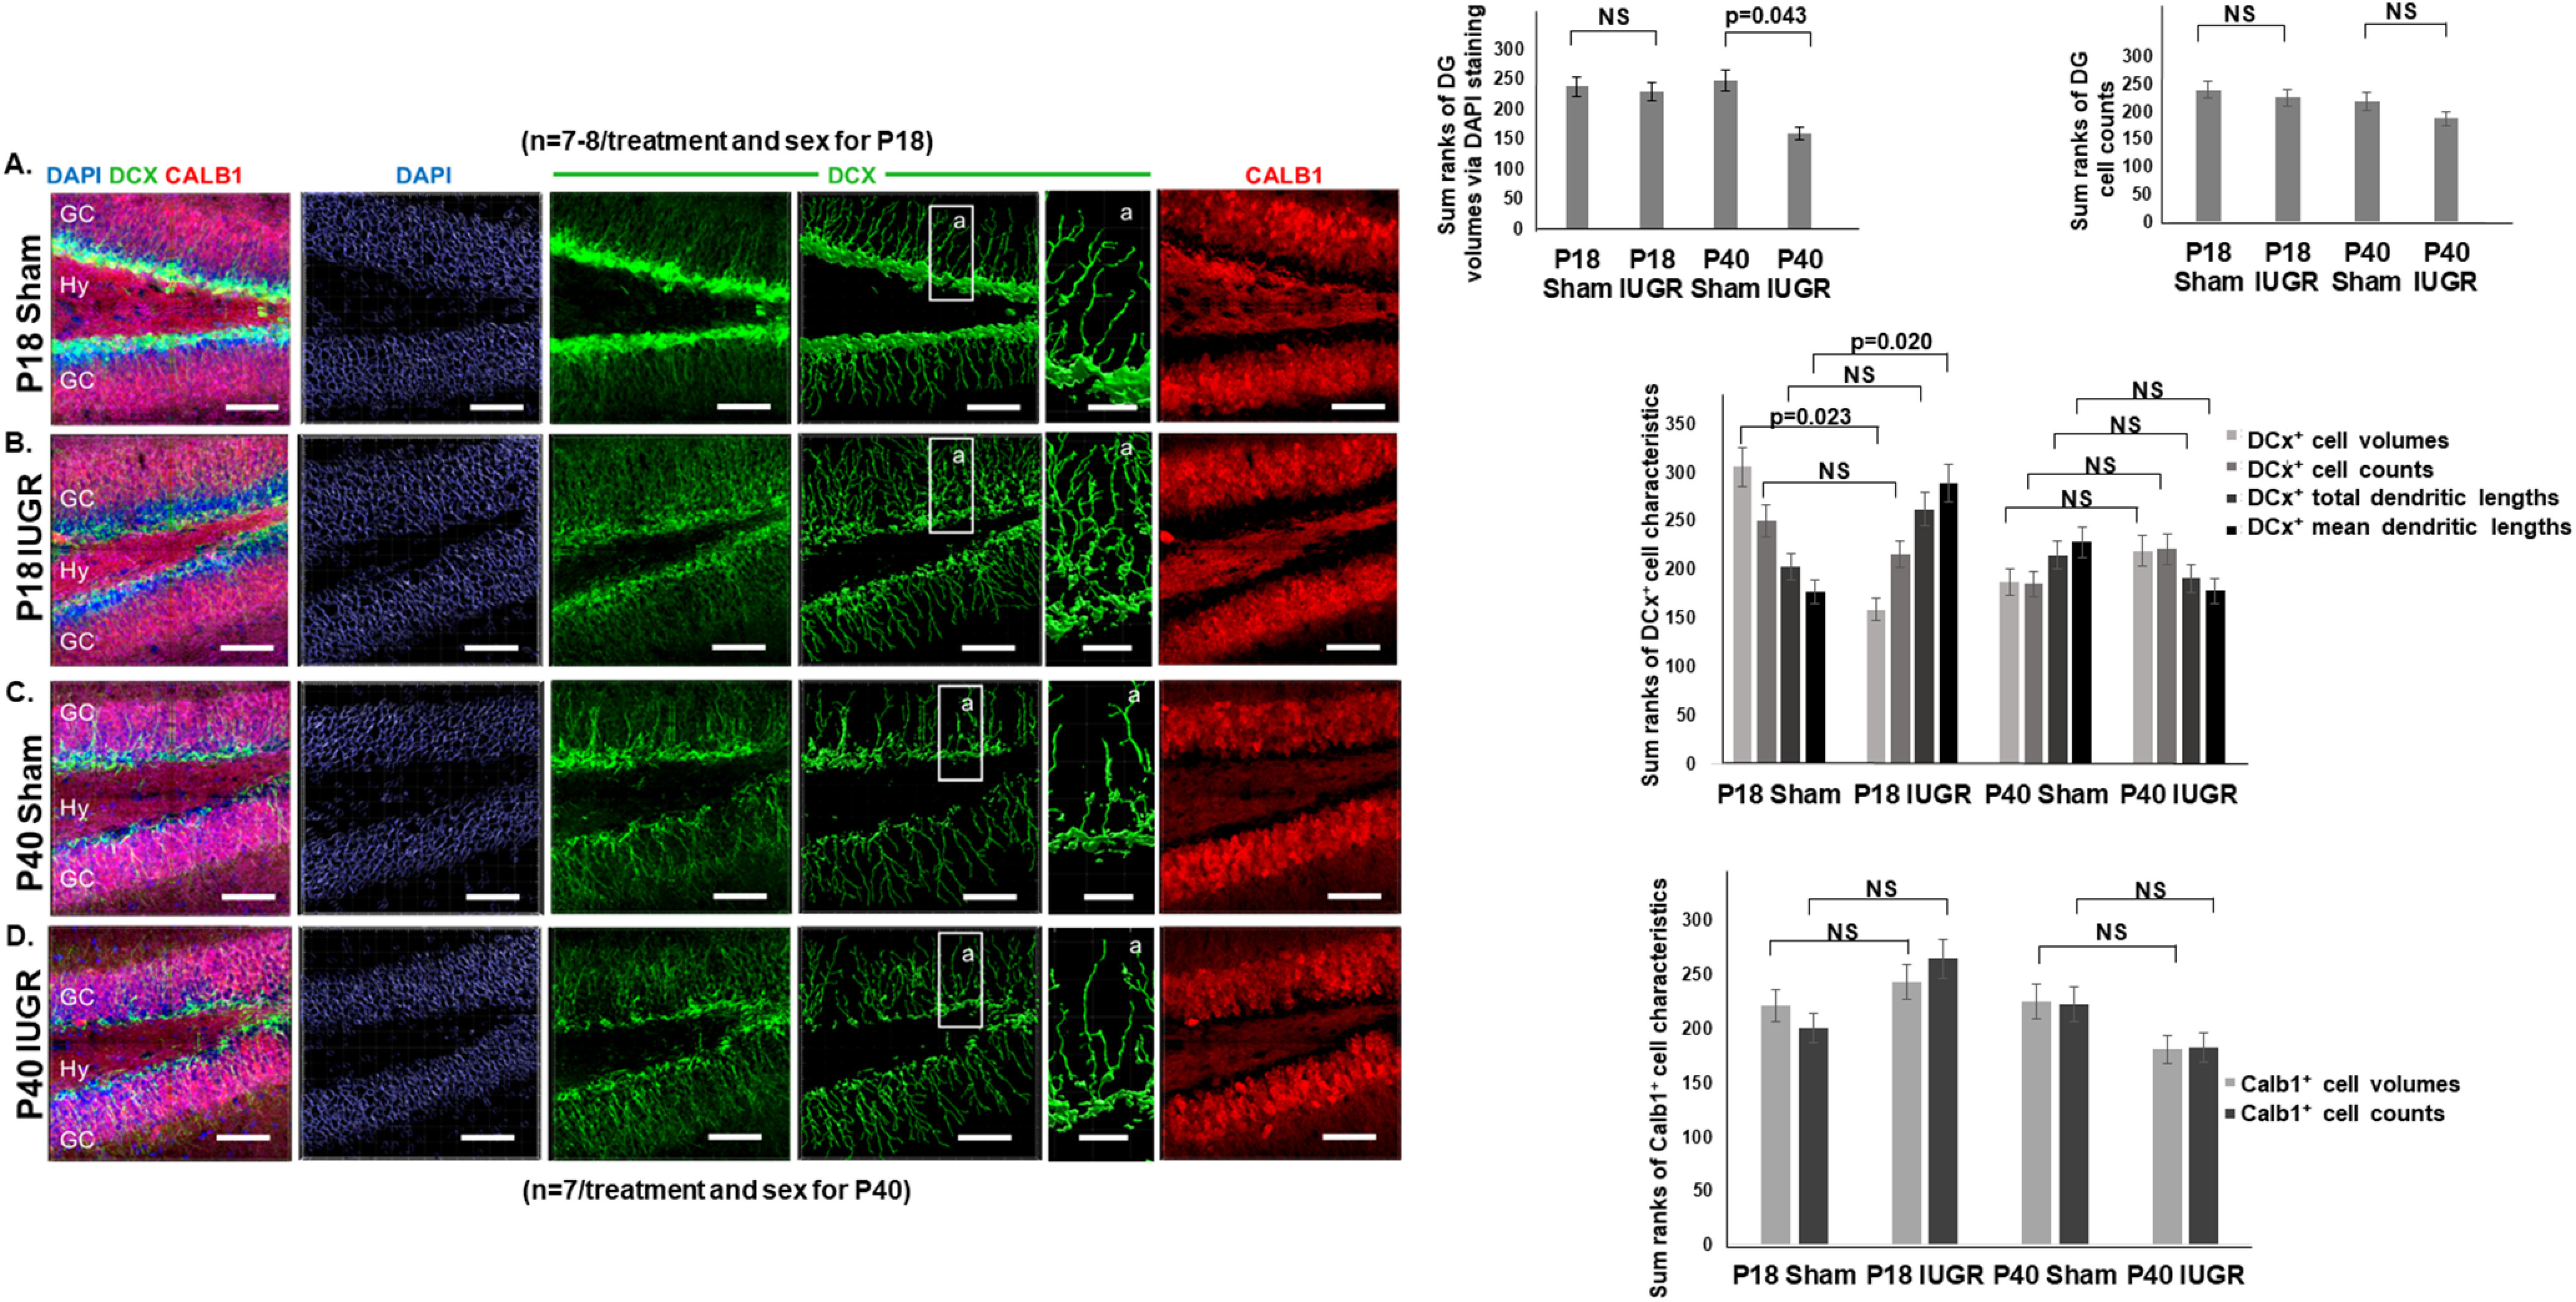
Figure 6.

A–D, Representative photomicrographs of P18 (A, B) and P40 (C, D) hippocampal DG showing double-labeling of DCX and Calb1 immunofluorescent staining. DAPI was used as a counterstain for all cell nuclei that have been rendered non-nuclear under the Imaris “DAPI surface reconstruction” mode for quantification. GC, Granule cells; Hy, hilus. Within each DCX fluorescent image in A–D, an enlarged region boxed as region a shows the DCX cell body volume and dendritic branching. Quantification of P18 sham and IUGR hippocampi using DAPI showed similar DG volumes. NS, No significance. Quantification of P40 sham and IUGR hippocampi however showed smaller DG volumes (p = 0.043). Quantification of DG cell counts showed no difference between sham and IUGR hippocampal DG at P18 or P40. Quantification of DCX+ cell characteristics showed that IUGR decreased P18 DCX+ cell volumes but increased mean dendritic lengths. Last, quantification of Calb1+ cell characteristics showed no differences in cell volumes or counts between sham and IUGR at P18 or P40 (NS). Given that these were all nonparametric variables, Mann–Whitney U test was used to compare sham and IUGR groups. No sex differences were noted.
