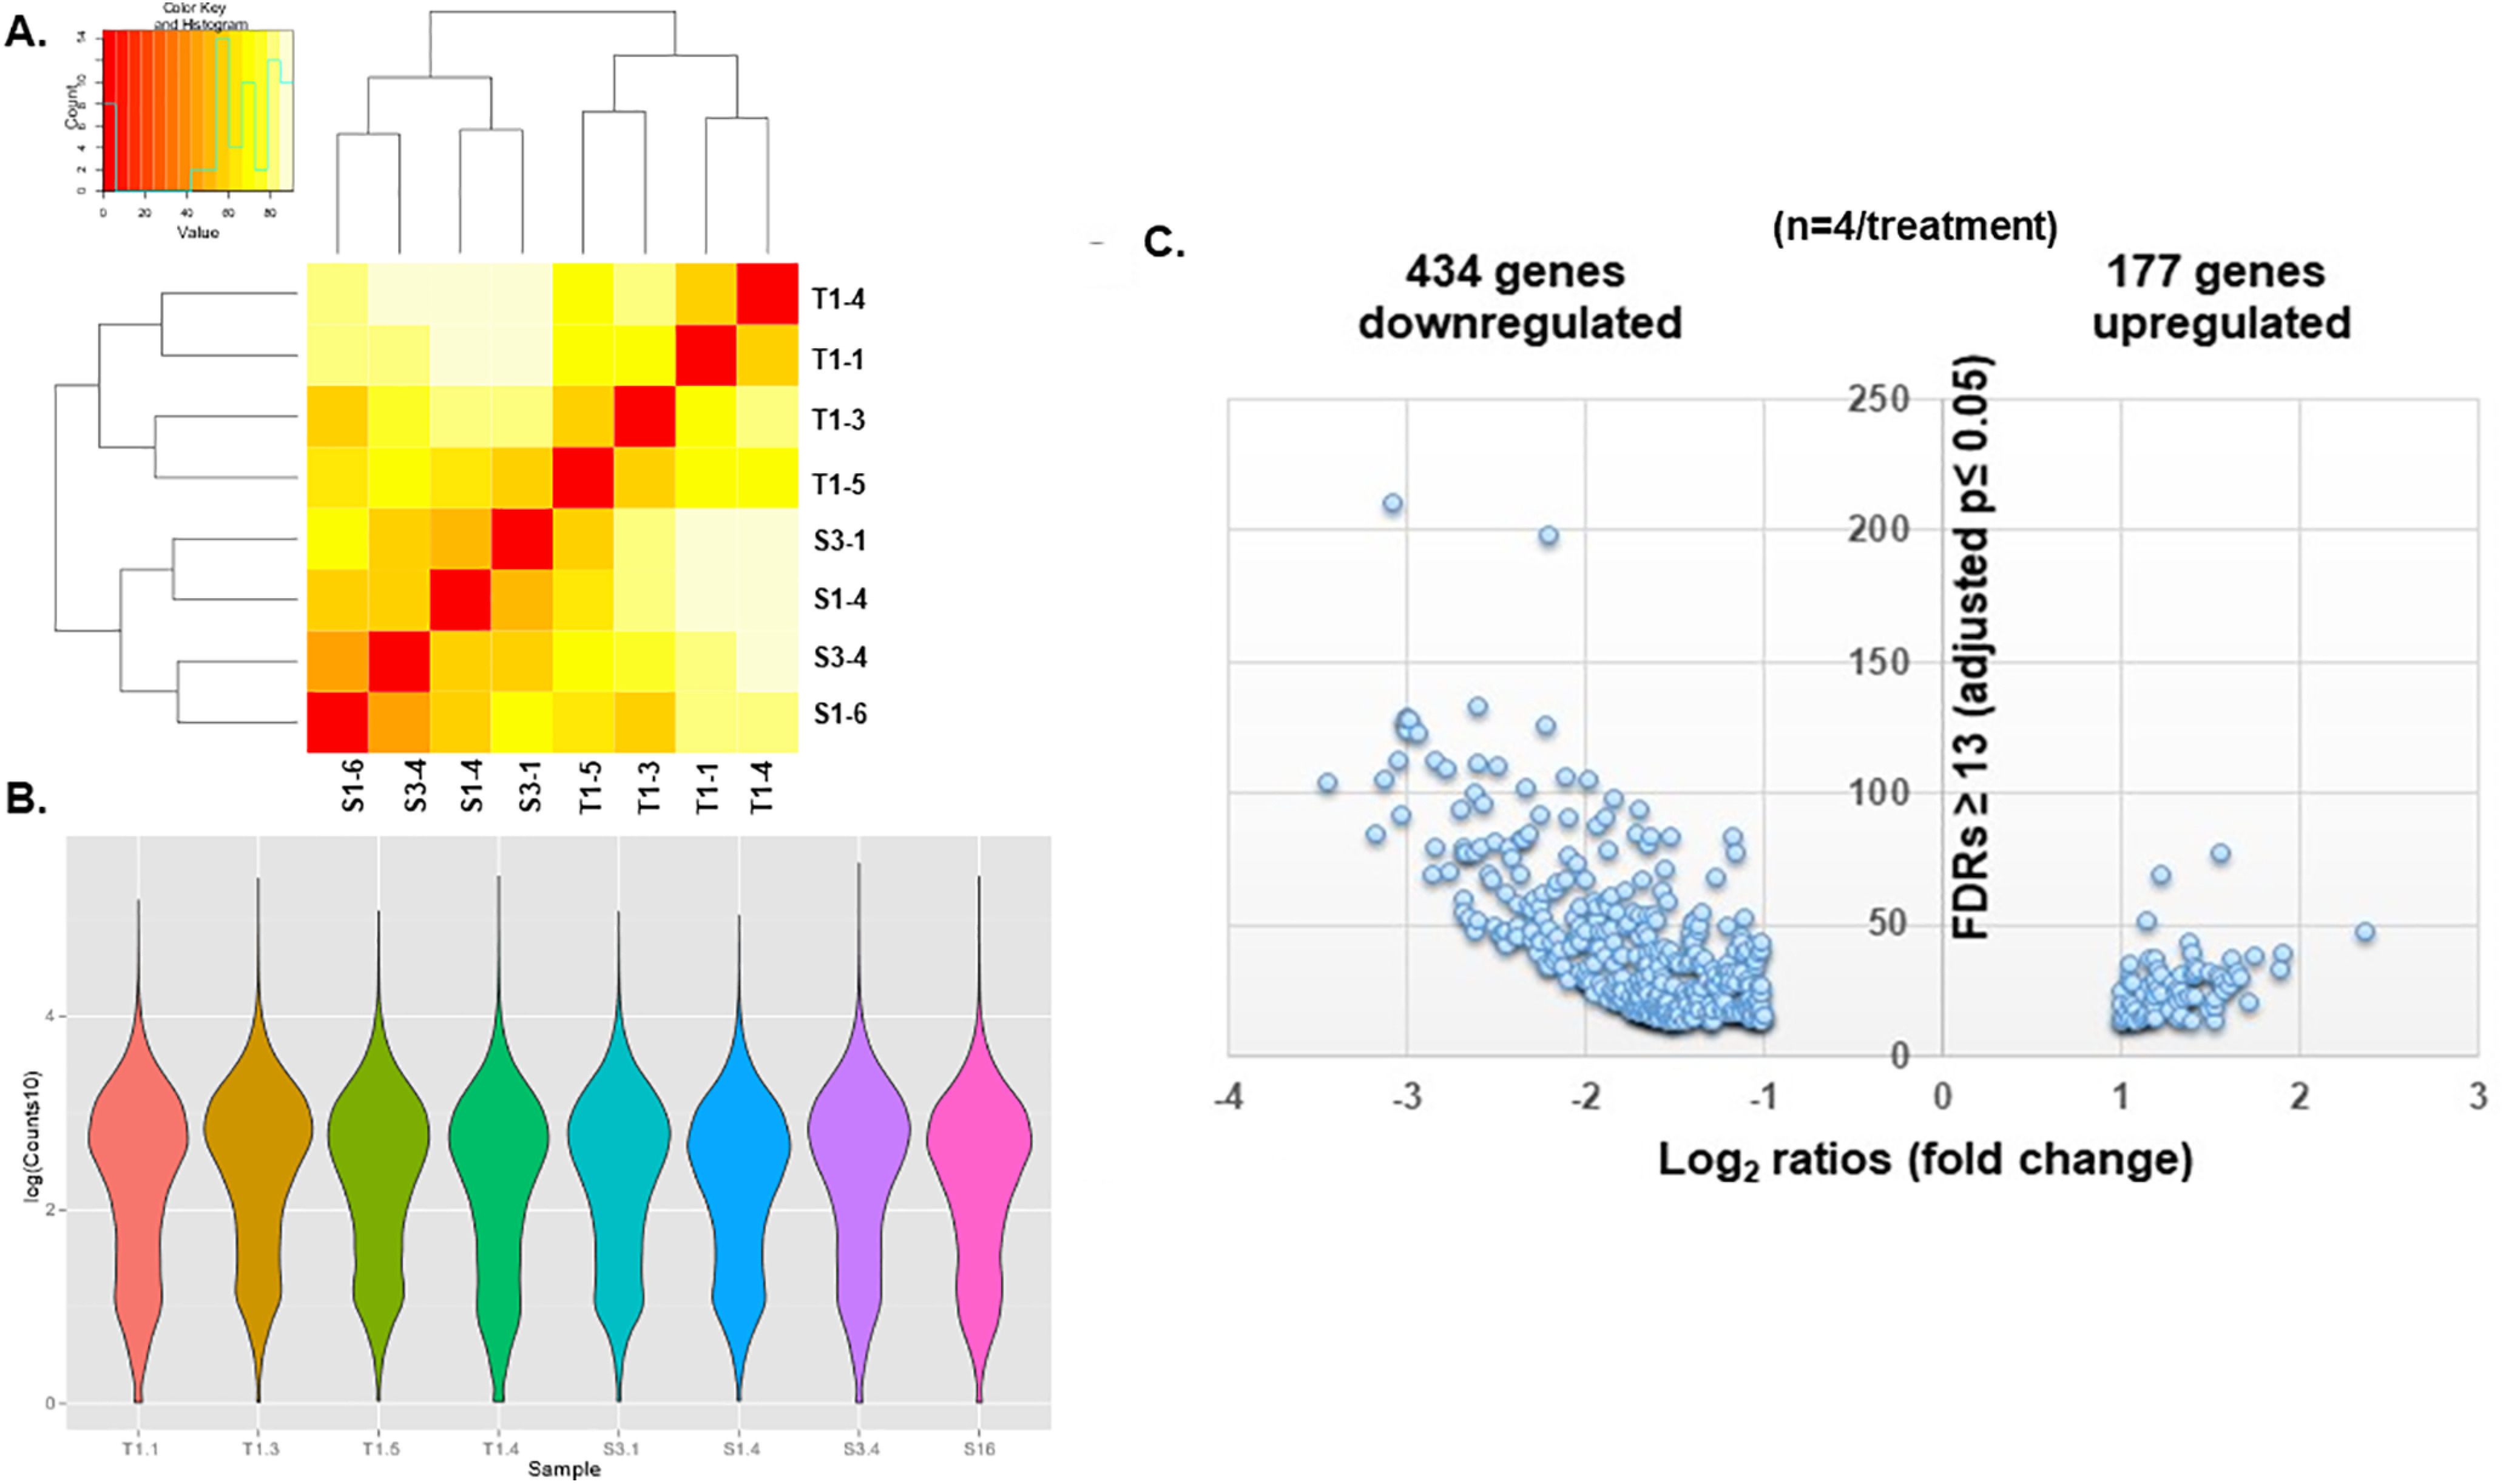
Figure 7.

A, Heat map of sham and IUGR hippocampi used for RNA-seq showing the intersample similarities in gene expression within sham (S3-1, S1-4, S3-4, and S1-6) and IUGR (T1-4, T1-1, T1-3, T1-5) groups. Red-orange color signified sample similarities between two samples, whereas light yellow-white signified sample dissimilarities between two samples. B, Violin plots of the counts in each sham or IUGR sample. The kernel density estimation shows that the distribution shapes between sham and IUGR data are similar. Wider sections of the violin plot represent a higher probability that certain genes will take on the given value, whereas the skinnier sections represent a lower probability. C, Volcano plot of the 611 differentially expressed protein-coding gene transcripts in E15.5 IUGR hippocampus via RNA-seq. A total of 434 genes (∼70%) were downregulated. The x-axis denotes log2 ratios, which are fold changes in gene expression (log2 ratios greater than or equal to +1 or less than or equal to −1 = twofold increase or decrease). The y-axis denotes false discovery rates (FDRs) ≥ 13 = adjusted p ≤ 0.05.
