

Abstract
Neuronal ceroid lipofuscinosis type 2 (CLN2 disease) is an ultra‐rare pediatric neurodegenerative disorder characterized by deficiency of the lysosomal enzyme tripeptidyl peptidase‐1 (TPP1). In the absence of adequate TPP1, lysosomal storage material accumulation occurs in the central nervous system (CNS) accompanied by neurodegeneration and neurological decline that culminates in childhood death. Cerliponase alfa is a recombinant human TPP1 enzyme replacement therapy administered via intracerebroventricular infusion and approved for the treatment of CLN2 disease. Here, we describe two allometric methods, calculated by scaling brain mass across species, that informed the human dose selection and exposure prediction of cerliponase alfa from preclinical studies in monkeys and a dog model of CLN2 disease: (1) scaling of dose using a human‐equivalent dose factor; and (2) scaling of compartmental pharmacokinetic (PK) model parameters. Source PK data were obtained from cerebrospinal fluid (CSF) samples from dogs and monkeys, and the human exposure predictions were confirmed with CSF data from the first‐in‐human clinical study. Nonclinical and clinical data were analyzed using noncompartmental analysis and nonlinear mixed‐effect modeling approaches. Both allometric methods produced CSF exposure predictions within twofold of the observed exposure parameters maximum plasma concentration (Cmax) and area under the curve (AUC). Furthermore, cross‐species qualification produced consistent and reasonable PK profile predictions, which supported the allometric scaling of model parameters. The challenges faced in orphan drug development place an increased importance on, and opportunity for, data translation from research and nonclinical development. Our approach to dose translation and human exposure prediction for cerliponase alfa may be applicable to other CNS administered therapies being developed.
Study Highlights.
WHAT IS THE CURRENT KNOWLEDGE ON THE TOPIC?
To the authors knowledge, cerliponase alfa represents the first chronically administered enzyme replacement therapy (ERT) via the intracerebroventricular (ICV) route of administration. The current literature is lacking on how model parameters can be scaled across species for ICV administered ERTs and other proteins. Although no ICV administered ERT’s were found within the literature, allometric scaling by brain/bodyweight ratio adequately predicted drug concentrations of an intrathecally administered ERT.
WHAT QUESTION DID THIS STUDY ADDRESS?
Does allometric scaling of dose and compartmental parameters calculated by brain mass scaling across species, predict first‐in‐human (FIH) exposure in patients with neuronal ceroid lipofuscinosis type 2 (CLN2) disease following a 300 mg ICV infusion of cerliponase alfa?
WHAT DOES THIS STUDY ADD TO OUR KNOWLEDGE?
Allometric scaling calculated by brain mass scaling across species, adequately predicted FIH exposure of cerliponase alfa following ICV administration in patients with CLN2 disease.
HOW MIGHT THIS CHANGE CLINICAL PHARMACOLOGY OR TRANSLATIONAL SCIENCE?
This study provides information on the PK predictions of a chronic ICV administered ERT. This data will be valuable for other central nervous system administered therapies being developed.
INTRODUCTION
Rare diseases, defined in the Orphan Drug Act of 1983 as conditions that effect fewer than 200,000 people in the United States, pose several scientific and operational challenges for drug development. For one, the safety profile of many treatments for rare diseases do not allow for testing in healthy subjects and thus phase I first‐in‐human (FIH) studies are often conducted in the intended patient population. 1 , 2 The small number of patients eligible for a clinical trial impacts the ability to obtain robust pharmacokinetic (PK), safety and efficacy data necessary to understand the drug’s characteristics within the intended patient population. This issue is compounded in pediatric conditions, such as neuronal ceroid lipofuscinosis type 2 (CLN2) disease, where the severity, progression, and irreversibility of the disease necessitates efficiently reaching an efficacious dose in all patients. In these scenarios, a tailored and strategic approach to data collection should be implemented because the safe and rapid dose escalation of patients to a therapeutic dose level should be prioritized over the full characterization of a compound’s attributes across a subtherapeutic dose range. For these reasons, special emphasis should be placed on nonclinical investigations to understand the dose (level, route, and frequency), translatable pharmacological end points, and safety of a compound prior to initiating clinical development for a rare disorder.
CLN2 disease, a form of Batten disease, is an ultra‐rare pediatric neurodegenerative disorder characterized by a deficiency of the lysosomal enzyme tripeptidyl peptidase‐1 (TPP1) caused by sequence variants in the TPP1 gene. In the absence of adequate TPP1, lysosomal storage material accumulates in the central nervous system (CNS), accompanied by neurodegeneration and neurological decline that culminates in childhood death. Disease onset typically occurs between the ages of 2 and 3 years with profound neurological loss by age 8 and death between the ages of 10 and 15. 3 , 4 The estimated worldwide incidence of CLN2 disease is 1 in 200,000 live births. 5 Prior to the US Food and Drug Administration (FDA) and the European Medicines Agency (EMA) approvals of cerliponase alfa in 2017, there were no approved disease‐altering therapies for CLN2. 6
Cerliponase alfa, a recombinant proenzyme form of human TPP1, is an enzyme replacement therapy administered via intracerebroventricular (ICV) infusion to bypass the blood‐brain‐barrier. A global phase I/II open label dose escalation study was conducted to study the effects of cerliponase alfa administered every 2 weeks (Q2W) in patients with a confirmed deleterious variant in the CLN2 gene. 7 Due to the irreversible nature and severity of CLN2 disease, nonclinical data were leveraged to inform clinical dose selection, including PK data from normal monkeys and PK and pharmacodynamic data from dogs spontaneously homozygous for TPP1 deficiency with pharmacologically translatable endpoints. In TPP1‐null dogs, repeat ICV administration of cerliponase alfa resulted in widespread distribution and uptake in the CNS, clearance of lysosomal storage material, and delayed neurodegenerative onset and progression. 8 , 9 , 10
Here, we describe two allometric approaches that informed the human dose selection and exposure prediction of cerliponase alfa based on preclinical studies performed using monkeys and a dog model of CLN2 disease: (1) scaling of dose using a human‐equivalent dose (HED) factor; and (2) scaling of compartmental PK model parameters. This approach to dose translation and human exposure prediction for cerliponase alfa may be applicable to other CNS administered therapies being developed.
METHODS
Nonclinical PK assessments
Nonclinical cerliponase alfa concentration time data in CSF were obtained from monkeys and dogs, as described below. Cynomolgus monkey CSF concentration data was obtained following a single ICV administration (~ 4‐h infusion duration) of 5 (n = 3), 14 (n = 9), or 20 (n = 3) mg cerliponase alfa to cynomolgus monkeys. CSF PK samples were collected from the lumbar‐cistern at predose and ~ 0.5, 1.5, and 3.5 h during infusion and 0.5, 1, 2, 4, 8, 12, 24, 36, 48, 72, 96, 144, 168, 216, 264, and 336 h after the end of infusion. Dachshund dog (wild type and TPP1‐null) CSF concentration data was obtained following a single ICV administration (~ 2‐or 4‐h infusion duration) of 4 (n = 2) or 16 (n = 6) mg cerliponase alfa to TPP1‐null and wild‐type dachshund dogs. CSF PK samples were collected from the lumbar cistern at predose and approximately halfway through infusion, at the end of infusion, and 0.5, 1, 4, 12, 24, 48, 72, 120, and 168 h after the end of infusion. Additional details of these studies have been reported previously (see also Supplementary Material). 8 , 11
Clinical PK assessments
Clinical cerliponase alfa concentration‐time data in CSF were obtained from the FIH study, as described here in brief. The FIH study was a global two‐part phase I/II open label study in patients with CLN2 disease administered cerliponase alfa once every other week by ICV infusion (~ 4‐h infusion duration). A total of 24 patients were enrolled in the study, with a median [range] baseline age of 4 [3–8] years and baseline bodyweight of 17.5 [14.5–26.0] kg. Part 1 of the study was a dose escalation phase in which patients (n = 10) were enrolled into 3 dose escalation cohorts evaluating 30 (n = 3), 100 (n = 3), and 300 (n = 4) mg cerliponase alfa Q2W. Dose escalation cohorts were enrolled sequentially, with the next higher dose cohort enrolling three to four naïve patients upon approval by an independent data and safety monitoring committee. Dose escalation within cohorts also occurred upon independent data and safety monitoring committee approval (i.e., patients enrolled at 30 or 100 mg were escalated to 300 mg). Once the dose escalation phase was completed, part 2 of the study enrolled all additional patients (n = 14) into a stable dosing period of 300 mg once every other week for at least 48 weeks. Twenty‐three of the 24 patients enrolled completed at least 48 weeks of therapy at 300 mg. CSF PK samples were drawn from the lateral ventricle of the brain using the ICV port following the first infusion, the first infusion at each new dose level during the dose escalation phase, and during weeks 5 and 13 of the stable dose period. CSF samples were collected predose and 0.25, 4, 8, 20, 72, and 120 h after the end of infusion. Additional trough predose CSF samples were collected every 4 weeks whenever serial PK samples were not collected. Baseline demographic characteristics of the patients and the clinical results of the FIH study are summarized elsewhere (see also Supplementary Material). 7
Pharmacokinetic assays
A sandwich enzyme‐linked immuno‐sorbent assay (ELISA) was characterized to measure cerliponase alfa in dog CSF. 8 The lower limit of quantitation (LLOQ) was 0.0009 μg/ml cerliponase alfa in dog CSF. A sandwich ELISA was also developed and characterized to measure cerliponase alfa in cynomolgus monkey CSF. 10 The LLOQ was 0.010 μg/ml cerliponase alfa in monkey CSF. Sandwich electrochemiluminescent immunoassays were developed and validated to quantitate cerliponase alfa in human clinical CSF samples. The LLOQ for the human CSF assay was 0.020 μg/ml. For both nonclinical and clinical assays, quality controls consisting of defined concentrations of cerliponase alfa in normal dog, cynomolgus monkey, or human CSF were generated and run on the same plates as the study samples to monitor assay performance throughout sample testing.
Allometric scaling methods to determine the human equivalent dose and expected CSF exposure
The HED and expected CSF exposure were determined using allometric methods based on brain mass across species. The human brain reaches on average 75% of its adult mass by age 2 and ~ 100% by age 5 years. The average brain mass of 2 to 5‐year‐old humans ranges from 1050 to 1400 g. In this study, an average of 1000 g was assumed due to the progressive brain atrophy in patients with CLN2 disease. 12 The average TPP1‐null dachshund brain mass used in this analysis was 50 g and the average cynomolgus monkey brain mass used in this analysis was 65 g (based on internal PK/CNS distribution studies). The human dose was predicted by scaling the nonclinical dose across species using an HED factor, which was calculated as the ratio of brain mass in the patient with CLN2 disease and each nonclinical species (HED factor of 20 for the Dachshund dog (1000 g / 50 g) and 15 (1000 g / 65 g) for the cynomolgus monkey). The efficacious nonclinical dose was multiplied by the HED factor to determine the target efficacious dose in humans.
Human CSF PK was predicted by scaling the compartmental PK parameters across species and simulating the concentration‐time profile in the patients with CLN2 disease following a range of doses. An allometric scaling coefficient of 0.75 was assumed for clearance parameters CL and Q, and an exponential value of 1 was assumed for volume parameters V1 and V2. 13 , 14 To evaluate the appropriateness of cross‐species allometric scaling, compartmental PK parameters were first scaled from monkey to dog and dog to monkey to ensure reasonable PK profile predictions prior to scaling to humans.
Evaluation of clinical dose scaling and CSF exposure predictions
The dose scaling approach was evaluated by comparing the exposure parameters (maximum plasma concentration [Cmax] and area under the curve [AUC]) associated with efficacy from the nonclinical species to the exposure obtained in the clinic at their respective doses. The accuracy of the predicted exposure parameters was summarized using a mean absolute percentage error (MAPE). The scaling of compartmental parameters was evaluated graphically by comparing the predicted human profile (scaled from the monkey and dog) to the observed clinical profiles following a 300 mg dose. Noncompartmental analysis was then conducted on the simulated profile and the exposure parameters (Cmax and AUC) were compared with those observed clinically. Additionally, the scaled compartmental model parameters were compared to the compartmental model parameters estimated using the clinical data.
Software/modeling methods
Population PK analysis was conducted using NONMEM (version 7.3; ICON Development) and population PK parameters were estimated using parametric maximum likelihood with first‐order conditional estimation with interaction. Concentration values less than the LLOQ of the analytical assay were set to missing. Model selection was based on successful minimization, diagnostic plots, a decrease in the SEs for model parameter estimates, and a decrease in the objective function by greater than 3.84. Basic goodness‐of‐fit plots were examined for adequate fit and to confirm no evidence of bias or systematic lack of fit. Outliers were explored graphically and excluded based on implausibility or inconsistency with the temporal profile. Potential covariates, including sex, age, race, bodyweight, body mass index, and CLN2 score, were explored graphically but statistical analysis on covariates was not performed due to the low number of observations for each covariate group. Noncompartmental analysis (NCA) was conducted using Phoenix WinNonlin (version 6.1 or later) to generate exposure parameters Cmax, representing the maximum CSF concentration, and AUC0–∞, defined as the area under the concentration‐time curve from time 0 to infinity. Concentration values less than the LLOQ of the analytical assay were set to zero if they occurred at a time prior to Cmax and were set to missing if they occurred at a time after Cmax. Data processing, summary statistics, and graphics were done using R (version 3.4.1 or later, The R Foundation) and RStudio (version 1.1.463).
RESULTS
Nonclinical PK characterization
NCA was conducted on the observed CSF cerliponase alfa concentration‐time data from dogs and monkeys. Exposure parameters Cmax and AUC are presented in Table 1 and are described in detail elsewhere. 8 , 11 CSF exposure parameters observed following a 16 mg dose in the dog were similar to those observed following a 20 mg dose in the monkey.
TABLE 1.
Evaluation of PK parameter predictions from cross‐species validation
| Data | Dose | N | Mean (SD) Cmax [µg/ml] | Mean (SD) AUC0‐∞ [µg‐h/ml] | MAPE a | ||||
|---|---|---|---|---|---|---|---|---|---|
| Observed | Predicted | PE | Observed | Predicted | PE | ||||
| Monkey b | 5 | 3 | 317 (304) | 215 | −32% | 1045 (929) | 1530 | 46% | 36% |
| 14 | 6 | 968 (323) | 602 | −38% | 5770 (1110) | 4280 | −26% | ||
| 20 | 3 | 1580 (2210) | 860 | −45% | 8670 d | 6110 | −30% | ||
| Dog c | 4 | 2 | 473 (246) | 282 | −40% | 1880 (598) | 1840 | −2% | 20% |
| 16 | 6 | 1460 (913) | 1130 | −23% | 6450 (3450) | 7360 | 14% | ||
Abbreviations: AUC0–∞, area under the concentration‐time curve from time 0 to infinity; Cmax, maximum plasma concentration; MAPE, mean absolute percentage error; PE, percent prediction error; PK, pharmacokinetic.
MAPE calculated as the mean of the absolute values of the PEs for Cmax and AUC0‐∞ across dose levels for each species.
Compartmental PK parameters from the dog were scaled to the monkey and simulated to predict the PK in the monkey.
Compartmental PK parameters from the monkey were scaled to the dog and simulated to predict the PK of the dog.
Elimination rate constant could not be determined for one animal and thus AUC0–∞.
Two independent nonclinical compartmental PK models were developed: one to characterize the cynomolgus monkey CSF PK and one to characterize the dachshund dog CSF PK. A total of 205 observations from 15 animals contributed to the monkey model development and 75 observations from 8 animals contributed to the dog model development. The individual animal CSF concentration data over time is shown in Figure 1. Various structural models were assessed during model development, including a one, two, and three‐compartment model. The nonclinical data were best fit to a two‐compartment model with a depot‐dosing compartment described by a first‐order absorption process (Figure S1 and Figure S2 for monkeys and dogs, respectively).
FIGURE 1.
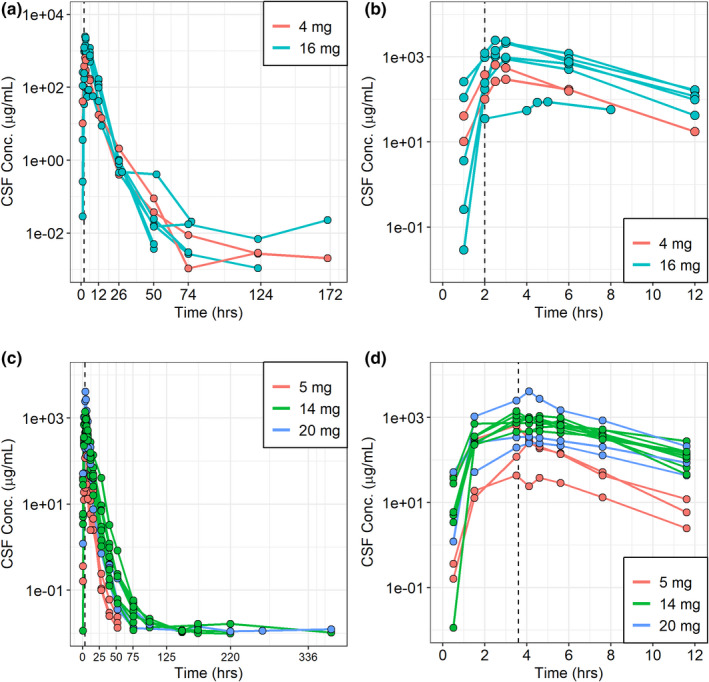
Individual animal concentration‐time profiles in dogs (a and b) and monkeys (c and d). Plots (a) and (c) depict the entire profile while plots (b) and (d) depict a partial profile up to 12 h after the start of the infusion. The vertical dashed line represents the end of the infusion, which typically occurred at 2 h in the dogs and 3.6 h in the monkeys. CSF, cerebrospinal fluid
This structural model allowed for biphasic elimination and accounted for the distribution of cerliponase alfa between the ventricle (dosing compartment) and the lumbar spinal cord subarachnoid space (sampling), which is illustrated by the delay between end of infusion and Cmax. Parameter estimates for the final dog and monkey models are shown in Table 2.
TABLE 2.
Nonclinical and clinical population pharmacokinetic parameters
| Parameter (Units) | Parameter estimate | |||||
|---|---|---|---|---|---|---|
| Dogs | Monkeys | Estimate scaled to humans | Humans | |||
| Dogs | Monkeys | |||||
| Population parameters [RSE] | Population parameters [RSE] | Scaled parameter | Scaled parameter | Population parameters [RSE] | Bootstrap result median [95% CI] | |
| ka (1/h) | 0.733 [29%] | 3.56 [34%] | 0.733 a | 3.56 a | – b | – b |
| V1 (ml) | 8.36 [15%] | 13.5 [15%] | 167 | 208 | 225.7 [5.8%] | 222 [192–253] |
| CL (ml/hr) | 2.82 [16%] | 2.98 [14%] | 26.7 | 23.1 | 30.7 [5.4%] | 31 [27–34] |
| V2 (ml) | 0.271 [53%] | 0.776 [42%] | 5.42 | 11.9 | 3.71 [19.8%] | 4.1 [3–44] |
| Q (ml/h) | 0.00567 [81%] | 0.00416 [31%] | 0.0536 | 0.0323 | 0.0805 [13.8%] | 0.085 [0.058–0.78] |
| IIV CV [RSE, shrinkage] | IIV CV RSE, shrinkage] | |||||
| ω2V1 | – c | – c | – d | – d | 25.3% [34.4%, 18.45] | 24% [11% –35%] |
| ω2 CL | 12.5% [1.74%, 6.87] | 15.9% [31%, 1E−10] | – d | – d | 31.1% [23.1%, 3.90] | 30% [22%–37%] |
| Residual error [RSE, shrinkage] | Residual error [RSE, shrinkage] | |||||
| σ2 Proportional | 0.749 [24%, 1.55] | 0.468[20%,1.78] | – d | – d | 0.412 [12.1%, 2.54] | 0.40 [0.32–0.51] |
Abbreviations: CI, confidence interval; CL, clearance; CV, coefficient of variation; IIV, interindividual variability.
Ka was not scaled to a human estimate and was assumed to be the same as the nonclinical species.
Ka not shown because human model was not described by first‐order absorption.
IIV was not assessed on V1 for the dog and monkey model.
IIV and residual error were not scaled to human estimate.
Nonclinical model parameters were then scaled across species by brain mass and an overlay of the simulated profiles with the observed data matched as expected (Figure 2). After conducting NCA on the simulated profiles, cross‐species qualification yielded an MAPE in exposure parameters of 20% when using monkey parameters to predict exposure in the dog and 36% when using dog parameters to predict exposure in the monkey (Table 1). Following cross‐species qualification, the visual match in the concentration‐time profiles in conjunction with the accuracy in exposure parameters Cmax and AUC supported the further extrapolation to allometrically predict human exposure.
FIGURE 2.
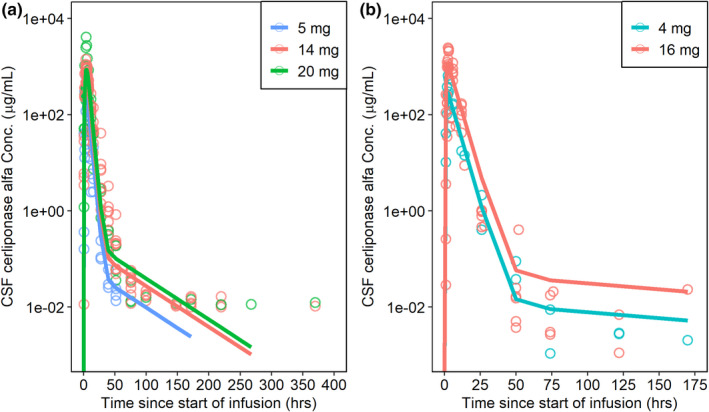
Cross‐species qualification. Observed data is indicated as open circles while simulated data is shown as colored lines. (a) Observed concentrations in the monkey overlaid with the predicted monkey profile scaled from the dog; (b) observed concentrations in the dog overlaid with the predicted dog profile when scaled from the monkey. CSF, cerebrospinal fluid
Human equivalent dose and predicted CSF exposure
The human equivalent to the 16 mg dose in the TPP1‐null dog was determined to be the target clinical dose due to the preservation in cognitive function and brain morphology observed at the 16 mg dose level. 8 , 9 A 16 mg dose in the dog and a 20 mg dose in the monkey translated to a clinical dose of 320 and 300 mg dose, respectively. The PK parameters obtained at these dose levels in dogs and monkeys were comparable with a mean Cmax and AUC of 1460 µg/ml and 6450 µg‐h/ml in the dog and 1580 µg/ml and 8670 µg‐h/ml in the monkey (Table 1), which supported the approach to scale dose by brain mass across species.
The predicted human concentration‐time profiles at 30, 100, and 300 mg by scaling of compartmental model parameters were similar when scaled from the dog or monkey (Figure 3). The predicted human Cmax and AUC from NCA of the simulated profiles following a 300 mg dose was 1090 µg/ml and 11,200 µg‐h/ml, respectively, when scaled from the dog and 1100 µg/ml and 13,000 µg‐h/ml, respectively, when scaled from the monkey (Table 3). These predicted human NCA parameters were similar to the observed NCA parameters in the nonclinical species at equivalent doses (i.e., 16 mg in dogs and 20 mg in monkeys), which further supported the approach used to determine the HED (Table 3).
FIGURE 3.
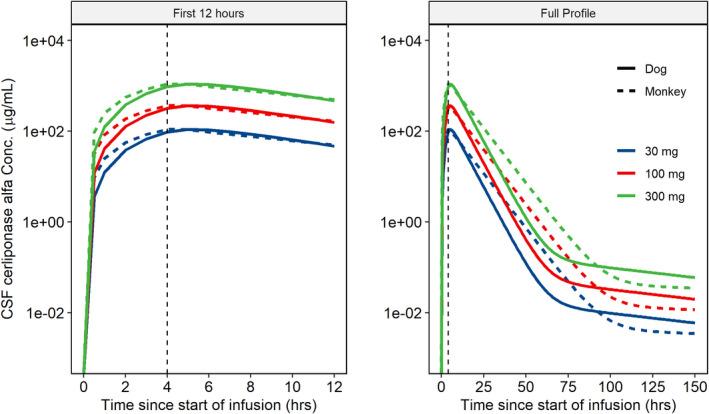
Predicted human CSF PK profiles after scaling compartmental PK model parameters from dogs and monkeys. Predicted CSF PK profiles in human using compartmental model parameters scaled from the dog (solid lines) and monkey (dashed lines) over 150 h after start of infusion (right) and the initial 12 h (left). The vertical dashed line represents the end of the infusion. CSF, cerebrospinal fluid; PK, pharmacokinetic
TABLE 3.
Evaluation of human exposure predictions after scaling dose and model parameters
| Scaled by | Species | Dose | HED | N | Cmax | AUC0‐∞ | MAPE a | MAPE b (Combined methods) | |||
|---|---|---|---|---|---|---|---|---|---|---|---|
| Predicted Mean (SD) (µg/ml) | PE | Predicted Mean (SD) (µg‐h/ml) | PE | Monkey | Dog | ||||||
| Dose | Dog | 16 | 320 | 6 | 1460 (913) | −8% c | 6450 (3450) | −37% c | 21% | 19% | 30% |
| Monkey | 20 | 300 | 3 | 1580 (2210) | 6% | 8670 e | −9% | ||||
| Model parameters d | Dog | 300 | NA | NA | 1090 | −27% | 11200 | 18% | 28% | ||
| Monkey | 300 | NA | NA | 1100 | −26% | 13000 | 36% | ||||
The observed mean (SD) exposure obtained in the clinic following a 300 mg dose (n = 17) was 1490 (942) and 9530 (4140) for Cmax (µg/ml) and AUC (µg‐h/ml), respectively.
Abbreviations: AUC0–∞, area under the concentration‐time curve from time 0 to infinity; Cmax, maximum plasma concentration; HED, human equivalent dose; MAPE, mean absolute percentage error; PE, prediction error.
MAPE calculated as the mean of the absolute values of the PEs for Cmax and AUC0‐∞ across species for each method.
MAPE calculated as the mean of the absolute values of the PEs for Cmax and AUC0‐∞ across methods for each species.
Cmax and AUC were normalized by dose before calculating % errors.
Predicted exposure parameters Cmax and AUC calculated from a simulated exposure profile.
There were 2 that the elimination rate constant could not be determined for one animal and thus AUC0‐∞.
Clinical PK characterization
The PK of cerliponase alfa in the patients with CLN2 disease, as characterized by NCA, has been described in detail previously, 15 and is included in Table 3.
In this study, a compartmental model using the clinical CSF PK data was developed to further evaluate the approach used to determine the target clinical dose and expected CSF exposure. In all, 397 observations across intensive and sparse concentration‐time data from 24 patients contributed to the model development. Eight observations (2%) from two patients were excluded from model development due to one anomalous PK profile (7 samples) and one sample that did not fit the temporal component of the PK profile. During model development, interindividual variability (IIV) was assessed on all PK parameters and between‐occasion variability (BOV) was assessed on CL and V1. IIV and BOV were assumed to be log‐normally distributed with a mean of zero and a variance of ω2. A proportional and a combined‐error model (additive and proportional) were assessed to model the residual variability. Log‐transformed concentration data and both log‐transformed prediction and concentration data (both sides) were assessed in model development but did not improve overall model fit. Various structural model forms were assessed during model development, including a one, two, and three‐compartment model. Although the three‐compartment model resulted in favorable conditional weighted residual versus time diagnostic plots, the high variability in parameters estimates suggested a simpler model with less variability would better describe the data. The data were best fit to a two‐compartment model with IIV on CL and V1, covariance between CL and V1, and a proportional error model. Overall, the model described the data well, although with slight model misspecification indicated for the greatest concentrations after dosing suggesting an underprediction of Cmax (Figure S3). Parameter estimates for the final model are shown in Table 2. In the clinic, cerliponase alfa was administered to and sampled from the lateral ventricles, which resulted in Cmax occurring at the first sampling time point and supported the absence of first order absorption (ka) in the clinical model. The remaining structural model parameters were similar to those scaled from the nonclinical models. Potential covariates were explored graphically but statistical analysis on covariates was not performed due to the low number of observations for each covariate group.
Evaluation of the approach to HED determination and CSF exposure predictions
The observed CSF exposure in patients with CLN2 disease at the determined HED of 300 mg was within 2‐fold of the observed CSF exposure in the nonclinical species. The MAPE across exposure parameters was 21% after scaling by dose. In addition, the observed human CSF PK profiles were similar to the predicted PK profiles (Figure 4), with noncompartmental model parameter estimates similar to the scaled model parameters from the nonclinical species (Table 2). The MAPE across exposure parameters was 28% when comparing the NCA parameters from the observed and simulated PK profiles.
FIGURE 4.
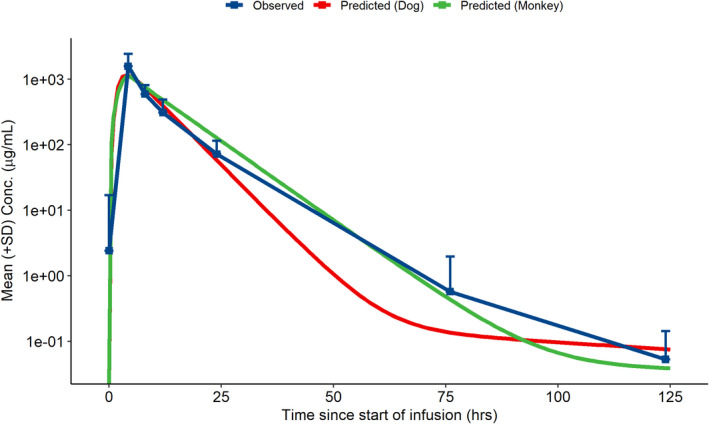
Human CSF PK profiles from nonclinical predictions and observed data following a single 300 mg ICV infusion in CLN2 patients. Predicted human CSF PK profile from scaling of compartmental parameters from dogs (red) and monkeys (green) with the observed mean (+SD) of the observed CSF PK in patients with CLN2 disease (N = 17) following a single ICV infusion of 300 mg cerliponase alfa. CLN2, Neuronal ceroid lipofuscinosis type 2; CSF, cerebrospinal fluid; ICV, intracerebroventricular; PK, pharmacokinetic
DISCUSSION
The challenges faced in orphan drug development place an increased importance on, and opportunity for, data translation from research and nonclinical development. Here, we described an approach based on allometric methods, calculated by scaling brain mass across species, that informed the human dose selection and CSF exposure prediction of cerliponase alfa based on nonclinical studies performed using wild‐type monkeys and a dog model of CLN2 disease. The approach consists of: (1) scaling of dose using an HED factor based on brain mass; and (2) scaling of compartmental PK model parameters to predict human PK profiles. Both scaling of dose and model parameters produced human CSF exposure predictions within twofold of the exposure observed in patients with CLN2 disease. 16 , 17 The MAPE values across species were similar when scaling by dose and model parameters (21% and 28%, respectively), supporting the consistency and appropriateness of each approach.
Mouse and dog models of CLN2 disease recapitulate the pathology and clinical signs of human disease and were therefore leveraged to streamline clinical dose selection. In a conditional TPP1 knockout mouse model, expression of 6% of normal TPP1 activity dramatically attenuated disease, suggesting that achieving greater than or equal to 6% of normal TPP1 activity with therapeutic intervention is likely to provide significant therapeutic benefit. 18 The TPP1‐null dog model is homozygous for a frameshift mutation in the TPP1 gene leading to a deficiency of TPP1 activity similar to that in human patients with CLN2 disease with the most severe disease signs. 19 Chronic administration of cerliponase alfa to juvenile TPP1‐null dogs resulted in significant, dose‐dependent attenuation of disease progression and improvement in translatable pharmacological end points, including gait, motor function, brain morphology, cognitive function, and lifespan, at the 16 mg once every other week dose level. 8 , 9 In addition to studies using animal models of CLN2 disease, a wild‐type cynomolgus monkey study demonstrated that following a single ICV infusion, TPP1 levels in the brain and spinal cord were several fold greater than endogenous levels for greater than 14 days indicating potential for sustained enzyme activity. 11
A dose of 20 mg in the monkey produced similar CSF PK parameters to those following the pharmacologically active dose of 16 mg in the dog model of disease and approximated a 300 mg dose in humans. 8 , 11 After 300 mg ICV infusion, human cerliponase alfa Cmax and AUC values in CSF were comparable to or greater than those obtained in both the dog and monkey, which is consistent with the similar CSF terminal half‐life observed across species. 15 This suggests a similar time above Kuptake, defined as the cerliponase alfa concentration at which cellular uptake is half the maximal rate, for CSF concentrations across species; ~ 2 to 3 days postdose in dogs and monkeys and ~ 4 days postdose in humans. The time above Kuptake enabled widespread tissue distribution characterized to most superficial and deep brain tissues by likely maintaining a concentration gradient across the CSF tissue barrier.
In addition to the target dose level, the dose frequency and route of administration evaluated clinically also leveraged knowledge gained from nonclinical studies. Dose frequency was selected based on an in vivo PK/CNS distribution study in monkeys and an in vitro assessment of the lysosomal half‐life of cerliponase alfa. Following a single ICV dose in cynomolgus monkeys, the mean TPP1 half‐life was 3–15 days. 11 An in vitro assessment of the lysosomal Kuptake of TPP1 indicated efficient uptake from the plasma membrane to the lysosomal compartment with a lysosomal half‐life of 11.5 days in TPP1 deficient fibroblasts. 20 The TPP1 tissue half‐life (3–15 days), in conjunction with the lysosomal half‐life (11.5 days) suggested a biweekly dosing regimen would result in sustained lysosomal levels of TPP1 throughout the CNS.
The ICV infusion was selected as the clinical route of administration based on nonclinical investigations and practical considerations. Dogs and monkeys were chosen as nonclinical test species because their CNS and CSF parameters are more similar to humans compared with rodents, including a more complex larger brain and similar rate of CSF turnover. 21 , 22 Additionally, monkeys have a semi‐upright posture making CNS distribution studies in monkeys more likely to be representative of human brain distribution. Three different routes of administration were evaluated nonclinically: ICV (dogs and monkeys), intrathecal‐cisternal (dogs), and intrathecal‐lumbar (monkeys). Overall, ICV administration resulted in greater biodistribution of cerliponase alfa to deep brain structures adjacent to the ventricles (thalamus, striatum, and midbrain) than intrathecal‐cisternal and intrathecal‐lumbar routes in dogs and monkeys. 8 , 11 Direct access to the ventricles was thought to maximize the distribution of cerliponase alfa throughout the CNS because the ventricles are the source of CSF production, and thus would allow for drug to be carried downstream to brain tissues by CSF flow. A similar result in drug biodistribution was observed in patients with intraocular lymphoma where intraventricular administration of rituximab resulted in 10–30‐fold higher CSF concentrations than intrathecal lumbar administration at the same dose level. 23 In addition to the increased biodistribution shown following ICV infusions, ICV devices were already approved for pediatric use and serve as a single access site avoiding the risk of repeated intrathecal punctures. 24
Infusion conditions were selected primarily to minimize the effects on intracranial pressure due to alterations of CSF chemistry. The relative CSF turnover rates from the nonclinical species were compared to the natural CSF turnover rates in pediatric humans. The infusion rates studied in the dachshund dog and cynomolgus monkey were ~ 21% (0.6 ml/h vs. 2.89 ml/h) and 36% (0.9 ml/h vs. 2.5 ml/h) of the natural CSF turnover rates. An infusion flow rate of 2.5 ml/h in pediatric humans is ~ 12% of the natural CSF turnover rate (20.8 ml/h) and was determined to have low risk for causing overt clinical signs of increased intracranial pressure. 21
In the clinical study, rapid escalation from the starting dose of 30 mg to the target dose of 300 mg within patients was implemented to minimize the time spent at a potentially subtherapeutic dose level. A starting dose of 30 mg of cerliponase alfa was more than 10‐fold less than the human equivalent of the nonclinical no observed adverse effect level and thus, was consistent with guidance on the maximum recommended starting dose for the FIH study. 25 The target clinical dose of 300 mg was selected as the human equivalent to the 16 mg dose determined in the TPP1‐null dog to provide significant therapeutic benefit. The simulated human PK profiles scaled from the nonclinical data informed the CSF sampling schedule, which was necessarily sparse in pediatric patients with CLN2 disease. Characterization of the clinical PK and the exposure/response relationships was then performed to confirm the target dose selected from the nonclinical program provided maximal benefit‐risk in pediatric patients with CLN2 disease. 15
Several scaling approaches have been successfully used for therapies administered directly into the CNS. Following intrathecal administration of an antisense oligonucleotide, allometric scaling across species by CSF volume was found to adequately predict CSF concentrations in patients with amyotrophic lateral sclerosis. 26 Adjusting for interspecies differences in brain and body mass was used for idursulfase, a lysosomal targeted enzyme replacement therapy, which likely has a similar clearance mechanism to cerliponase alfa as both are trafficked to the lysosome via the cation‐independent mannose 6‐phosphate receptor where they are believed to undergo proteolysis. In pediatric patients administered idursulfase via an intrathecal injection, allometric scaling of population PK parameters using a brain/bodyweight ratio allowed for adequate exposure predictions. 27
Several alternative methods to allometrically scale across species were considered in this study, including adjusting for inter‐species differences in CSF turnover and CSF volumes. 22 Allometrically scaling by CSF turnover and CSF volume provided estimates consistent with those based on brain mass (data not shown). In CLN2 disease, TPP1 activity in brain tissue is proximally related to the storage of neurotoxic material. 28 For ICV administered cerliponase alpha, the brain is the target site for drug activity, hence scaling by brain mass was deemed most predictive of therapeutic benefit. The allometric scaling of model parameters by brain mass was supported by cross‐species qualification, which produced consistent and reasonable PK profile predictions.
As a protein therapeutic administered directly to the CNS via ICV infusion, no maturation processes were considered beyond changes in brain mass in this study. However, maturation physiology as an important consideration when modeling PK in pediatric populations as the changes occurring as a child grows may affect the PKs of a therapeutic. These include changes in gastrointestinal physiology and intestinal transporters and enzymes for orally administered therapeutics, changes in expression of metabolizing enzymes for drugs that undergo phase I and phase II metabolism, and changes in renal function for drugs cleared through renal excretion. 29 The PK models developed in this study are empirical in nature, and rely on allometric scaling from a large animal model of disease with pharmacologically translatable end points for therapeutic dose and exposure translation to humans. Although this approach was determined to be appropriate for use here, the application of more mechanistic models, such as physiologically‐based PK models, do provide several advantages. These include the ability to and integrate data from multiple in vitro and in vivo sources, including drug‐dependent, physiological, and biological parameters as they vary between species, 30 and better account for the known anatomy and physiology of the brain to characterize the PK in specific regions of the brain. 31 Overall, the approach described here provides an example of how nonclinical data can be leveraged to streamline clinical development in rare disease and provides a method of dose translation and human CSF exposure prediction that may be applicable to other CNS administered therapies being developed.
CONFLICT OF INTEREST
K.H., G.D., B.V., D.K., D.M., C.A.O., and J.W.H. are employees of BioMarin Pharmaceutical Inc. presently or at the time of study and may hold stock/stock options in the company. M.L.K. received funding for research from BioMarin Pharmaceutical Inc.
AUTHOR CONTRIBUTIONS
K.H. and J.W.H. wrote the manuscript. B.V., D.M., G.D., M.L.K., C.A.O., D.K., and J.W.H. designed the research. B.V., D.M., G.D., M.K., C.A.O., D.K., and J.W.H. conducted the research. K.H., J.W.H., B.V., D.M., G.D., NS M.K. analyzed the data.
Supporting information
Fig S1‐S3
ACKNOWLEDGEMENTS
The authors thank the young patients and their families for the participation in the clinical study. We would like to thank Aryun Kim for her clinical pharmacology support.
Funding information
This work was funded by BioMarin Pharmaceutical Inc.
REFERENCES
- 1. Francillon A, Pickering G, Belorgey C. Exploratory clinical trials: implementation modes & guidelines, scope and regulatory framework. Therapie. 2009;64(3):155‐159. [DOI] [PubMed] [Google Scholar]
- 2. Salzberg M. First‐in‐human phase 1 studies in oncology: the new challenge for investigative sites. Rambam Maimonides Med J. 2012;3(2):e0007. [DOI] [PMC free article] [PubMed] [Google Scholar]
- 3. Chang M, Cooper JD, Davidson OP, et al. CLN2. In: Mole SE, Williams RE, Goebel HH, eds. The Neuronal Ceroid Lipofuscinoses (Batten Disease), 2nd edn. Oxford: Oxford University Press; 2011:80‐109. [Google Scholar]
- 4. Kurachi Y, Oka A, Mizuguchi M, et al. Rapid immunologic diagnosis of classic late infantile neuronal ceroid lipofuscinosis. Neurology. 2000;54(8):1676‐1680. [DOI] [PubMed] [Google Scholar]
- 5. Williams RE. Appendix 1: NCL incidence and prevalence data. In: Mole SE, Williams RE, Goebel HH, eds, The Neuronal Ceroid Lipofuscinoses (Batten Disease), 2nd edn. Oxford: Oxford University Press; 2011: 361‐365. [Google Scholar]
- 6. Mole SE, Anderson G, Band HA, et al. Clinical challenges and future therapeutic approaches for neuronal ceroid lipofuscinosis. Lancet Neurol. 2019;18:107‐116. [DOI] [PubMed] [Google Scholar]
- 7. Schulz A, Ajayi T, Specchio N, et al. Study of intraventricular cerliponase alfa for CLN2 disease. N Engl J Med. 2018;378:1898‐1907. [DOI] [PubMed] [Google Scholar]
- 8. Vuillemenot BR, Kennedy D, Cooper JD, et al. Nonclinical evaluation of CNS‐administered TPP1 enzyme replacement in canine CLN2 neuronal ceroid lipofuscinosis. Mol Genet Metab. 2015;114:281‐293. [DOI] [PubMed] [Google Scholar]
- 9. Katz ML, Coates JR, Sibigtroth CM, et al. Enzyme replacement therapy attenuates disease progression in a canine model of late‐infantile neuronal ceroid lipofuscinosis (CLN2 disease). J Neurosci Res. 2014;92:1591‐1598. [DOI] [PMC free article] [PubMed] [Google Scholar]
- 10. Whiting REH, Narfström K, Yao G, et al. Enzyme replacement therapy delays pupillary light reflex deficits in a canine model of late infantile neuronal ceroid lipofuscinosis. Exp Eye Res. 2014;125:164‐172. [DOI] [PubMed] [Google Scholar]
- 11. Vuillemenot BR, Kennedy D, Reed RP, et al. Recombinant human tripeptidyl peptidase‐1 infusion to the monkey CNS: safety, pharmacokinetics, and distribution. Toxicol Appl Pharmacol. 2014;277:49‐57. [DOI] [PubMed] [Google Scholar]
- 12. Giedd JN, Snell JW, Lange N, et al. Quantitative magnetic resonance imaging of human brain development: ages 4–18. Cereb Cortex. 1996;6:551‐560. [DOI] [PubMed] [Google Scholar]
- 13. Schmidt‐Nielsen K, Knut SN. Scaling: Why is Animal Size So Important?. Cambridge, UK: Cambridge University Press; 1984. [Google Scholar]
- 14. Peters RH, Peters RH. The Ecological Implications of Body Size, vol. 2. Cambridge, UK: Cambridge University Press; 1983. [Google Scholar]
- 15. Kim A, Grover A, Hammon K, et al. Clinical pharmacokinetics and pharmacodynamics of cerliponase alfa, enzyme replacement therapy for CLN2 disease by intracerebroventricular administration. Clin Transl Sci. 2020;14(2):635‐644. [DOI] [PMC free article] [PubMed] [Google Scholar]
- 16. Davies M, Jones RDO, Grime K, et al. Improving the accuracy of predicted human pharmacokinetics: lessons learned from the AstraZeneca drug pipeline over two decades. Trends Pharm Sci. 2020;41(6):390‐408. [DOI] [PubMed] [Google Scholar]
- 17. Abduljalil K, Cain T, Humphries H, Rostami‐Hodjegan A. Deciding on success criteria for predictability of pharmacokinetic parameters from in vitro studies: an analysis based on in vivo observations. Drug Metab Dispos. 2014;42(9):1478‐1484. [DOI] [PubMed] [Google Scholar]
- 18. Sleat DE, El‐Banna M, Sohar I, et al. Residual levels of tripeptidyl‐peptidase I activity dramatically ameliorate disease in late‐infantile neuronal ceroid lipofuscinosis. Mol Genet Metab. 2008;94(2):222‐233. [DOI] [PMC free article] [PubMed] [Google Scholar]
- 19. Awano TI, Katz ML, O’Brien DP, et al. A frame shift mutation in canine TPP1 (the ortholog of human CLN2) in a juvenile dachshund with neuronal ceroid lipofuscinosis. Mol Genet Metab. 2006;89(3):254‐260. [DOI] [PubMed] [Google Scholar]
- 20. Lin L, Lobel P. Production and characterization of recombinant human CLN2 protein for enzyme‐replacement therapy in late infantile neuronal ceroid lipofuscinosis. Biochem J. 2001;357:49‐55. [DOI] [PMC free article] [PubMed] [Google Scholar]
- 21. Pardridge WM. Drug delivery to the brain. J Cereb Blood Flow Metab. 1997;17:713‐731. [DOI] [PubMed] [Google Scholar]
- 22. Vuillemenot BR, Korte S, Wright TL, Adams EL, Boyd RB, Butt MT. Safety evaluation of CNS administered biologics—study design, data interpretation, and translation to the clinic. Toxicol Sciences. 2016;152(1):3‐9. [DOI] [PubMed] [Google Scholar]
- 23. Rubenstein JL, Fridlyand J, Abrey L, et al. Phase I study of intraventricular administration of rituximab in patients with recurrent CNS and intraocular lymphoma. J Clin Oncol. 2007;25(11):1350‐1356. [DOI] [PubMed] [Google Scholar]
- 24. Cohen‐Pfeffer JL, Gururangan S, Lester T, et al. Intracerebroventricular delivery as a safe, long‐term route of drug administration. Pediatr Neurol. 2017;67:23‐35. [DOI] [PubMed] [Google Scholar]
- 25. US Food and Drug Administration (FDA) . Guidance for industry: estimating the maximum safe starting dose in initial clinical trials for therapeutics in adult healthy volunteers. July 2005. https://www.fda.gov/media/72309/download. Accessed January 6, 2020.
- 26. Miller T, Pestronk A, David W, et al. An antisense oligonucleotide against SOD1 delivered intrathecally for patients with SOD1 familial amyotrophic lateral sclerosis: a phase 1, randomized, first‐in‐man study. Lancet Neuro. 2013;12(5):435‐442. [DOI] [PMC free article] [PubMed] [Google Scholar]
- 27. Barbier A, McCauley T, Richard CW III. Treatment of cognitive impairment of hunter syndrome by intrathecal delivery of iduronate‐2‐sulfatase. US9682129B2, United States Patent and Trademark Office, June 20, 2017.
- 28. Vuillemenot BR, Katz ML, Coates JR, et al. Intrathecal tripeptidyl‐peptidase 1 reduces lysosomal storage in a canine model of late infantile neuronal ceroid lipofuscinosis. Mol Genet Metab. 2011;104:325‐337. [DOI] [PubMed] [Google Scholar]
- 29. Van den Anker J, Reed MD, Allegaert K, Kearns GL. Development changes in pharmacokinetics and pharmacodynamics. J Clin Pharm. 2018;58(S10):S12‐S25. [DOI] [PubMed] [Google Scholar]
- 30. Espie P, Tytgat D, Sargentini‐Maier M‐L, Poggesi I, Watelet J‐B. Physiologically based pharmacokinetics (PBPK). Drug Metab Rev. 2009;41:391‐407. [DOI] [PubMed] [Google Scholar]
- 31. Chang H‐Y, Wu S, Meno‐Tetang G, Shah DK. A translational platform PBPK model for antibody disposition in the brain. J Pharmacokinet Pharmacodyn. 2019;46:319‐338. [DOI] [PMC free article] [PubMed] [Google Scholar]
Associated Data
This section collects any data citations, data availability statements, or supplementary materials included in this article.
Supplementary Materials
Fig S1‐S3