

Abstract
Background
A systematic review found that 3% of working adults who had received influenza vaccine and 5% of those who were unvaccinated had laboratory‐proven influenza per season; in healthcare workers (HCWs) these percentages were 5% and 8% respectively. Healthcare workers may transmit influenza to patients.
Objectives
To identify all randomised controlled trials (RCTs) and non‐RCTs assessing the effects of vaccinating healthcare workers on the incidence of laboratory‐proven influenza, pneumonia, death from pneumonia and admission to hospital for respiratory illness in those aged 60 years or older resident in long‐term care institutions (LTCIs).
Search methods
We searched CENTRAL (2015, Issue 9), MEDLINE (1966 to October week 3, 2015), EMBASE (1974 to October 2015) and Web of Science (2006 to October 2015), but Biological Abstracts only from 1969 to March 2013 and Science Citation Index‐Expanded from 1974 to March 2013 due to lack of institutional access in 2015.
Selection criteria
Randomised controlled trials (RCTs) and non‐RCTs of influenza vaccination of healthcare workers caring for individuals aged 60 years or older in LTCIs and the incidence of laboratory‐proven influenza and its complications (lower respiratory tract infection, or hospitalisation or death due to lower respiratory tract infection) in individuals aged 60 years or older in LTCIs.
Data collection and analysis
Two authors independently extracted data and assessed risk of bias. Effects on dichotomous outcomes were measured as risk differences (RDs) with 95% confidence intervals (CIs). We assessed the quality of evidence with GRADE.
Main results
We identified four cluster‐RCTs and one cohort study (n = 12,742) of influenza vaccination for HCWs caring for individuals ≥ 60 years in LTCIs. Four cluster RCTs (5896 residents) provided outcome data that addressed the objectives of our review. The studies were comparable in their study populations, intervention and outcome measures. The studies did not report adverse events. The principal sources of bias in the studies related to attrition, lack of blinding, contamination in the control groups and low rates of vaccination coverage in the intervention arms, leading us to downgrade the quality of evidence for all outcomes due to serious risk of bias.
Offering influenza vaccination to HCWs based in long term care homes may have little or no effect on the number of residents who develop laboratory‐proven influenza compared with those living in care homes where no vaccination is offered (RD 0 (95% CI ‐0.03 to 0.03), two studies with samples taken from 752 participants; low quality evidence). HCW vaccination probably leads to a reduction in lower respiratory tract infection in residents from 6% to 4% (RD ‐0.02 (95% CI ‐0.04 to 0.01), one study of 3400 people; moderate quality evidence). HCW vaccination programmes may have little or no effect on the number of residents admitted to hospital for respiratory illness (RD 0 (95% CI ‐0.02 to 0.02, one study of 1059 people; low quality evidence). We decided not to combine data on deaths from lower respiratory tract infection (two studies of 4459 people) or all cause deaths (four studies of 8468 people). The direction and size of difference in risk varied between the studies. We are uncertain as to the effect of vaccination on these outcomes due to the very low quality of evidence. Adjusted analyses, which took into account the cluster design, did not differ substantively from the pooled analysis with unadjusted data.
Authors' conclusions
Our review findings have not identified conclusive evidence of benefit of HCW vaccination programmes on specific outcomes of laboratory‐proven influenza, its complications (lower respiratory tract infection, hospitalisation or death due to lower respiratory tract illness), or all cause mortality in people over the age of 60 who live in care institutions. This review did not find information on co‐interventions with healthcare worker vaccination: hand‐washing, face masks, early detection of laboratory‐proven influenza, quarantine, avoiding admissions, antivirals and asking healthcare workers with influenza or influenza‐like illness (ILI) not to work. This review does not provide reasonable evidence to support the vaccination of healthcare workers to prevent influenza in those aged 60 years or older resident in LTCIs. High quality RCTs are required to avoid the risks of bias in methodology and conduct identified by this review and to test further these interventions in combination.
Keywords: Adult; Aged; Humans; Middle Aged; Health Personnel; Homes for the Aged; Infectious Disease Transmission, Professional‐to‐Patient; Infectious Disease Transmission, Professional‐to‐Patient/prevention & control; Influenza Vaccines; Influenza Vaccines/administration & dosage; Influenza, Human; Influenza, Human/prevention & control; Influenza, Human/transmission; Randomized Controlled Trials as Topic; Vaccines, Inactivated; Vaccines, Inactivated/administration & dosage
Plain language summary
Influenza vaccination for healthcare workers who care for people aged 60 or older living in long‐term care institutions
Review question We wanted to know if vaccinating healthcare workers against influenza reduces the risk of older individuals in long‐term care institutions (LTCIs) acquiring influenza infections from healthcare workers.
Background The signs and symptoms of influenza are similar to those of many other respiratory illnesses, therefore it is important in studies testing the effects of influenza vaccination to prove by laboratory tests, which are highly accurate, whether residents in LTCIs actually have influenza or another respiratory illness.
Study characteristics Our evidence is current to October 2015. Overall five studies were included in our review but we used data from three trials with 5896 residents . In one trial the average age was 77 and 71% were female, in another this was 82 years and 70% were female, and in the last this was 86 years and 77% were female. One study was supported by the Greater Glasgow Health Board Care of the Elderly Unit, one by the Wellcome Trust and for one there was no statement.
Key results and quality of the evidence The method of randomisation used was at low risk in two trials and unclear in one. In all three studies allocation concealment and blinding were unclear. In two studies data could not be included from everyone who was recruited and this put their results at a high risk of bias. All three studies reported outcomes completely. However, in all three trials there was performance bias due to incomplete influenza vaccination of healthcare workers in the intervention arms. No studies reported on adverse events.
Offering influenza vaccination to healthcare workers who care for those aged 60 or over in LTCIs may have little or no effect on laboratory‐proven influenza (low quality evidence). HCW vaccination programmes probably have a small effect on lower respiratory tract infection (moderate quality evidence), but they may have little or no effect on admission to hospital (low quality evidence). It is unclear what effect vaccination programmes have on death due to lower respiratory tract illness (very low quality evidence) or all cause deaths (very low quality evidence).
This review did not find information on other interventions used in conjunction with vaccination of healthcare workers (for example, hand‐washing, face masks, early detection of laboratory‐proven influenza, quarantine, avoiding new admissions, prompt antiviral use, asking healthcare workers with an influenza‐like illness not to work). High quality randomised controlled trials testing combinations of these interventions are needed.
Summary of findings
Summary of findings for the main comparison. Summary of findings table.
| Healthcare workers offered influenza vaccination compared with no vaccination: effects on influenza outcomes in people aged over 60 living in long‐term care institutions | ||||||
| Patient or population: People aged 60 or older living in long‐term care institutions Setting: Europe. Studies were conducted during influenza seasons (data from periods of high influenza activity) Intervention: HCWs offered vaccination Comparison: HCWs not offered vaccination | ||||||
| Outcomes | Anticipated absolute effects* (95% CI) | Risk difference (95% CI) | N of participants (studies) | Quality of the evidence (GRADE) | Comments | |
| Risk in people living in care institutions where HCWs not offered influenza vaccination | Risk in people living in care institutions where HCWs offered influenza vaccination | |||||
| Influenza Follow‐up to end of influenza season |
Study population | 0 (‐0.03 to 0.03) | 752 (2 studies) | ⊕⊕⊝⊝ LOW 1 2 | ||
| 5 per 100 |
5 per 100 (2 to 8) |
|||||
| Lower respiratory tract infection Follow‐up to end of influenza season |
Study population | ‐0.02 (‐0.04 to 0.01) | 1059 (1 study) | ⊕⊕⊕⊝ MODERATE 1 | ||
| 6 per 100 | 4 per 100 (2 to 7) | |||||
| Admission to hospital for respiratory illness Follow‐up to end of influenza season |
Study population | 0 (‐0.02 to 0.02) | 3400 (1 study) | ⊕⊕⊝⊝ LOW 1 2 | ||
| 9 per 100 | 9 per 100 (7 to 11) | |||||
| Deaths from influenza or its complications Follow‐up to end of influenza season |
The results of the studies differed substantially. We did not combine data due to the inconsistency of the size and direction of the trial risk differences The risk of death from influenza or pneumonia was 1% and 8% in the control arms of the studies. The risk of death in the HCW vaccination arms was 5% and 1% in the two studies. | Not pooled | 4459 (2 studies) | ⊕⊝⊝⊝ VERY LOW 3 4 | ||
| Deaths from all causes | The results of the studies differed substantially. We did not combine data due to the inconsistency of the size and direction of the trial risk differences. The risk of death from any cause ranged from 6% to 22% in the control groups. The risk of death in the HCW vaccination arms ranged from 5% to 13%. | Not pooled | 8468 (4 studies) |
⊕⊝⊝⊝ VERY LOW 3 4 | ||
| *The risk in the intervention group (and its 95% confidence interval) is based on the assumed risk in the comparison group and the risk difference of the intervention (and its 95% CI) CI: confidence interval;HCW: healthcare worker | ||||||
| GRADE Working Group grades of evidence High quality: We are very confident that the true effect lies close to that of the estimate of the effect Moderate quality: We are moderately confident in the effect estimate: The true effect is likely to be close to the estimate of the effect, but there is a possibility that it is substantially different Low quality: Our confidence in the effect estimate is limited: The true effect may be substantially different from the estimate of the effect Very low quality: We have very little confidence in the effect estimate: The true effect is likely to be substantially different from the estimate of effect | ||||||
1Downgraded one level due to serious risk of bias: high risk of performance/detection bias.
2Downgraded one level due to serious imprecision: confidence interval includes clinically important differences with either intervention.
3Downgraded two levels due to very serious inconsistency: meta‐analysis was not undertaken for this outcome in view of the high levels of statistical heterogeneity for this outcome and variation in the direction of the effect across the studies,.
4 Downgraded one level due to serious risk of bias: high risk of attrition bias.
Background
Description of the condition
Healthcare workers, such as doctors, nurses, other health professionals, cleaners and porters (and also family visitors), may have substantial rates of clinical and sub‐clinical influenza during influenza seasons (Elder 1996; Jefferson 2009; Ruel 2002). Laboratory‐proven influenza in the general population on average accounts for a small proportion of 'influenza‐like illnesses'. A systematic review of 29 observational studies with 58,245 participants during 97 influenza seasons found that 3% (95% confidence interval (CI) 1.79% to 5.15%) of vaccinated working adults had a symptomatic influenza infection (tested by serology) per influenza season. Among vaccinated healthcare workers 4.8% (95% CI 3.23% to 7.16%) had an influenza infection per influenza season. Of unvaccinated working adults 5.12% (95% CI 3.08% to 8.52%) had an influenza infection per season; in unvaccinated HCWs this was 7.54% (95% CI 4.86% to 11.70%) (Kuster 2011).
Healthcare workers often continue to work when infected with influenza, increasing the likelihood of transmitting influenza to those in their care (Coles 1992; Weingarten 1989; Yassi 1993). However, a review of infection transmission in hospitals was unable to provide numerical data for influenza transmission by HCWs (Sydnor 2014). Those aged 60 or older in institutions such as long‐stay hospital wards and nursing homes are at risk of influenza and its complications, especially if affected with multiple pathologies (Fune 1999; Jackson 1992; Muder 1998; Nicolle 1984).
Description of the intervention
One way to prevent the spread of influenza to those aged 60 years or older resident in long‐term care institutions (LTCIs) may be to vaccinate healthcare workers. The Centers for Disease Control (CDC) Advisory Committee on Immunisation Practices (ACIP) recommends vaccination of all healthcare workers (Harper 2004). However, only 36% of healthcare workers in the US were vaccinated in 2003 (CDC 2003), 35% of staff in LTCIs in Canada were vaccinated in 1999 (Stevenson 2001), and 34% to 44% after a RCT in 43 geriatric healthcare settings in France to increase vaccination rates (Rothan‐Tondeur 2010). Nurses and (in some institutions) physicians, tend to have lower influenza vaccination rates than other healthcare workers. This relatively low uptake may partly be a reflection of doubts as to the vaccine's ability to prevent influenza (Ballada 1994; Campos 2002‐3; Ludwig‐Beymer 2002; Martinello 2003; Quereshi 2004). The design and execution of campaigns to increase vaccination rates are also important (Doebbeling 1997; NFID 2004; Russell 2003a; Russell 2003b), in order to provide an intervention at minimal risk of bias from inadequate randomisation, concealment of allocation, blinding, attrition, incomplete reporting and inappropriate statistical analysis.
How the intervention might work
Healthcare workers are the key group who enter nursing and LTCIs on a daily basis. The immune systems of the elderly are less responsive to vaccination and vaccinating healthcare workers could reduce the exposure of those aged 60 years or older to influenza.
Why it is important to do this review
Previous systematic reviews of the effects of influenza vaccines in those aged 60 years or older are now out of date or do not include all relevant studies. The Gross 1995 review is 17 years old and its conclusions are affected by the exclusion of recent evidence. The Vu 2002 review has methodological weaknesses (excluding studies with denominators smaller than 30 and quantitative pooling of studies with different designs), which are likely to undermine the conclusions. A systematic review by Jordan 2004 of the effects of vaccinating healthcare workers against influenza on high‐risk individual elderly reports significantly lower mortality in the elderly (13.6% versus 22.4%, odds ratio (OR) 0.58, 95% CI 0.4 to 0.84) but does not include the latest studies. The Burls 2006 systematic review of the effects on elderly people only identified the RCTs by Potter 1997 and Carman 2000. Anikeeva 2009 does not include the study by Lemaitre 2009. It is important to provide accurate information for policy makers and to highlight the need for high quality trials to test combinations of interventions, including healthcare worker vaccination.
There are Cochrane systematic reviews assessing the effects of influenza vaccines in children (Jefferson 2012), the elderly (Jefferson 2010), healthy adults (Demicheli 2014), people affected with chronic obstructive pulmonary disease (Poole 2010), and cystic fibrosis (Dharmaraj 2009).
Objectives
To identify all randomised controlled trials (RCTs) and non‐RCTs assessing the effects of vaccinating healthcare workers on the incidence of laboratory‐proven influenza, pneumonia, death from pneumonia and admission to hospital for respiratory illness and death from all causes in those aged 60 years or older resident in long‐term care institutions (LTCIs).
Methods
Criteria for considering studies for this review
Types of studies
RCTs and non‐RCTs (cohort or case‐control studies) reporting exposure and outcomes by vaccine status.
Types of participants
Healthcare workers (nurses, doctors, nursing and medical students, other health professionals, cleaners, porters and volunteers who have regular contact with those aged 60 years or older) of all ages, caring for those aged 60 years or older in institutions such as nursing homes, LTCIs or hospital wards.
Types of interventions
Vaccination of healthcare workers with any influenza vaccine given alone or with other vaccines, in any dose, preparation or time schedule, compared with placebo or with no intervention. Studies on vaccinated elderly are included in reviews looking at the effects of influenza vaccines in the elderly (Jefferson 2010). The Demicheli 2014 review looked at the effects of vaccination in healthy adults such as healthcare workers.
Types of outcome measures
Primary outcomes
We used the following outcomes as the basis for our 'Summary of Findings' table:
Cases of influenza in those aged 60 years or older confirmed by viral isolation or serological supporting evidence (or both), plus a list of likely respiratory symptoms.
Lower respiratory tract infection.
Admission to hospital for respiratory illness.
Deaths caused by respiratory illness.
Deaths from any cause
We excluded studies reporting only serological outcomes in the absence of symptoms. We did not consider outcomes for healthcare workers.
After the last publication of this review (Thomas 2013), two reviews were undertaken to assess the appropriateness of ILI (Thomas 2014a; Appendix 1) as outcome measures and we decided not to use these outcome measures as they are misleading.
Search methods for identification of studies
Electronic searches
For this 2015 update we searched the Cochrane Central Register of Controlled Trials (CENTRAL 2015, Issue 9), which contains the Cochrane Acute Respiratory Infections Group's Specialised Register, MEDLINE (March 2013 to October week 3 2015), Embase.com (March 2013 to October 2015) and Web of Science (March 2013 to October 2015). See Appendix 2 for details of previous searches. There were no language restrictions.
We searched MEDLINE and CENTRAL using the following search strategy. We combined the MEDLINE search with the Cochrane Highly Sensitive Search Strategy for identifying randomised trials in MEDLINE: sensitivity‐maximising version (2008 revision); Ovid format (Lefebvre 2011). We adapted the search strategy to search EMBASE (Appendix 3) and Web of Science (Appendix 4).
We also combined the following search strategy with the SIGN filter (SIGN 2009) for identifying observational studies and ran the searches in MEDLINE and adapted them for EMBASE and Web of Science (see Appendix 5).
MEDLINE (Ovid)
1 Influenza Vaccines/ 2 Influenza, Human/ OR exp Influenzavirus A/ OR exp Influenzavirus B/ OR influenza.tw. OR flu.tw. 3 exp Vaccines/ OR Vaccination/ OR vaccin*.tw,nm. OR exp Immunization/ OR (immuniz* or immunis*).tw. 4 2 AND 3 5 1 OR 4 6 exp Health Personnel/ OR ((health or health care or healthcare) adj2 (personnel or worker* or provider* or employee* or staff or professional*)).tw. OR ((medical or hospital) adj2 (staff or employee* or personnel or worker*)).tw. OR (doctor* or physician* or clinician*).tw. OR (allied health adj2 (staff or personnel or worker*)).tw. OR paramedic*.tw. OR nurse*.tw. OR (nursing adj2 (staff or personnel or auxiliar*)).tw. 7 exp Hospitals/ OR Long‐Term Care/ OR exp Residential Facilities/ OR Health Services for the Aged/ OR nursing home*.tw. OR (institution* adj3 elderly).tw. OR aged care.tw. OR hospice*.tw. OR ((long stay or long term) adj3 (ward* or facilit* or hospital*)).tw. OR old people* home*.tw. OR Geriatrics/ OR geriatric*.tw. 8 5 AND 6 AND 7
Searching other resources
We searched the World Health Organization (WHO) International Clinical Trials Registry Platform (ICTRP) and US National Institutes of Health trials registry (latest search 28 January 2016). We also searched the Database of Abstracts of Reviews of Effects (DARE) 2013 (part of The Cochrane Library) and reviewed the references for further possible studies. We searched bibliographies of retrieved articles and contacted trial authors for further details, if required.
Data collection and analysis
Selection of studies
Two review authors (TJL, RET) independently reviewed the abstracts by using the following inclusion criteria.
People 60 years or older.
LTCIs or hospitals.
Healthcare workers.
Influenza vaccination.
Death from any cause.
Disagreements were resolved by a third review author (TOJ).
Data extraction and management
Two review authors (RET, TJL) applied the inclusion criteria to all identified and retrieved articles and extracted data from included studies into standard Cochrane Vaccines Field forms. We extracted the following data in duplicate.
Methods: purpose; design; period study conducted and statistics.
Participants: country or countries of study; setting; eligible participants; age and gender.
Interventions and exposure: in intervention group and control group.
Outcomes in those aged 60 years or older residing in LTCIs.
Two review authors (RET, TJL) independently checked data extraction and disagreements were resolved by third review author (TOJ).
Assessment of risk of bias in included studies
We carried out assessment of methodological quality for RCTs using the Cochrane 'Risk of bias' tool (Higgins 2011). We assessed the quality of non‐RCTs in relation to the presence of potential confounders using the appropriate Newcastle‐Ottawa Scales (NOS) (Wells 2005). The NOS asks whether all possible precautions against confounding have been taken by the study designers and links study quality to the answer. We translated the number of inadequately reported or conducted items into categories of risk of bias. We used quality at the analysis stage as a means of interpreting the results. The review authors resolved disagreements on inclusion or methodological quality of studies by discussion. Two review authors (RET, TOJ) checked quality assessment.
We looked for details of formal ethics approval and informed consent of participants.
Measures of treatment effect
We assessed efficacy against laboratory‐proven influenza, pneumonia, deaths from pneumonia and hospitalisation using risk differences (RD) with 95% confidence intervals (CI). We chose to analyse the data as risk differences. The number needed to vaccinate (NNV) was computed as 1/RD.
Unit of analysis issues
All three RCTs that provided outcome data that met our criteria had a cluster design. We adjusted the study estimates for cluster‐RCTs by dividing the events and sample sizes in each treatment group with the study design effect. to derive the 'effective sample size'. This was based on formulae described in full in Chapter 16 of the Cochrane Handbook for Systematic Reviews of Interventions (Higgins 2011). This generates a design effect based on the intracluster correlation coefficient and average cluster size. The design effect used to for each study is given in the Characteristics of included studies tables.
In previous versions of this review we used generic inverse variance outcome types to analyse trial effect estimates for rates of events or risk of odds ratios as available from the included studies. We adopted an alternative approach for convenience since the preferred measure of effect was the risk difference.
Dealing with missing data
We did not use any strategies to impute missing outcome data and recorded missing data in the 'Risk of bias' table.
We contacted trial authors to ascertain the intra‐cluster correlation coefficient (ICC) and to confirm statistical analyses before proceeding to adjust events and totals to use in the analysis of data. In the absence of an ICC for two studies (Carman 2000; Potter 1997), we assumed an ICC of 0.023 based on a larger study (Hayward 2006).
Assessment of heterogeneity
We used the Chi2 test and I2 statistic to assess heterogeneity across the pooled studies. For outcomes where there was evidence of statistical variation above 50%, we based decisions on whether to combine data on the magnitude and direction of the effects across the studies
Assessment of reporting biases
We identified only three cluster‐RCTs that met our criteria for outcome data and so we could not create a funnel plot to assess publication bias due to the small number of included studies.
Data synthesis
We meta‐analysed with a random‐effects model as it could not be assumed that the studies came from similar populations. We used Review Manager 5.3 to create 'Summary of findings' tables (RevMan 2014).
GRADE and 'Summary of findings' table
One author assessed the quality of evidence using GRADE methods. We created a 'Summary of findings' table using the following outcomes: cases of influenza, lower respiratory tract infection, admission to hospital for respiratory illness, deaths caused by influenza or its complications and deaths from any cause. We used the five GRADE considerations (study limitations, consistency of effect, imprecision, indirectness and publication bias) to assess the quality of the body of evidence as it relates to the studies that contribute data to the meta‐analyses for the prespecified outcomes (Atkins 2004). We used methods and recommendations described in Section 8.5 and Chapter 12 of the Cochrane Handbook for Systematic Reviews of Interventions (Higgins 2011) and used GRADEpro GDT software (GRADEpro GDT 2015) to rate the quality of evidence. Downgrading decisions for the randomised trial evidence resulted in one of four quality ratings (high, moderate, low or very low) depending on the number of levels the evidence was downgraded. We justified all decisions to downgrade or upgrade the quality of studies using footnotes in Table 1, and we made comments to aid the reader's understanding of the review where necessary.
Subgroup analysis and investigation of heterogeneity
Whenever data presented in the study allowed it, we carried out subgroup analysis according to the vaccination status of residents aged 60 years or older. We assessed the following outcomes that arose during the influenza season.
Laboratory‐proven influenza infections (by paired serology, nasal swabs, reverse‐transcriptase polymerase chain reaction (RT‐PCR) or tissue culture).
Lower respiratory tract infection.
Hospitalisation for respiratory illness.
Death from respiratory tract illness.
Death from any cause.
Sensitivity analysis
With only three cluster‐RCTs that met our criteria for outcome data, a sensitivity analysis was not feasible.
Results
Description of studies
Results of the search
A search on 27 October 2015 identified 153 RCTs and 236 observational studies. A search in clinical trials registries on 27 January 2016 identified 11 citations but no new studies were included in this update. Neither the 2013 nor the 2009 searches identified new RCTs for inclusion.
The 2015, 2013 and 2009 searches (with duplicate results) in total identified 2825 papers (766 RCTs, 2059 observational studies) and (with duplicates removed) 1841 papers (383 RCTs, 1443 observational studies).
In the first publication of this review we also examined 312 reports for detailed assessment from the review on the effects of influenza vaccines in the elderly (Jefferson 2010). Due to the comprehensive nature of this Cochrane review we carried out a review with a very focused study question and benefited from extensive searches, which generated a large number of 'hits' but a relatively low yield of studies to include.
After our review's second edition, reviews of ILI (Thomas 2014a) and all‐cause mortality (Thomas 2014b) were conducted that led us to the decision for the third publication of this review to exclude outcome data relating to influenza‐like illness (Appendix 1) and all‐cause mortality (Appendix 6) as outcome measures. Two studies that were in the second publication no longer contribute outcome data to this review: one cluster‐RCT (Hayward 2006), because the main outcome measure was all‐cause mortality and the secondary measure was ILI; and a cohort study (Oshitani 2000), which used ILI as the outcome measure.
Included studies
Five studies met the inclusion criteria (see Characteristics of included studies table). Three cluster‐RCTs contribute data to the outcomes of interest to this review, recruiting a total of 5896 participants (Carman 2000; Lemaitre 2009; Potter 1997). These three studies were comparable in their study populations, intervention and outcome measures. The studies did not report on adverse events.
Excluded studies
We excluded all 747 new citations identified in the 2013 review update and the 379 in the 2015 searches because they either did not have influenza vaccination outcome data for those aged 60 years or older or healthcare workers, or both, or did not report the outcome data we specified, or reported only influenza antibody levels.
Risk of bias in included studies
See the 'Risk of bias' tables and Figure 1 and Figure 2. We downgraded the quality of evidence for each of the outcomes of interest due to risk of bias arising from lack of blinding or attrition bias.
1.
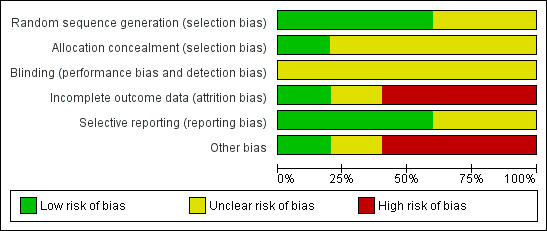
Methodological quality graph: review authors' judgements about each methodological quality item presented as percentages across all included studies.
2.
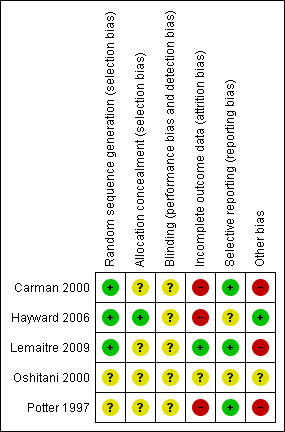
Methodological quality summary: review authors' judgements about each methodological quality item for each included study.
Allocation
There was adequate sequence generation in three studies. One used a random number table (Carman 2000), one used a centralised random number generator (Lemaitre 2009), and for the third study we considered that the process was likely to have been carried out reliably (Hayward 2006). However, there was uncertainty in one study (Potter 1997): "Hospital sites were stratified by unit policy for vaccination, then randomised for their healthcare workers to be routinely offered either influenza vaccination and patients unvaccinated...".
Blinding
No RCTs explicitly stated that they had appropriate means of blinding participants or study personnel to vaccination. In Carman 2000 and Potter 1997 there is no statement that any researcher, assessor, data analyst, healthcare worker or participant was blinded. In Carman 2000 the study nurses "took additional opportunistic nose and throat swabs from non‐randomised patients who the ward nurses thought had an influenza‐like illness". In Potter 1997 ward nurses paged the research nurses "if any patients under their care developed clinical symptoms suggestive of upper respiratory tract viral illness, influenza, or lower respiratory tract infection," and in Lemaitre 2009 "Influenza vaccination was further recommended during face‐to‐face interviews with each member of staff ... The study team individually met all administrative staff, technicians and caregivers to invite them to participate and volunteers were vaccinated at the end of the interview."
Incomplete outcome data
Incomplete data were not addressed in the three studies (Carman 2000; Hayward 2006; Potter 1997).
Selective reporting
No study appeared to report results selectively.
Other potential sources of bias
For Potter 1997 potential sources of bias were as follows.
Selection bias: the total number of long‐term care hospitals in West and Central Scotland is not stated. There were inconsistencies in outcome gradients (Table 2). In the population under observation, Potter 1997 reported 216 cases of suspected viral illness, 64 cases of influenza‐like illness, 55 cases of pneumonia, 72 deaths from pneumonia and 148 deaths from all causes. In the sub‐population of both vaccinated staff and patients, Potter 1997 reported 24 cases of suspected viral illness, two cases of influenza‐like illness, seven cases of pneumonia, 10 deaths from pneumonia and 25 deaths from all causes. As these gradients are not plausible (one would expect a greater proportion of cases of influenza‐like illness to be caused by influenza during a period of high viral activity), the effect on all‐cause mortality is likely to reflect a selection bias rather than a real effect of vaccination.
Performance bias: 67% of staff in active arm one and 43% in active arm two were vaccinated.
There is no description of the vaccines administered, vaccine matching or background influenza epidemiology.
1. Potter 1997.
| SVPV | SVP0 | S0PV | S0P0 | |
| Suspected viral illness | 24 | 58 | 75 | 59 |
| Influenza‐like illness | 2 | 20 | 19 | 23 |
| Pneumonia | 7 | 14 | 16 | 18 |
| Deaths from pneumonia | 10 | 15 | 24 | 23 |
| All deaths | 25 | 25 | 56 | 42 |
S0P0: staff and patients not vaccinated S0PV: staff not vaccinated, patients vaccinated SVPV: staff and patients vaccinated SVP0: staff vaccinated and patients not vaccinated
For Carman 2000 potential sources of bias were as follows.
Selection bias: the total number of long‐term care hospitals in West and Central Scotland is not stated. In the long‐term care hospitals in which healthcare workers were offered vaccination, residents had higher Barthel scores.
Performance bias: only 51% of healthcare workers in the Lemaitre 2009 arm received vaccine in the long‐term care hospitals where vaccine was offered and 4.8% where it was not; 48% of patients received vaccine in the arm where healthcare workers were offered vaccination and 33% in the arm where healthcare workers were not.
Statistical bias: the analysis was not corrected for clustering, unlike the Potter 1997 pilot; in the long‐term care hospitals where healthcare workers were offered vaccination, the patients had significantly higher Barthel scores and were more likely to receive influenza vaccine (no significance level stated) and due to missing data these differences could not be adjusted for other than by estimation. Statistical power may also have been a problem as the detection rate of 6.7% was lower than the estimated rate of 25% used in the power calculation.
The Potter 1997 and Carman 2000 cluster‐RCTs can be regarded as investigations in the same geographical area with a modest possible but unknown overlap of staff and residents. Only three of the long‐term care hospitals in the Potter 1997 study were included in the Carman 2000 cluster‐RCT because some of the homes were closed down (e‐mail communication from Dr. Stott) but the continuity of staff between the institutions is unknown.
Ethics approval:Carman 2000, Lemaitre 2009 and Potter 1997 received formal ethics approval. Carman 2000 and Potter 1997 obtained written informed consent from healthcare workers and witnessed verbal consent from participants for nose swabs to be taken and Potter 1997 for blood samples. The LTCIs already had policies for opting in or opting out of influenza vaccination. Lemaitre 2009 obtained face‐to‐face informed consent from healthcare workers.
Effects of interventions
See: Table 1
The main findings of the review are presented in Table 1.
Primary outcomes
1. Cases of influenza in those aged 60 years or older confirmed by viral isolation or serological supporting evidence (or both), plus a list of likely respiratory symptoms
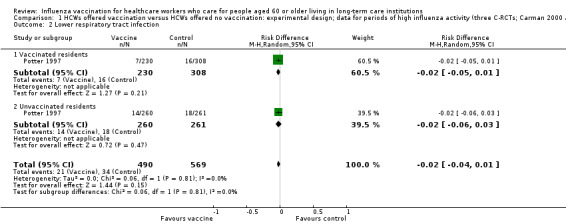
Potter 1997 reported outcomes only for unvaccinated patients. We computed a risk difference (RD) of 0.01, 95% confidence interval (CI) ‐0.03 to 0.05, P value = 0.73); low quality evidence. Carman 2000 reported data on influenza cases among vaccinated and unvaccinated patients combined. We computed a RD of ‐0.01, 95% CI ‐0.05 to 0.03, P value = 0.54). We were able to pool the results for Carman 2000 and Potter 1997 and we computed an overall RD of ‐0.00, 95% CI ‐0.03 to 0.03, P value = 0.45, I2 statistic = 0% (Analysis 1.1). The pooled RD based on adjusted study effect estimates was 0.00, 95% CI ‐0.03 to 0.03 (Analysis 2.1).
1.1. Analysis.
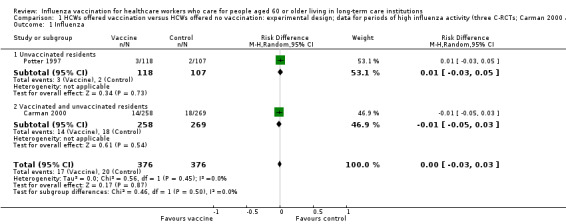
Comparison 1 HCWs offered vaccination versus HCWs offered no vaccination: experimental design; data for periods of high influenza activity (three C‐RCTs; Carman 2000 and Potter 1997 152 days; Lemaitre 2009 118 days), Outcome 1 Influenza.
2.1. Analysis.
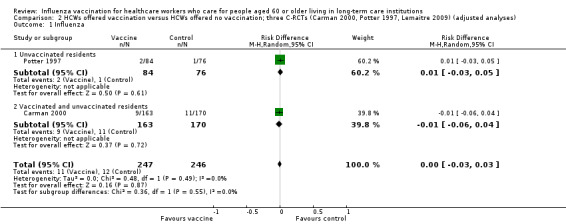
Comparison 2 HCWs offered vaccination versus HCWs offered no vaccination; three C‐RCTs (Carman 2000, Potter 1997, Lemaitre 2009) (adjusted analyses), Outcome 1 Influenza.
2. Lower respiratory tract infection
Only Potter 1997 reported data for lower respiratory tract infection and reported results separately for vaccinated and unvaccinated patients. For vaccinated patients we computed a RD of ‐0.02, 95% CI ‐0.05 to 0.01, P value = 0.21. For the unvaccinated we computed a RD of ‐0.02, 95% CI ‐0.06 to 0.03, P value = 0.47. For the vaccinated and unvaccinated patients combined we computed a RD of ‐0.02, 95% CI ‐0.04 to 0.01, P value = 0.15, I2 statistic = 0% (Analysis 1.2); moderate quality evidence.
1.2. Analysis.
Comparison 1 HCWs offered vaccination versus HCWs offered no vaccination: experimental design; data for periods of high influenza activity (three C‐RCTs; Carman 2000 and Potter 1997 152 days; Lemaitre 2009 118 days), Outcome 2 Lower respiratory tract infection.
3. Admission to hospital for respiratory illness
Only Lemaitre 2009 provided data for "admissions to hospital for respiratory illness" and we computed a RD of 0.00, 95% CI ‐0.02 to 0.02, P value = 0.84 (Analysis 1.3). The pooled RD based on adjusted study effect estimates was RD 0.00, 95% CI ‐0.02 to 0.03 (Analysis 2.3), low quality evidence.
1.3. Analysis.
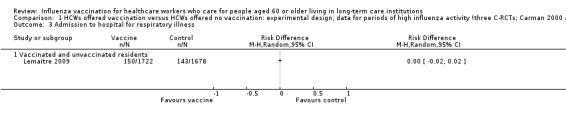
Comparison 1 HCWs offered vaccination versus HCWs offered no vaccination: experimental design; data for periods of high influenza activity (three C‐RCTs; Carman 2000 and Potter 1997 152 days; Lemaitre 2009 118 days), Outcome 3 Admission to hospital for respiratory illness.
2.3. Analysis.
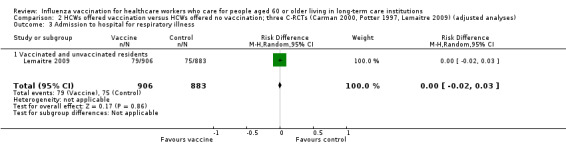
Comparison 2 HCWs offered vaccination versus HCWs offered no vaccination; three C‐RCTs (Carman 2000, Potter 1997, Lemaitre 2009) (adjusted analyses), Outcome 3 Admission to hospital for respiratory illness.
4. Deaths caused by respiratory illness
Potter 1997 reported data for deaths from pneumonia separately for vaccinated patients and unvaccinated patients. For vaccinated patients we computed a RD of ‐0.03, 95% CI ‐0.07 to 0.01, P value = 0.09 and for the unvaccinated we computed a RD of ‐0.03, 95% CI ‐0.07 to 0.01, P value = 0.18. Lemaitre 2009 reported results for "deaths from respiratory illness" (not further defined) for vaccinated and unvaccinated patients combined and we computed a RD of 0.00 (95% CI ‐0.00 to 0.01, P value = 0.23) (Analysis 1.4). Since the I2 statistic was high (81%) we decided not to combine the data across the studies and we have rated the quality of evidence as very low.
1.4. Analysis.
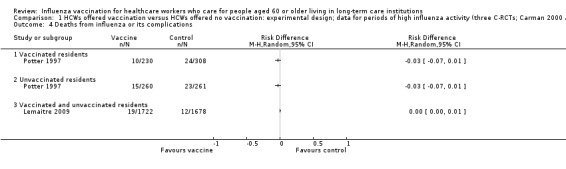
Comparison 1 HCWs offered vaccination versus HCWs offered no vaccination: experimental design; data for periods of high influenza activity (three C‐RCTs; Carman 2000 and Potter 1997 152 days; Lemaitre 2009 118 days), Outcome 4 Deaths from influenza or its complications.
5. Deaths from any cause
Potter 1997 reported outcomes separately for vaccinated patients (RD ‐0.07 (‐0.13 to ‐0.01) and unvaccinated patients RD 0.06 (95% CI ‐0.12 to ‐0.01). Carman 2000, Hayward 2006 and Lemaitre 2009 reported data for vaccinated and unvaccinated patients combined. The size of the effect varied considerably across the three studies (I squared 83%), with RDs between ‐0.09 and ‐0.01 (Analysis 1.5). In view of the variation in the size and direction of the effects we elected not to combine the data in a meta‐analysis.
1.5. Analysis.
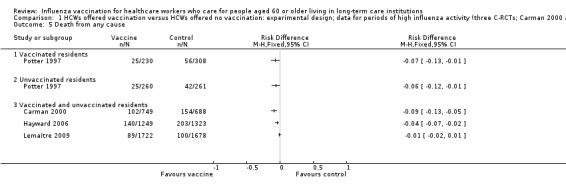
Comparison 1 HCWs offered vaccination versus HCWs offered no vaccination: experimental design; data for periods of high influenza activity (three C‐RCTs; Carman 2000 and Potter 1997 152 days; Lemaitre 2009 118 days), Outcome 5 Death from any cause.
Discussion
We identified four cluster‐randomised controlled trials (RCTs) which met our criteria for outcome data to answer the question of whether vaccinating healthcare workers against influenza protects those aged 60 years or older residing in long‐term care institutions (LTCIs).
Pooled data showed no effect on specific outcomes: laboratory‐proven influenza (Carman 2000; Potter 1997), lower respiratory tract infections (Potter 1997), admissions to hospital for lower respiratory tract illness (Lemaitre 2009), and deaths from lower respiratory tract illness (Lemaitre 2009; Potter 1997), with the 95% confidence interval (CI) in each case including unity.
One question is what the maximum contribution that influenza vaccination of people aged 60 years or older could make in reducing total annual mortality. A population study by Simonsen 2006 used data from the US national multiple‐cause‐of‐death databases from 1968 to 2001 and found that for those aged 65 years or older, mortality attributable to pneumonia or influenza never exceeded 10% of all deaths during those winters. The study by Vila‐Córcoles 2007 of 11,240 Spanish community‐dwelling elderly, conducted between January 2002 and April 2005, found the attributable mortality risk in individuals not vaccinated against influenza was 24 deaths/100,000 person‐weeks within influenza periods. Vaccination prevented 14% of these deaths for the population and one death was prevented for every 239 annual vaccinations (ranging from 144 in winter 2005 to 1748 in winter 2002). It should be noted that these data are not for residents of LTCIs. A mathematical model predicted that for a 30‐bed unit, an increase in healthcare worker vaccination rates from 0% to 100% would decrease resident influenza infections by 60% (van den Dool 2008).
Summary of main results
We identified three cluster‐RCTs that provided outcome data that met our criteria. Pooled data showed that there was no effect on laboratory‐proven influenza, lower respiratory tract infections, admissions to hospital for respiratory illness or deaths from respiratory illness.
Overall completeness and applicability of evidence
Four cluster‐RCTs focused directly on the question of the effect of healthcare worker vaccination on the mortality and morbidity of long‐term care facility residents aged 60 years or older. The cluster‐RCTs have certain common features: they are all underpowered to detect any difference in influenza mortality, which is a rare event. All participants, were they residents or carers, were unblinded to their intervention status. All trials showed no reduction in influenza or its complications (the registered indication for the vaccines). Our review has yielded no clear indication of benefit on specific outcome measures of influenza. It is noteworthy that the studies did report significant results for a syndrome (influenza‐like illness ‐ ILI), which is caused only in part by influenza viruses. The absence of usable outcome data for the specific effects of healthcare worker vaccination programmes from Hayward 2006 and Oshitani 2000 restricts the applicability of our findings further.
Quality of the evidence
We downgraded the quality of evidence for each outcome due to risk of bias (Table 1). A key uncertainty for the outcomes of influenza and hospital admission due to respiratory infection is low power, prompting us to downgrade for imprecision. The analysis of both adjusted and unadjusted study results for three of the four outcomes of interest were consistent with each other. We considered the inconsistency in the size and direction of the risk differences for cause specific and non‐specific mortality to be very serious. We decided not to combine the data for these outcomes. However, the high I2 statistic observed for the outcomes of influenza‐related mortality and mortality due to any cause were lower after recalculating the events and sample sizes to take account of the design effect . We discuss the consequences of our choice of effect measure below.
Potential biases in the review process
We are aware of two important features of our approach that could have influenced our results and conclusions. Firstly, the high degree of statistical heterogeneity for the outcome of influenza‐related mortality may reflect the decision to use risk difference. As an absolute measure of effect risk difference is less likely to be stable across the different studies than relative measures such as odds or risk ratios. Secondly, the intracluster correlation coefficients (ICCs) we used for two of the studies were based on the estimate provided by Hayward 2006. Although the recalculation of the effective sample size was done in accordance with recommended procedures (Higgins 2011), we have assumed that the adjustment required is the same across the outcomes extracted for each study.
Agreements and disagreements with other studies or reviews
Ahmed 2014 identified the same cluster‐RCTs that we did and rated the quality of evidence for many influenza‐specific outcomes as low and very low (italics in original, bolding added), which is compatible with our assessments although we have downgraded for different reasons (see below). The evidence for non‐specific outcomes was graded as moderate quality.
Ahmed included three observational studies that we excluded: Bénet 2012 (cannot separate outcomes for those > 60), Enserink 2011 (outcome measure is ILI) and Wendelboe 2011 (problems in design and execution such that the results cannot be relied on). Both our review and Ahmed's used laboratory‐confirmed influenza as an outcome. However, the other outcomes we assessed were specific to influenza (hospitalisation for influenza and deaths from influenza) whereas Ahmed used non‐specific outcomes (all‐cause hospitalisation and all‐cause deaths). We also assessed lower respiratory tract infection. None of our outcome measures had statistically significant results.
Authors' conclusions
Implications for practice.
The four cluster‐randomised controlled trials (RCTs) contributing outcome data to our review are at high risk of bias and pooled data have not shown convincing evidence of benefit on the outcomes of direct interest, namely laboratory‐proven influenza (low quality evidence), lower respiratory tract infections (moderate quality evidence), admissions to hospital (low quality evidence), and deaths from lower respiratory tract illness or from all causes (very low quality evidence). Where meta‐analysis was possible the 95% confidence interval (CI) in each case has not excluded little or no effect of vaccination programmes. We conclude that there is an absence of high quality evidence that vaccinating healthcare workers against influenza protects people aged 60 years or older in their care on influenza‐specific outcomes. There is little evidence to justify medical care and public health practitioners mandating influenza vaccination for healthcare workers who care for the elderly in long‐term care institutions (LTCIs).
Implications for research.
There are currently only three cluster‐RCTS that provide outcome data that meet our criteria to evaluate the impact on residents aged 60 years or older of vaccinating their healthcare workers against influenza. All of these studies are at high risk of bias. RCTs are needed with minimal risk of bias from sequence generation, failure to conceal allocation, and performance, attrition and detection bias and these should be adequately powered for the key outcomes of laboratory‐proven influenza, hospitalisation for pneumonia and death from pneumonia. They should carefully define and measure outcomes including laboratory‐proven influenza, lower respiratory tract infection, cause of hospitalisation and deaths from pneumonia. They should carefully consider the degree to which they must, to adequately assess outcomes, obtain proof of diagnosis for all participants by laboratory testing all participants with appropriate symptoms for influenza and all other likely viruses, performing blood cultures, white blood cell counts and other laboratory investigations and chest X‐rays if pneumonia is suspected, and following the course of all hospitalised patients by scrutinising individual records so that they can definitively assess all outcomes and co‐morbidities. A particular issue in the analysis of data from studies with a cluster design is the provision and use of an intra‐cluster correlation coefficient (ICC). It is a major limitation with the analysis of data in our review that we have not had available a reliable estimate of this quantity for each of the outcomes of interest.
The area of interest is those aged 60 years or older in LTCIs. Therefore, if the existing LTCIs' organisational structure is to be used to implement the interventions, these will need to be given to clusters of residents aged 60 years or older and healthcare workers, which will make blinding difficult. An important ethical issue is informed consent by those aged 60 years or older and healthcare workers. It is not ethical to blind participants or healthcare workers but the researchers, data assessors and statisticians could all be blinded.
The elderly are much keener to be vaccinated than healthcare workers and there is extensive literature about the group of healthcare workers who say they do not feel vulnerable to influenza, do not believe the vaccine is effective and are afraid of side effects, and some of these do not perceive risk for their patients. Persistence of these beliefs may limit uptake by healthcare workers and make it difficult to test conclusively the effect of very high levels of healthcare worker influenza vaccination.
A large publicly funded trial is needed to test combinations of interventions to reduce influenza and mortality from influenza in those aged 60 years or older in LTCIs with thorough delivery of each intervention: vaccinating residents and healthcare workers, hand‐washing, face masks, early detection of laboratory‐proven influenza in individuals with influenza‐like illness by using nasal swabs, quarantine of floors and entire LTCIs during outbreaks, avoiding new admissions, prompt use of antivirals and asking healthcare workers with an influenza‐like illness not to present for work.
Feedback
Influenza vaccination for healthcare workers who work with the elderly, 5 May 2008
Summary
Feedback: The below is not an article in Journal of Infectious Diseases 1997; 175 (1) as cited. Indeed I've not been able to locate the the study in any other journal, though the study has been cited many times in other studies as well.
Potter J, Stott DJ, Roberts MA, Elder AG, O'Donnell B, Knight PV, et al. Influenza vaccination of health care workers in long‐term‐care hospitals reduces the mortality of elderly patients. Journal of Infectious Diseases 1997;175(1):1‐6
Submitter agrees with default conflict of interest statement: I certify that I have no affiliations with or involvement in any organization or entity with a financial interest in the subject matter of my feedback.
Reply
We thank Thomas Kristiansen for his comment. The article was in fact published in the Journal of Infectious Diseases (volume 175), issue 1 in 1997. It is available for purchase or download at: http://www.jstor.org/pss/30129986.
Contributors
Thomas Birk Kristiansen Feedback comment added 21 June 2008
Influenza vaccination for healthcare workers who work with the elderly, 1 December 2009
Summary
In the table and list of included studies, you have reported Hayward 2006 (BMJ Des 2006) but this study is not included in the analyses or mentioned in the text. The outcomes of this study do not seem to be adequately reported in the table.
Submitter agrees with default conflict of interest statement: I certify that I have no affiliations with or involvement in any organization or entity with a financial interest in the subject matter of my feedback.
Reply
We thank Signe Flottorp for his comment, which we received as we were updating the review. His comment has now been addressed.
Contributors
Signe Flottorp
Influenza vaccination for healthcare workers who care for people aged 60 or older living in long‐term care, 24 February 2016
Summary
Dear Thomas et al,
Working with colleagues from PHE England we have just conducted an appraisal of all systematic reviews relevant to vaccinating healthcare workers in the UK. The rationale for this analysis was ongoing uncertainty among healthcare workers about the rational and evidence base for the current policy.
We included nine systematic reviews, including the Cochrane review ‘Influenza vaccination for healthcare workers who care for people aged 60 or older living in long‐term care institutions’.
We are concerned by the decision of the authors of the current Cochrane review to exclude two outcomes included in previous versions of their review, and disagree with the rationale they presented. The fact that these were the only two outcomes presenting statistically significant and clinically important results leaves the authors open to criticisms of academic bias.
While we accept that the outcomes ‘clinically suspected influenza’ and ‘all‐cause mortality’ are less specific than ‘proven influenza’ and ‘influenza‐related mortality’, there are good reasons for trial authors to choose these outcomes as they are easier to measure, and exclusion of this data from the review is unhelpful to policy makers and healthcare workers.
Policy makers using Cochrane reviews, require a transparent summary of the evidence for all policy relevant outcomes accompanied by an appraisal of the quality of that evidence. We believe that decisions about the relative importance of different outcomes, or the validity of different effects, should not be made by authors, whose job it is to summarise the available evidence, and then use formal processes such as GRADE to assess the certainty around the estimates.
Rather than adding clarity and transparency to the situation, we think that this decision by the Cochrane authors has added further confusion, and it would help policy makers to include these outcomes in the review.
I agree with the conflict of interest statement below: I certify that I have no affiliations with or involvement in any organization or entity with a financial interest in the subject matter of my feedback.
David Sinclair Affiliation: Cochrane Infectious Diseases Group Role: Joint Co‐ordinating Editor
Reply
Thank you for your comment. We reached the decision to exclude the non‐specific outcomes prior to the last version of the review for reasons which we summarise here. A review of estimates of influenza‐associated mortality in those ≥ 65 in statistical databases found that: (1) for studies which compared different statistical models “For four studies Poisson and ARIMA models produced higher estimates than Serfling, and Serfling higher than GLM. Which model is more accurate is unknown.” and (2) concluded that in estimating mortality from influenza: “Key problems are insufficient testing for influenza, using influenza‐like illness, heterogeneity of seasonal and pandemic influenza, population aging, and incomplete confounder control (co‐morbidities, frailty, vaccination history) …” (Thomas RE, Vaccine 2014;32:6884‐6901).
We provide further elaboration on the reasons not to use ILI in Appendix 1 to support our view that ILI is not an acceptable outcome measure. However, we have decided to reinstate the outcome of mortality since we recognise that decision‐makers will be interested to assess how far this outcome might be affected by vaccines. Since there will be some interest in the outcomes we provide below a table that reports the previous findings of this review for the outcomes of ILI with the original odds ratios:
| Outcome | Studies contributing data | Estimated effect (95% CI) |
| Influenza‐like illness | Potter 1997; Hayward 2006; Lemaitre 2009 | OR 0.71 (0.58 to 0.88) |
| GP consultations for ILI | Hayward 2006 | OR 0.48 (0.33 to 0.69) |
| Deaths from ILI | Hayward 2006 | OR 0.72 (0.31 to 1.70) |
Contributors
David Sinclair
What's new
| Date | Event | Description |
|---|---|---|
| 11 March 2016 | Feedback has been incorporated | Feedback comment added to the review |
| 27 October 2015 | New search has been performed | Searches conducted on 27 October 2015 identified 153 RCTs and 236 observational studies but no new studies were identified for inclusion in this update. We excluded five new trials (Amodio 2014; Bénet 2012; Enserink 2011; Riphagen‐Dalhuisen 2013; Wendelboe 2011). We searched clinical trials registries on 27 January 2016 and identified 11 citations, but no new studies were identified for inclusion. |
| 27 October 2015 | New citation required but conclusions have not changed | Our conclusions remain unchanged. |
History
Protocol first published: Issue 2, 2005 Review first published: Issue 3, 2006
| Date | Event | Description |
|---|---|---|
| 31 March 2013 | New search has been performed | Searches conducted. We identified 268 RCTs and 479 observational studies and no new studies were included in this 2013 review update. |
| 31 March 2013 | New citation required but conclusions have not changed | Based on our literature review, we now determine that two outcome measures, (influenza‐like illness (ILI) (Appendix 1) and all‐cause mortality (Appendix 6)), reported in the first and second publications of this review, are inappropriate measures of influenza vaccine effectiveness. They are not registered indications for the vaccine. Therefore, the outcome data from Hayward 2006 (main outcome measure all‐cause mortality and secondary outcome measure ILI) and Oshitani 2000 (outcome measure ILI) are no longer presented. |
| 10 December 2009 | Feedback has been incorporated | Feedback comment and reply added. |
| 21 June 2008 | Feedback has been incorporated | Feedback comment added. |
| 13 May 2008 | Amended | Converted to new review format. |
| 23 May 2006 | New search has been performed | Review first published, Issue 3, 2006. |
Acknowledgements
Professor David J. Stott, Academic Section of Geriatric Medicine, Glasgow Royal Infirmary, UK provided supplementary information on the Potter 1997 and Carman 2000 studies. Dr. Magali Lemaitre confirmed the ICC for Lemaitre 2009 and Dr. Andrew Hayward provided information regarding the analysis of data for Hayward 2006.
We acknowledge the contributions of Vittorio Demicheli (previously responsible for design of the review and responsible for the final draft of a previous version); Daniela Rivetti, who was responsible for the previous searches; and Sarah Thorning, who conducted the searches for the review updates to 2013 and Justin Clark, who did the search on 27 October 2015.
The authors wish to thank the following people for commenting on the draft of the second publication: Amy Zelmer, Laila Tata, Amir Shroufi, Rob Ware and John Holden. Finally, we thank Johannes van der Wouden for taking over as Contact Editor for the 2015 review update.
Appendices
Appendix 1. Reasons not to use influenza‐like illness in assessing the effectiveness of influenza vaccines
Influenza‐like illness (ILI)
We believe that there are seven reasons not to use ILI as an outcome.
There are multiple definitions. The Centers for Disease Control and Prevention (CDC) definition is a temperature ≥ 38°C, cough or sore throat or both and the absence of a known cause other than influenza (CDC 2006). Health Canada's Flu Watch uses fever, cough and ≥ one of sore throat, arthralgia, myalgia or prostration (www.phac‐aspc.gc.ca/fluwatch).
The percentage of ILI cases that are laboratory‐proven influenza cases is low. During the 2009 H1N1p pandemic in Marseille, GPs assessed 660 patients as ILI cases: 158 were positive for A/H1N1p. Of the 502 reverse‐transcriptase polymerase chain reaction (RT‐PCR) influenza‐negative patients 296 were randomly selected for further testing: 82 were positive for at least one other virus (58 human rhinovirus, nine parainfluenza viruses 1‐4, nine human coronavirus OC43, five enterovirus, four adenovirus and two human metapneumovirus) and 204 were negative for all 18 viruses tested (Thiberville 2012). A RCT in 46 Hutterite colonies in Canada defined ILI as fever ≥ 38°C, cough, runny nose, sore throat, headaches, sinus problems, muscle ache, fatigue, ear ache and chills but only 37 (26%) of 142 tested were PCR positive (Barbara 2012). A study in India defined ILI as sudden onset of fever > 38°C or a history of sudden onset of fever in the recent past (< three days), cough or sore throat and/or rhinorrhoea and SARI (severe acute respiratory infections) as an ILI with breathlessness or difficulty in breathing/tachypnoea or clinically suspected pneumonia (in children) with increased respiratory rates. They isolated influenza from only 617 (4.43%) of 13,928 throat or nasal swabs (Chadha 2011). A study in Taiwan of 26,601 ILI cases found influenza in only 25% by viral culture or RT‐PCR (Chuang 2012).
A review of 25 studies in which physicians had diagnosed patients as having ILI found in most studies < 25% are RT‐PCR positive, some patients had adenovirus, coronavirus, metapneumovirus, parainfluenza virus, picornavirus, respiratory syncytial virus, or multiple respiratory viruses, or bacteria, and 50% identified no pathogen (Thomas 2014a).
There is a remarkable similarity between the symptoms of influenza A/H1N1p and human rhinovirus. Of the 660 patients in Marseille, 85% had a fever (91% H1N1p, 79% HRV), 83% had a cough (97%, 86%), 75% had ILI symptoms (89%, 74%), 65% a sore throat (65%, 69%), 93% asthenia (96%, 88%), 80% myalgia (80%, 74%), 63% rhinorrhoea (74%, 81%), 77% headache (78%, 69%), 65% chills (74%, 52%), 40% arthralgia (41%, 31%) and 35% nausea (39%, 23%) (Thiberville 2012).
Some studies use ILI in circular definitions resulting in unclear outcomes. The Australian Flutracking programme defined ILI as the proportion of participants in their programme who had both fever and cough during the peak influenza period for each year 2007 to 2009. In a completely circular manner the peak influenza period was defined as the four consecutive weeks with the highest Flutracking ILI rates. No analysis was performed of whether any symptom correlated with laboratory‐proven influenza (Dalton 2011). A study of "influenza activity" in Hong Kong also achieved circularity by confounding together the laboratory proven influenza rate and the ILI rate: "The product of the laboratory influenza detection rate and the GP ILI consultation rate was used as the reference standard indicator of influenza virus activity, rather than the laboratory data alone which suffer from denominator dilution during periods of non‐influenza epidemics and the GP ILI data alone which suffer from numerator dilution because not all ILI episodes are associated with influenza" (Lau 2012).
Some studies argue that multiple viral activity databases which may have peaks at similar times measure the same phenomenon. A study in Singapore during the 2009 pandemic defined ILI by the WHO criteria, plus new onset respiratory symptoms and temperature > 38°C and multiplied the rate of ILI cases diagnosed by 23 sentinel GPs (n of patients not stated) by the “relative proportion of ILI seen by the average GP" and thereby estimated the ILI rate at 15% (Bayesian credible intervals 10%, 25%). A separate serological study of samples from 727 adult patients four weeks before, four weeks after the epidemic peak and four weeks after the epidemic subsided estimated the influenza rate at 17% (BCI 14%, 20%) and the two rates were presented as confirming each other. There was no relationship between the two samples, which were merely used to attempt estimates of the rate of ILI and influenza activity during the epidemic and no assessment was made of the utility of the ILI definition (Lee 2011). A study of "influenza activity" during 166 weeks in the US 2003‐8 compared the CDC Outpatient ILI Surveillance Network (which uses the CDC ILI definition and a network of "health care providers"), Google Flu Trends (weekly percentage of persons seeking health care with ILI) and the CDC Influenza Virologic Surveillance System. The Pearson correlation coefficient between Google Flu trends and CDC Virus surveillance was 0.72 (95% CI 0.64 to 0.79) and with CDC ILI surveillance was 0.94 (95% CI 0.92 to 0.96) and between the two CDC databases 0.85 (0.81 to 0.89). There was no attempt to identify individuals across all three databases and no assessment of the utility of symptoms (Ortiz 2011).
Influenza rapid diagnostic tests have low sensitivity. There is an increasing tendency to use rapid influenza diagnostic tests for ILI cases. A review of 159 studies evaluating 26 rapid influenza diagnostic tests found the pooled sensitivity was 62.3% (95% CI 57.9% to 66.6%) and specificity 98% (97.5% to 98.7%), with lower sensitivity in adults 53.9% (47.9% to 59.8%). If these are used to assess the effectiveness of influenza vaccines further inaccuracy will be introduced (Chartrand 2012).
Appendix 2. Previous search
For our original search in 2006 we searched the Cochrane Central Register of Controlled Trials (CENTRAL), the Cochrane Database of Systematic Reviews and the NHS Database of Abstracts of Reviews of Effects (DARE) (The Cochrane Library 2006, Issue 1); MEDLINE (January 1966 to Week 1, February 2006); EMBASE (1974 to March 2006); Biological Abstracts (1969 to December 2005) and Science Citation Index‐Expanded (1974 to March 2006).
MEDLINE was searched using the following search terms in combination with stages I, II and III of the highly sensitive search strategy defined by The Cochrane Collaboration and detailed in Appendix 5b of the Cochrane Handbook for Systematic Reviews of Interventions (Deeks 2005).
A search in 2013 identified no new studies for inclusion. A search on 27 October 2015 identified 153 RCTs and 236 observational studies. No studies were eligible for inclusion.
MEDLINE (OVID)
1 exp INFLUENZA/ 2 influenza.mp. 3 or/1‐2 4 exp VACCINES/ 5 exp VACCINATION/ 6 (immuniz$ or immunis$).mp. 7 vaccin$.mp. 8 or/4‐7 9 3 and 8 10 exp Influenza Vaccine/ 11 (influenz$ adj (vaccin$ or immun$)).mp. 12 or/10‐11 13 9 or 12 14 exp Health Personnel/ 15 (health personnel or healthcare personnel or health care personnel).mp. 16 (health worker$ or healthcare worker$ or health care worker$).mp. 17 (healthcare provider$ or health care provider$).mp. 18 (health practitioner$ or healthcare practitioner$ or health care practitioner$).mp. 19 health employee$.mp. 20 medical staff.mp. 21 (doctor$ or physician$).mp. 22 (allied health adj (staff or personnel)).mp. 23 paramedic$.mp. 24 nursing staff.mp. 25 nurse$.mp. 26 nursing auxiliar$.mp. 27 hospital personnel.mp. 28 hospital staff.mp. 29 hospital worker$.mp. 30 exp HOSPITALS/ 31 exp Long‐Term Care/ 32 exp Residential Facilities/ 33 nursing home$.mp. 34 (institution$ adj3 elderly).mp. 35 or/14‐34 36 13 and 35
This strategy was adapted to search the other electronic databases. See below for the EMBASE search strategy. There were no language or publication restrictions. The search of CENTRAL included trial reports identified in the systematic search by hand of the journal Vaccine. To identify additional published and unpublished studies the Science Citation Index‐Expanded was used to identify articles that cite the relevant studies. The relevant studies were also keyed into PubMed and the Related Articles feature used.
EMBASE (WebSPIRS)
#1 explode 'influenza‐' / all subheadings in DEM,DER,DRM,DRR #2 (influenza in ti) or (influenza in ab) #3 #1 or #2 #4 explode 'vaccine‐' / all subheadings in DEM,DER,DRM,DRR #5 explode 'vaccination‐' / all subheadings in DEM,DER,DRM,DRR #6 (immuniz* in ti) or (immuniz* in ab) #7 (immunis* in ti) or (immunis* in ab) #8 (vaccin* in ti) or (vaccin* in ab) #9 #4 or #5 or #6 or #7 or #8 #10 #3 and #9 #11 explode 'influenza‐vaccine' / all subheadings in DEM,DER,DRM,DRR #12 explode 'influenza‐vaccination' / all subheadings in DEM,DER,DRM,DRR #13 (influenz* adj (vaccin* or immun*)) in ti #14 (influenz* adj (vaccin* or immun*)) in ab #15 #10 or #11 or #12 or #13 or #14 #16 explode 'health‐care‐personnel' / all subheadings in DEM,DER,DRM,DRR #17 (health personnel or healthcare personnel or health care personnel) in ti #18 (health personnel or healthcare personnel or health care personnel) in ab #19 (health worker* or healthcare worker* or health care worker*) in ti #20 (healthcare provider* or health care provider*) in ti #21 (healthcare provider* or health care provider*) in ab #22 (health practitioner* or healthcare practitioner* or health care practitioner*) in ti #23 (health practitioner* or healthcare practitioner* or health care practitioner*) in ab #24 (health employee* in ti) or (health employee* in ab) #25 explode 'hospital‐personnel' / all subheadings in DEM,DER,DRM,DRR #26 explode 'hospital‐physician' / all subheadings in DEM,DER,DRM,DRR #27 explode 'medical‐personnel' / all subheadings in DEM,DER,DRM,DRR #28 (medical staff in ti) or (medical staff in ab) #29 explode 'physician‐' / all subheadings in DEM,DER,DRM,DRR #30 (doctor* or physician*) in ti #31 (doctor* or physician*) in ab #32 (allied health adj (staff or personnel)) in ti #33 explode 'paramedical‐personnel' / all subheadings in DEM,DER,DRM,DRR #34 (paramedic* in ti) or (paramedic* in ab) #35 explode 'nursing‐staff' / all subheadings in DEM,DER,DRM,DRR #36 ( nursing staff in ti) or ( nursing staff in ab) #37 ( nurse* in ti) or ( nurse* in ab) #38 ( nursing auxiliar* in ti) or ( nursing auxiliar* in ab) #39 (hospital staff in ti) or (hospital staff in ab) #40 (hospital worker* in ti) or (hospital worker* in ab) #41 explode 'hospital‐' / all subheadings in DEM,DER,DRM,DRR #42 explode 'long‐term‐care' / all subheadings in DEM,DER,DRM,DRR #43 explode 'residential‐care' / all subheadings in DEM,DER,DRM,DRR #44 explode 'residential‐home' / all subheadings in DEM,DER,DRM,DRR #45 (nursing home* in ti) or (nursing home* in ab) #46 (institution* adj elderly) in ti #47 (institution* adj elderly) in ab #48 #16 or #17 or #18 or #19 or #20 or #21 or #22 or #23 or #24 or #25 or #26 or #27 or #28 or #29 or #30 or #31 or #32 or #33 or #34 or #35 or #36 or #37 or #38 or #39 or #40 or #41 or #42 or #43 or #44 or #45 or #46 or #47 #49 #15 and #48
Bibliographies of all relevant articles were obtained and any published review and proceedings from relevant conferences were assessed for additional studies. We explored Internet sources in December 2005: NHS National Research Register (http://www.update‐software.com/national/); the metaRegister of Clinical Trials (http://www.controlled‐trials.com/) and the digital dissertations website (http://wwwlib.umi.com/dissertations). The Vaccine Adverse Event Reporting System website was searched (http://www.vaers.org). We contacted first or corresponding authors of relevant studies to identify further published or unpublished trials.
For the update search in September 2009 we searched the Cochrane Central Register of Controlled Trials (CENTRAL) (The Cochrane Library 2009, Issue 3), which contains the Cochrane Acute Respiratory Infections Group's Specialised Register and the Database of Abstracts of Reviews of Effects (DARE); MEDLINE (January 1966 to Week 3, September 2009); EMBASE (1974 to September 2009); Biological Abstracts (1969 to December 2005) and Science Citation Index‐Expanded (1974 to September 2009), which included Science Citation Index‐Expanded, Biosis Previews and Current Contents. There were no language restrictions.
Appendix 3. EMBASE search strategy
Embase.com
#23 #11 AND #24
#24 #22 AND #23
#23 #19 OR #20 OR #21
#22 #12 OR #13 OR #14 OR #15 OR #16 OR #17 OR #18
#21 (('long stay' OR 'long term') NEAR/2 (ward* OR facilit* OR hospital*)):ab,ti
#20 'nursing home':ab,ti OR 'nursing homes':ab,ti OR 'aged care':ab,ti OR hospice*:ab,ti OR (institution* NEAR/3 elderly):ab,ti OR 'old peoples homes':ab,ti OR 'old peoples home':ab,ti
#19 'health care facility'/de OR 'hospice'/de OR 'nursing home'/de OR 'residential home'/de OR 'geriatric hospital'/de OR 'hospital'/de OR 'public hospital'/de OR 'private hospital'/de
#18 (nursing NEAR/2 (staff OR personnel OR auxiliar* OR assistan*)):ab,ti
#17 paramedic*:ab,ti OR nurse*:ab,ti
#16 ('allied health' NEAR/2 (personnel OR staff OR employee* OR worker* OR professional*)):ab,ti
#15 doctor*:ab,ti OR physician*:ab,ti OR clinician*:ab,ti
#14 ((medical OR hospital) NEAR/2 (staff OR employee* OR personnel OR worker*)):ab,ti
#13 ((health OR 'health care' OR healthcare) NEAR/2 (personnel OR worker* OR provider* OR employee* OR staff OR professional*)):ab,ti
#12 'health care personnel'/exp
#11 #1 OR #10
#10 #5 AND #9
#9 #6 OR #7 OR #8
#8 immuniz*:ab,ti OR immunis*:ab,ti
#7 'immunization'/exp
#6 'vaccine'/exp OR 'vaccination'/de
#5 #2 OR #3 OR #4
#4 'influenza virus a'/exp OR 'influenza virus b'/de
#3 influenza*:ab,ti OR flu:ab,ti
#2 'influenza'/exp
#1 'influenza vaccine'/de
Appendix 4. Web of Science search strategy
| # 5 | 301 | #4 AND #3 Databases=SCI‐EXPANDED, CPCI‐S Timespan=All Years Lemmatization=On |
| # 4 | 1,300,160 | Topic=(random* or placebo* or crossover* or "cross over" or allocat* or ((singl* or doubl*) NEAR/1 blind*)) OR Title=(trial) Databases=SCI‐EXPANDED, CPCI‐S Timespan=All Years Lemmatization=On |
| # 3 | 981 | #2 AND #1 Databases=SCI‐EXPANDED, CPCI‐S Timespan=All Years Lemmatization=On |
| # 2 | 88,201 | Topic=(((health or "health care" or healthcare or hospital or medical) NEAR/2 (personnel or worker* or employee* or staff or professional*)) or doctor* or physician* or clinician* or nurs* or paramedic* or "allied health") AND Topic=(hospital* or hospice* or "residential facilities" or "residential facility" or "nursing homes" or "nursing home" or "aged care" or "old peoples home" or "old peoples homes" or (institution* NEAR/3 elderly) or (("long term" or "long stay") NEAR/3 (ward* or facilit* or hospital*))) Databases=SCI‐EXPANDED, CPCI‐S Timespan=All Years Lemmatization=On |
| # 1 | 16,674 | Topic=((influenza* or flu) NEAR/4 (vaccin* or immunis* or immuniz*)) Databases=SCI‐EXPANDED, CPCI‐S Timespan=All Years Lemmatization=On |
Appendix 5. SIGN search strategy for observational studies
1 epidemiologic studies/ 2 exp case‐control studies/ 3 exp Cohort Studies/ 4 case control.tw. 5 (cohort adj (study or studies)).tw. 6 cohort analy*.tw. 7 (follow up adj (study or studies)).tw. 8 (observational adj (study or studies)).tw. 9 longitudinal.tw. 10 retrospective.tw. 11 cross sectional.tw. 12 Cross‐Sectional Studies/ 13 or/1‐12
Appendix 6. Reasons not to use all‐cause mortality as an outcome measure in assessing the effectiveness of influenza vaccines
All‐cause mortality
There are three reasons not use all‐cause mortality to assess the effectiveness of influenza vaccine.
Mortality attributable to influenza is a small proportion of all deaths. For those aged ≥ 65 in the US national multiple‐cause‐of‐death databases 1968 to 2001 mortality attributable to pneumonia or influenza never exceeded 10% of all winter deaths (Simonsen 2006). All‐cause deaths could be subject to considerable bias and fluctuations as an estimate of influenza mortality.
The number of nursing home residents with proven respiratory infections is low. A unique inclusive prospective study in France of 44,869 nursing home residents aged ≥ 65 found < 4.5% of the nursing home residents studied had an upper or lower respiratory tract infection, with 1.31% definite (95% CI 1.09 to 1.68) (using McGeer's consensus definition, which is a physician diagnosis (McGeer 1991)) and 3.34% probable (2.88 to 3.87). Influenza vaccine had been received by 93.4% of the patients and pneumococcal vaccine by 13% (Chami 2011).
-
Many cases of "influenza" are not laboratory‐proven and are not recorded on death certificates. Three statistical approaches have attempted to use existing databases to predict mortality due to influenza.
The first assumes all differences in mortality comparing virus and non‐virus seasons are due to influenza. A study in France using data from a sentinel network of GPs estimated only 3.35% (176,053) of all 5,295,480 deaths from 1998 to 2007 were due to ILI and 2.14% (113,240) due to cold spells. Mortality in the four winter months correlated with reported ILI (r = 0.75, P value = 0.02) (Pin 2012). A study in the US and Japan had similar findings (Charu 2011). Mortality due to influenza cannot be estimated from these ILI data.
The second distributes "influenza related deaths" among co‐morbidities. A study of weekly mortality data from the US National Health Statistics database 1997 to 2007 attributed an average of 11.92 (95% CI 10.1 to 13.6) deaths/100,000 to influenza, with 9.41 (8.3 to 10.5) to A/H3N2 years and 2.51 to influenza B years. These 11.92 deaths/100,000 ascribed to influenza were then further partitioned into: all circulatory causes 4.6 (3.79 to 5.39), all respiratory 3.58 (3.04 to 4.14), cancer 0.87 (0.68 to 1.05), diabetes 0.33 (0.26 to 0.39), renal disease 0.19 (0.14 to 0.24), CNS 0.42 (0.31 to 0.53) and Alzheimer’s 0.41 (0.3 to 0.52) and the authors concluded that 69% of the "influenza associated mortality" was attributable to circulatory and respiratory causes (Goldstein 2012). A study in the US and South Africa estimated excess deaths over baseline winter deaths as 16% for South Africa and 6% for the US. Within co‐morbidity diagnoses the percentage of excess deaths over baseline winter deaths for all respiratory causes was estimated as 25% and 14%, for pneumonia and influenza as 29% and 20%, for cerebrovascular events as 16% and 4%, for diabetes as 13% and 5% and for ischaemic heart disease as 9% and 6% (Cohen 2010). A study in Canada assumed that recorded influenza‐certified deaths substantially underrepresented influenza activity and estimated there were 3834 (1.9%) "influenza‐attributable deaths" and allocated 877 to ischaemic heart disease, 563 to pneumonia, 529 to chronic obstructive pulmonary disease (COPD), 349 to other heart disease, 295 to cancer and 249 to stroke and then assessed whether their statistical model provided good predictions of these allocated deaths (Schanzer 2007). The precise number of deaths due to influenza cannot be known from these data and statistical methods.
The third computes a moving mortality average for the 13‐month period centred on each month, assuming that these 13‐month periods would be "unaffected by preceding or following epidemics." For each disease class and month the 13‐month moving average is then subtracted from the observed mortality. For unpublished data 1959 to 1999 from the public use data files of the US National Center for Health Statistics the authors created a time series for each class with a common metric by converting data into z scores with a mean of zero and standard deviation of 1. The peak months for pneumonia and influenza coincided with those for ischaemic heart disease 34 of 40 times, with cerebrovascular disease 33 of 40 times and with diabetes 30 of 40 times. However, midwinter peaks for pneumonia and influenza, ischaemic heart disease, cerebrovascular disease and diabetes varied in size and differed widely in mean values and seasonal variation. As expected, the tallest peaks in mortality curves occurred during the A(H3N2) 1968/9 pandemic and were lower in years where influenza A(H1N1) and B predominated and categorisation by influenza type correctly sorted winter seasons as having low or high mortality, without requiring additional information (Reichert 2004). The precise number of deaths due to influenza cannot be known from these data and statistical methods.
A review of studies that used large databases to estimate mortality due to influenza identified four studies, which analysed the data with several statistical models: Poisson and ARIMA models produced higher mortality estimates than Serfling, and Serfling higher than GLM. It is unknown which model is more accurate (Thomas 2014b).
Appendix 7. Assessment of Oshitani 2000 using the Newcastle‐Ottawa Scale for non‐RCTs (Wells 2005)
Selection
1. Representativeness of the exposed cohort: a. truly representative of the average Long Term Care Facilities in Niigata Prefecture and City (mandatory surveys of influenza vaccination status and influenza‐like illness occurrence every 2 weeks January to March 1999) in the community b. somewhat representative of the average ___________ in the community c. selected group of users (e.g. nurses, volunteers) d. no description of the derivation of the cohort
2. Selection of the non‐exposed cohort: a. drawn from the same community as the exposed cohort b. drawn from a different source c. no description of the derivation of the non‐exposed cohort
3. Ascertainment of exposure to influenza vaccine: a. secure record (e.g. surgical records) b. structured interview. "Mandatory survey." "Influenza vaccine had been given to 3933 residents (30.8%). No resident had received vaccine in 75 facilities (50.3%). Vaccines had also been given to 1532 of 7459 staff and 10 or more staff had been vaccinated in 47 facilities (31.5%)." No description of survey or how administered or how completeness ascertained. c. written self report d. no description
4. Demonstration that outcome of interest was not present at start of study: a. yes "An influenza outbreak was defined when the number of ILI per week exceeded 10% of the residents" b. no
Comparability
1. Comparability of cohorts on the basis of the design or analysis: a. study controls for differences in demographic characteristics and co‐morbidities of residents who were vaccinated and characteristics of homes where residents received vaccination (select the most important factor) No b. study controls for any additional factor: geriatric health services facilities compared to special nursing homes for those with more severe conditions (this criteria could be modified to indicate specific control for a second important factor) No
Outcome
1. Assessment of outcome: a. independent blind assessment b. record linkage c. self report "Mandatory survey every 2 weeks January to March 1999" d. no description
2. Was follow‐up long enough for outcomes to occur (select an adequate follow‐up period for outcome of interest): a. yes ‐ January to March 1999 b. no
3. Adequacy of follow‐up of cohorts: a. complete follow‐up ‐ all subjects accounted for b. subjects lost to follow‐up unlikely to introduce bias ‐ small number lost (> ___ % (select an adequate %) to follow‐up, or description of those lost)) c. follow‐up rate < ___% (select an adequate %) and no description of those lost d. no statement. No statement of admissions, deaths or separations from homes during study period. Total number of residents in Table 2 in homes where < 10 staff vaccinated is listed as 8699 but subcategories add to 8669 and in homes where >= 10 staff vaccinated listed as 4085 but subcategories add to 4073
Data and analyses
Comparison 1. HCWs offered vaccination versus HCWs offered no vaccination: experimental design; data for periods of high influenza activity (three C‐RCTs; Carman 2000 and Potter 1997 152 days; Lemaitre 2009 118 days).
| Outcome or subgroup title | No. of studies | No. of participants | Statistical method | Effect size |
|---|---|---|---|---|
| 1 Influenza | 2 | 752 | Risk Difference (M‐H, Random, 95% CI) | ‐0.00 [‐0.03, 0.03] |
| 1.1 Unvaccinated residents | 1 | 225 | Risk Difference (M‐H, Random, 95% CI) | 0.01 [‐0.03, 0.05] |
| 1.2 Vaccinated and unvaccinated residents | 1 | 527 | Risk Difference (M‐H, Random, 95% CI) | ‐0.01 [‐0.05, 0.03] |
| 2 Lower respiratory tract infection | 1 | 1059 | Risk Difference (M‐H, Random, 95% CI) | ‐0.02 [‐0.04, 0.01] |
| 2.1 Vaccinated residents | 1 | 538 | Risk Difference (M‐H, Random, 95% CI) | ‐0.02 [‐0.05, 0.01] |
| 2.2 Unvaccinated residents | 1 | 521 | Risk Difference (M‐H, Random, 95% CI) | ‐0.02 [‐0.06, 0.03] |
| 3 Admission to hospital for respiratory illness | 1 | Risk Difference (M‐H, Random, 95% CI) | Totals not selected | |
| 3.1 Vaccinated and unvaccinated residents | 1 | Risk Difference (M‐H, Random, 95% CI) | 0.0 [0.0, 0.0] | |
| 4 Deaths from influenza or its complications | 2 | Risk Difference (M‐H, Random, 95% CI) | Totals not selected | |
| 4.1 Vaccinated residents | 1 | Risk Difference (M‐H, Random, 95% CI) | 0.0 [0.0, 0.0] | |
| 4.2 Unvaccinated residents | 1 | Risk Difference (M‐H, Random, 95% CI) | 0.0 [0.0, 0.0] | |
| 4.3 Vaccinated and unvaccinated residents | 1 | Risk Difference (M‐H, Random, 95% CI) | 0.0 [0.0, 0.0] | |
| 5 Death from any cause | 4 | Risk Difference (M‐H, Fixed, 95% CI) | Totals not selected | |
| 5.1 Vaccinated residents | 1 | Risk Difference (M‐H, Fixed, 95% CI) | 0.0 [0.0, 0.0] | |
| 5.2 Unvaccinated residents | 1 | Risk Difference (M‐H, Fixed, 95% CI) | 0.0 [0.0, 0.0] | |
| 5.3 Vaccinated and unvaccinated residents | 3 | Risk Difference (M‐H, Fixed, 95% CI) | 0.0 [0.0, 0.0] |
Comparison 2. HCWs offered vaccination versus HCWs offered no vaccination; three C‐RCTs (Carman 2000, Potter 1997, Lemaitre 2009) (adjusted analyses).
| Outcome or subgroup title | No. of studies | No. of participants | Statistical method | Effect size |
|---|---|---|---|---|
| 1 Influenza | 2 | 493 | Risk Difference (M‐H, Random, 95% CI) | 0.00 [‐0.03, 0.03] |
| 1.1 Unvaccinated residents | 1 | 160 | Risk Difference (M‐H, Random, 95% CI) | 0.01 [‐0.03, 0.05] |
| 1.2 Vaccinated and unvaccinated residents | 1 | 333 | Risk Difference (M‐H, Random, 95% CI) | ‐0.01 [‐0.06, 0.04] |
| 2 Pneumonia | 1 | 351 | Risk Difference (M‐H, Random, 95% CI) | ‐0.02 [‐0.06, 0.03] |
| 2.1 Vaccinated residents | 1 | 178 | Risk Difference (M‐H, Random, 95% CI) | ‐0.02 [‐0.08, 0.03] |
| 2.2 Unvaccinated residents | 1 | 173 | Risk Difference (M‐H, Random, 95% CI) | ‐0.01 [‐0.08, 0.06] |
| 3 Admission to hospital for respiratory illness | 1 | 1789 | Risk Difference (M‐H, Random, 95% CI) | 0.00 [‐0.02, 0.03] |
| 3.1 Vaccinated and unvaccinated residents | 1 | 1789 | Risk Difference (M‐H, Random, 95% CI) | 0.00 [‐0.02, 0.03] |
| 4 Deaths from influenza or its complications | 2 | Risk Difference (M‐H, Random, 95% CI) | Totals not selected | |
| 4.1 Vaccinated residents | 1 | Risk Difference (M‐H, Random, 95% CI) | 0.0 [0.0, 0.0] | |
| 4.2 Unvaccinated residents | 1 | Risk Difference (M‐H, Random, 95% CI) | 0.0 [0.0, 0.0] | |
| 4.3 Vaccinated and unvaccinated residents | 1 | Risk Difference (M‐H, Random, 95% CI) | 0.0 [0.0, 0.0] | |
| 5 Death from any cause | 4 | Risk Difference (M‐H, Fixed, 95% CI) | Totals not selected | |
| 5.1 Vaccinated residents | 1 | Risk Difference (M‐H, Fixed, 95% CI) | 0.0 [0.0, 0.0] | |
| 5.2 Unvaccinated residents | 1 | Risk Difference (M‐H, Fixed, 95% CI) | 0.0 [0.0, 0.0] | |
| 5.3 Vaccinated and unvaccinated residents | 3 | Risk Difference (M‐H, Fixed, 95% CI) | 0.0 [0.0, 0.0] |
2.2. Analysis.
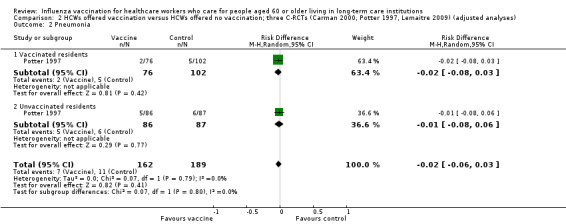
Comparison 2 HCWs offered vaccination versus HCWs offered no vaccination; three C‐RCTs (Carman 2000, Potter 1997, Lemaitre 2009) (adjusted analyses), Outcome 2 Pneumonia.
2.4. Analysis.

Comparison 2 HCWs offered vaccination versus HCWs offered no vaccination; three C‐RCTs (Carman 2000, Potter 1997, Lemaitre 2009) (adjusted analyses), Outcome 4 Deaths from influenza or its complications.
2.5. Analysis.
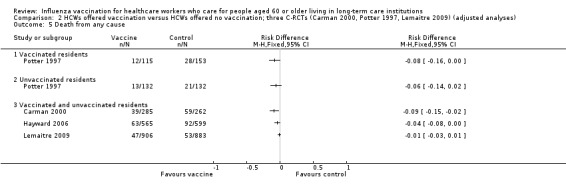
Comparison 2 HCWs offered vaccination versus HCWs offered no vaccination; three C‐RCTs (Carman 2000, Potter 1997, Lemaitre 2009) (adjusted analyses), Outcome 5 Death from any cause.
Characteristics of studies
Characteristics of included studies [ordered by study ID]
Carman 2000.
| Methods | Purpose: to assess the effects of staff vaccination against influenza on resident mortality in long‐term care hospitals Design: cluster‐randomised study (C‐RCT) conducted in Scotland during the 1996 to 1997 influenza season. The study identified 10 long‐term care geriatric hospitals in West and Central Scotland with a policy of vaccinating all patients against influenza if they had no contraindications and then only on the request of the patients or their relatives. Pairs of hospitals in each of these clusters were matched on patient enrolment and then in a Latin square design were randomised by a table of random numbers for the HCWs to be offered influenza vaccination or not Anonymous questionnaires were sent to ward nurses on 31 March 1997 to ask if they had received influenza vaccination and these data were used to estimate vaccine acceptance for all HCWs in hospitals where influenza vaccine had not been offered to HCWs. In each hospital a random sample chosen by computer of 50% patients was selected for virological monitoring Data from the Scottish Centre for Infection and Epidemiological Health and from GPs were used to define the start of the influenza season. Combined nasal and throat swabs were taken from patients every 2 weeks from 14 December 1996 to 14 February 1997. Opportunistic samples were also taken from patients whom the ward nurses thought had influenza. Samples were taken within 12 hours of death of any patient who died. Samples were analysed by RT‐PCR analysis Results were summarised for the 2 groups of LTCIs. Hospitals were not well‐matched for patient vaccination rates and Barthel scores (Wikipedia 2009) and post‐hoc statistical adjustments could not be made because of missing data. The outcome was the empirical logic of mortality for each cluster (= natural logarithm of the odds on death) Statistics: the power calculation was based on the previous study by Potter 1997 and the authors computed that with 1600 patients in 20 hospitals they would have ≥ 80% power to detect a decrease in mortality from 15% to 10% with alpha = 0.05 (2‐tailed), allowing for the clustered design. The power calculation for virological sampling showed that 500 patients would be required to give 80% power at 5% significance (2‐tailed) to detect a decrease in influenza infection from 25% to 15% Mortality rates were compared in the 2 groups with the Mann‐Whitney test. "Incomplete data for patient‐level covariates meant that a full multilevel approach to the analysis was not possible without making strong, implausible and untestable assumptions about the mechanisms that led to the incomplete data. Instead, we calculated summary statistics to describe the mix of patients in each hospital and these values were included in a multiple linear‐regression analysis. The response variable in these analyses was the empirical logit of each hospital's mortality rate that is, the natural logarithm of the odds on death." |
|
| Participants | Country: Scotland Setting: 20 long‐term care hospitals in Glasgow Eligible participants: 749 participants were residents of facilities in the arm in which 1217 HCWs were offered vaccination (620 accepted) and 688 in the arm in which HCWs were not offered vaccination. Day and night nurses, doctors, therapists, porters and ancillary staff (including domestic staff and ward cleaners) were offered influenza vaccination Age: 82 Gender: 70% F |
|
| Interventions | Intervention: influenza vaccination. The type, dosage and route are not described. A good match in the study year between the prevailing strain and the vaccine strains was reported Control: no influenza vaccination |
|
| Outcomes |
(N.B. clinical outcomes were not reported but were used to investigate the viral circulation in the facility) |
|
| Notes | The situation that 10 long‐term care hospitals had a policy of routinely vaccinating residents for influenza vaccination and 10 did not, permitted a Latin square design RCT of offering influenza vaccination or not to HCWs within each of these clusters
Analysis was not according to intention‐to‐treat Mean cluster size: 72 (based on mortality data) Intra‐cluster correlation coefficient: 0.023 as reported in Hayward 2006 Despite no difference in isolation of influenza viruses between clusters, the authors conclude that vaccines are protective. In addition, they fail to comment on the implausibility of the vaccines' effect on aspecific outcomes (ILI) and lack of effect on influenza |
|
| Risk of bias | ||
| Bias | Authors' judgement | Support for judgement |
| Random sequence generation (selection bias) | Low risk | "Hospitals were randomly allocated ... by random‐numbers table." |
| Allocation concealment (selection bias) | Unclear risk | Not stated |
| Blinding (performance bias and detection bias) All outcomes | Unclear risk | Not stated |
| Incomplete outcome data (attrition bias) All outcomes | High risk | In the 10 hospitals where HCWs were offered vaccination 749 patients were included and "a random sample of 375 patients was offered virological screening by nose/throat swab"; 258 accepted. In the 10 hospitals where HCWs were not offered vaccination 688 patients were included and a random sample of 344 were offered virological screening by nose/throat swab; 269 accepted. Note comments by authors in the Description section above on incomplete data. Polymerase chain reaction (PCR) samples were obtained from only 17% of deaths. 4 samples from each patient surveyed were planned from protocol: 1798 samples were obtained from 719 patients (2.5 samples/patient) |
| Selective reporting (reporting bias) | Low risk | No selective reporting |
| Other bias | High risk |
|
Hayward 2006.
| Methods | Purpose: to increase staff vaccination rates in care homes by adoption of a policy to encourage staff to be vaccinated against influenza and providing vaccination clinics Design: C‐RCT; 48 nursing homes were placed in matched pairs (by size of home, % of high dependency and mortality of residents) within 3 regions (northern, central and southern England), then the 25 homes that most closely matched were selected and randomised by a researcher, blinded to the home's identity and characteristics, using a table of random numbers. Data from the Royal College of General Practitioners sentinel surveillance scheme were used to divide the study into periods of influenza activity and no influenza activity Duration of study: 3 November 2003 to 28 March 2004 and 1 November 2004 to 27 March 2005 Interval between intervention and when outcome was measured: 3 November 2003 to 28 March 2004 and 1 November 2004 to 27 March 2005 Power computation: to detect reduction in all‐cause mortality of residents from 15% to 10% (intra‐cluster variance = 2.3%) with 90% power and alpha = 0.05% level required 20 pairs of homes each with an average of 20 residents (based on findings from pilot study) Statistics: outcomes were analysed using aggregate data for each cluster and "to take account of the matched clustered design we used a random‐effects meta‐analysis. This treated the results from each pair of homes as a separate study and provided a pooled estimate of effect weighted for the size of homes and the size of the effects and their standard errors." "When significant protection of residents was observed we calculated the number of staff vaccinations needed to prevent one event in residents (number needed to treat) as number of vaccinations given in all intervention homes divided by the average number of residents in all intervention homes multiplied by the weighted rate difference." |
|
| Participants | Country: UK Setting: private chain of nursing homes, whose policy was not to offer influenza vaccination to staff Eligible participants: (health status): 1 intervention and 1 control home were unable to provide data so they and their matched home were excluded, leaving 44 homes for analysis; eligible staff were all staff in intervention homes (full‐time: n = 844 in both 2003 to 2004 and in 2004 to 2005) and (part‐time: n = 766 in 2003 to 2004 and n = 882 in 2004 to 2005) Age: Avg 83 Gender: 71% F | |
| Interventions | Intervention 1: Adoption of policy in intervention homes of vaccinating staff against influenza, including a lead nurse in each home was trained to promote vaccination of staff; distribute leaflets and posters and liaise to provide 3 vaccination clinics for staff in each home. Staff were sent a letter explaining the study and the potential benefits of influenza vaccination Control: staff in control homes received a letter describing the study and the Department of Health recommendation that those with chronic illnesses should receive influenza vaccination No attempt to influence vaccination of residents in any home | |
| Outcomes | Primary outcome of the study: to assess effect of vaccinating staff on all‐cause mortality of residents Secondary outcomes: ILI (defined as fever 37.8°C measured orally, or an acute deterioration in physical or mental ability, plus either new onset or one or more respiratory symptoms or an acute worsening of a chronic condition involving respiratory symptoms), mortality with ILI, admission to hospital from any cause, admission to hospital with ILI and consultations with a GP for ILI Other outcomes measured: % of staff vaccinated Time points from the study that are considered in the review or measured or reported in the study: 3 November 2003 to 28 March 2004 and 1 November 2004 to 27 March 2005 % of staff vaccinated: by 28 March 2004 for first year of study and by 27 March 2005 for second year of study: full‐time staff: intervention group 407/844 vaccinated; control group 51/859 Part‐time staff: intervention group 163/766 vaccinated; control group 33/815 | |
| Notes | Funding: UK Department of Health
Mean cluster size: 71 Intra‐cluster correlation coefficient: 0.023 Vaccine content was not reported. No conclusions on matching can be drawn |
|
| Risk of bias | ||
| Bias | Authors' judgement | Support for judgement |
| Random sequence generation (selection bias) | Low risk | "A researcher blinded to the home’s identity and characteristics carried out randomisation within those pairs using random number tables." |
| Allocation concealment (selection bias) | Low risk | "A researcher blinded to the home’s identity and characteristics carried out randomisation." |
| Blinding (performance bias and detection bias) All outcomes | Unclear risk | No statement |
| Incomplete outcome data (attrition bias) All outcomes | High risk | "No outcome data were available for the excluded homes so an intention to treat analysis was not possible." |
| Selective reporting (reporting bias) | Unclear risk | Although the study does not contribute data for relevant outcomes we are unable to ascertain whether influenza‐specific outcome data were collected and analysed |
| Other bias | Low risk | No other issues were identified |
Lemaitre 2009.
| Methods | Purpose: to assess the effect of staff and resident influenza vaccination on resident all‐cause mortality Design: C‐RCT. A written invitation was sent to the 376 nursing homes with 50 to 200 elderly people (out of a total 1105 nursing homes) in the Paris area and 88 responded. Of these, 40 with staff influenza coverage < 40% during the 2005 to 2006 winter season were selected. Each institution was pair‐matched on size, staff vaccination coverage 2005 to 2006 and Group Iso Resources (GIR) weighted average disability score (which ranges from 1 = severe disability to 6 = total autonomy). Randomisation was centrally based using a random number generator Statistics: it was assumed that the influenza epidemic would last 2 months, mortality would be 8% in the control arm and resident mortality would be reduced 40% after staff vaccination to 4.8% in the intervention arm. 20 pairs of nursing homes with 2000 residents in each group were required to obtain 80% power with 2‐tailed hypothesis testing. Analysis was by intention‐to‐treat. "Odds ratios were calculated using alternating logistic regression, with one‐nested log odds ratios to model the association between the responses of the same pair and the same nursing home within the pair." "In secondary analyses, multivariate estimates were adjusted for the residents' age, vaccination status, GIR disability score and Charlson comorbidity index." |
|
| Participants | Country: France Setting: 40 nursing homes near Paris Eligible participants: 3483 patients in the 40 nursing homes In the intervention arm there were 1592 residents at the beginning and 130 entered the homes during the study period (total = 1722); 989 staff were present at recruitment and 678 (68.6%) were vaccinated. In the control arm there were 1558 residents at the beginning and 120 entered the homes during the study period (total = 1678); there were 1015 staff at recruitment and 323 (31.8%) were vaccinated 1452 (84.3%) of patients in the intervention and 1385 (82.5%) in the control group were vaccinated during the 2005 to 2006 winter season Age: 86 Gender: 77.% F |
|
| Interventions | Intervention:
Control: routine information on influenza vaccination |
|
| Outcomes | Primary: all‐cause mortality Secondary:
|
|
| Notes | Design effect: 1.9; source: reported in published paper and confirmed by Magali Lemaitre Choice of main outcome is inappropriate |
|
| Risk of bias | ||
| Bias | Authors' judgement | Support for judgement |
| Random sequence generation (selection bias) | Low risk | "Randomisation was centrally based using a random‐number generator" |
| Allocation concealment (selection bias) | Unclear risk | Not stated |
| Blinding (performance bias and detection bias) All outcomes | Unclear risk | Not stated |
| Incomplete outcome data (attrition bias) All outcomes | Low risk | During primary study period. Intervention group: 1592 residents at beginning + 130 entered and 1722 analysed; Control group: 1558 residents at the beginning, 120 entered, 1678 analysed (no statement of deaths or separations) Intervention group 989 staff (678 vaccinated); control group 1015 staff (estimated vaccination rate 31.8%) |
| Selective reporting (reporting bias) | Low risk | No selective reporting |
| Other bias | High risk | Performance bias (delivery of influenza vaccine to intervention arm) |
Oshitani 2000.
| Methods | Purpose: to assess the effect of staff and resident influenza vaccination rates on resident influenza‐like illness (ILI) Design: prospective cohort study assessing the effectiveness of influenza vaccination levels in patients of long‐term nursing care facilities (LTCIs) by vaccination coverage rates of HCWs (less than 10 or more than 10 vaccinated HCWs per facility), in Niigata, Japan. Niigata Prefecture and Niigata City conducted mandatory surveys of influenza vaccine status and occurrence of ILI every 2 weeks from January to March 1999. During this period more than 20% of facilities had outbreaks and more than 10% of residents experienced ILI during an influenza A (H3N2) epidemic. All LTCIs in Niigata Prefecture provided reports. Information (assumed questionnaires) included number of residents in each institution, number of vaccinated residents and staff and weekly ILI in residents. No ILI definition is reported An influenza outbreak was defined as 10% of more of the residents in a home reporting ILI symptoms during a week 2 types of LTCIs, special nursing homes for the elderly and geriatric health services facilities, were used. Both are for the elderly who need constant care, special nursing homes are for the elderly who have more severe conditions Statistics: X2 and Fisher's exact test for univariate analysis. X2 for linear trend and Mantel‐Haenszel ORs for different categories of resident vaccination rates. Logistic regression for multivariate analysis of outbreak status | |
| Participants | Country: Japan Setting: 149 LTCIs in Niigata Prefecture and Niigata City Eligible participants: the text reports 12,784 residents in 149 facilities were included in the study with 3933 (30.8%) vaccinated and 7459 staff with 1532 (20.5%) vaccinated. However, table 2 shows 8669 residents living in homes where fewer than 10 staff were vaccinated and 4073 living in homes with 10 staff vaccinated, for a total of 12,742. The totals for residents living in homes with fewer than 10 staff vaccinated is given as 8699 but the subcategories add to 8669 and for the homes where 10 staff were vaccinated the total is given as 4085 but the subcategories add to 4073 Age: not stated Gender: not stated | |
| Interventions | Intervention: trivalent influenza vaccine containing A/Beijing/262/95 (H1N1), A/Sydney/5/97 (H3N2) and B/Mie/1/93, which was a good match against the circulating strain. No mention of pneumococcal vaccination is made Control: no control group | |
| Outcomes | ILI (no case definition). During the period of surveying the number of ILI cases per week exceeded 10% of the residents in 34 (22.8%) of facilities | |
| Notes | Choice of outcome is inappropriate (ILI is a non‐specific outcome) Assessment of the Oshitani study was undertaken with the Newcastle‐Ottawa scale (see Appendix 7) |
|
| Risk of bias | ||
| Bias | Authors' judgement | Support for judgement |
| Random sequence generation (selection bias) | Unclear risk | ‐ |
| Allocation concealment (selection bias) | Unclear risk | ‐ |
| Blinding (performance bias and detection bias) All outcomes | Unclear risk | ‐ |
| Incomplete outcome data (attrition bias) All outcomes | Unclear risk | ‐ |
| Selective reporting (reporting bias) | Unclear risk | ‐ |
| Other bias | Unclear risk | ‐ |
Potter 1997.
| Methods | Purpose: to assess the effect of staff and patient vaccination against influenza in residents
Design: 6 geriatric long‐stay hospitals in Glasgow in 1994 had an "opt‐out" policy in which patients were routinely given influenza vaccine unless they refused it or had a major contraindication and 6 had an "opt‐in" policy in which patients were given vaccine only if they or their relatives requested it following advertisement on the ward that it was available Hospitals were stratified by policy on vaccination then randomised for their HCWs to be "routinely offered either influenza vaccination or no vaccination." Study conducted in Scotland, during the 1994 to 1995 influenza season, in the community. Follow‐up period was 1 October 1994 to 31 March 1995. 12 hospitals were randomly allocated to offer vaccination of HCWs or not; facilities were grouped according to the vaccination policy. The vaccination of staff and patients was voluntary. The study thus presents data on 4 sub‐populations: ‐ staff and patients not vaccinated (S0P0) ‐ staff not vaccinated, patients vaccinated (S0PV) ‐ staff and patients vaccinated (SVPV) ‐ staff vaccinated and patients not vaccinated (SVP0) Statistical analysis: "Baseline characteristics, morbidity and mortality in the 4 groups of hospitals were compared using the X2 test, unpaired Student's test and Wilcoxon rank sum test as appropriate. Odds ratios and 95% CIs were calculated for the effects of staff and patient vaccination. Survival analysis was by Kaplan‐Meier product limit estimates, using the Tarone Ware test for statistical significance. Cluster analysis, examining mortality rates and other outcomes by hospital site, was also done." |
|
| Participants | Country: Scotland Setting: 12 geriatric medical long‐term care hospitals in Glasgow Eligible participants: 1059 hospital residents. All 1078 HCWs (day and night nurses and nursing auxiliaries, ward cleaners, doctors, therapists and porters) in SVPV and SVP0 hospitals were offered vaccination but "voluntary workers, patients' friends and relatives and other casual or occasional ward visitors were not offered vaccine." Observed units were hospitals and not patients 654 (61%) of the 1078 agreed to participate; vaccination was contraindicated in 34 (3%) and 47 (4%) were on long‐term sick leave and unavailable The physical dependency level of patients was measured on the 20‐point Barthel scale. The hospitals where patients were routinely offered vaccination (S0PV and SVPV) had lower Bartel scores (P value = 0.003) than those not offered vaccination but there were no differences between hospitals where HCWs were vaccinated and those where they were not Age: 77 Gender: 71% F |
|
| Interventions | Vaccination of patients and HCWs began October 1994 ("4 weeks before the earliest likely start date of the annual influenza outbreak"). Parenteral influenza vaccine. Vaccine strains probably matched the circulating strain | |
| Outcomes |
All deaths and discharges and admissions to the wards were recorded Ward staff notified the research nurse of any patient who developed clinical symptoms of upper respiratory tract viral illness, influenza or lower respiratory tract infection and the research nurse visited the patient within 24 hours to record symptoms, clinical signs and investigations on standardised forms. "Chest radiographs were not included as part of the routine assessment of suspected lower respiratory tract infection, as for many of the peripheral hospitals, it would have required an ambulance journey for the patient." "Patients with suspected viral illness who gave verbal consent had a nasopharyngeal aspirate (NPA) sample obtained within 48 hours of notification of symptoms. IFA for influenza A and B, respiratory syncytial virus (RSV), Chlamydia psittaci and adenovirus antigens" were obtained Antibody levels to Mycoplasma pneumoniae (M. pneumoniae) were ascertained by complement fixation in consenting patients who had not received influenza vaccination |
|
| Notes | Staff vaccination was incomplete and variable; results were presented by hospital group and not by vaccination status of patients. The authors concluded that vaccination of HCWs was associated with lower mortality and ILI. These benefits were not evident vaccinating patients alone Mean cluster size: 88 (based on data for mortality outcomes) Intra‐cluster variance of 2.3% reported in Hayward 2006 |
|
| Risk of bias | ||
| Bias | Authors' judgement | Support for judgement |
| Random sequence generation (selection bias) | Unclear risk | "Hospital sites were stratified by unit policy for vaccination, then randomised for their HCWs to be routinely offered either influenza vaccination and their patients unvaccinated (S0P0), staff vaccinated and patients unvaccinated (SVP0), staff unvaccinated and patients vaccinated (S0PV) and both staff and patients vaccinated (SVPV)" (N.B. the phrase "either influenza vaccination and their patients unvaccinated (S0P0)" is an error and should read: "neither staff nor patients vaccinated (S0P0)") |
| Allocation concealment (selection bias) | Unclear risk | Not stated |
| Blinding (performance bias and detection bias) All outcomes | Unclear risk | Not stated |
| Incomplete outcome data (attrition bias) All outcomes | High risk | Only 654 (61%) of the 1078 HCWs agreed to participate and receive influenza vaccination and 478 (88.8%) of the 538 patients in the "routine vaccination of patients" arms. Serologically proven influenza was ascertained in paired sera in only 225 consenting patients in the "patients not vaccinated" arms |
| Selective reporting (reporting bias) | Low risk | No selective reporting |
| Other bias | High risk |
|
Avg: average C‐RCT: cluster‐randomised controlled trial F: female HCWs: healthcare workers ILI: influenza‐like illness LRTI: lower respiratory tract infection LTC: long‐term care PCR: polymerase chain reaction RCT: randomised controlled trial RT‐PCR: reverse‐transcriptase polymerase chain reaction S0P0: staff and patients not vaccinated S0PV: staff not vaccinated, patients vaccinated SVPV: staff and patients vaccinated SVP0: staff vaccinated and patients not vaccinated WBC: white blood cell
Characteristics of excluded studies [ordered by study ID]
| Study | Reason for exclusion |
|---|---|
| Amodio 2014 | ILI. Data influenza seasons 2005‐2012 in Italian acute care hospital were analysed retrospectively. Hospital discharge records; HCW influenza vaccination, ILI in the general population. 62,343 hospitalised patients, 185 (0.03%) nosocomial ILI. HCW influenza vaccination coverage declined from 13.2% to 3.1% (P value < 0.001) |
| Bellei 2007 | Surveillance study of influenza and rhinovirus infections among HCWs; no vaccination data; no data for elderly people |
| Bertin 2007 | Intranet assessment of HCW vaccination status; no vaccination or outcome data for elderly people |
| Bénet 2012 | Study of "influenza‐like illness" in a 1000 bed acute care hospital in Lyon, France. 12 short‐stay units with 224 beds participated in 2004‐5, 29 with 493 beds in 2005‐6, and 30 with 537 beds in 2006‐7. Nurses visited participating wards daily to search for patients with ILI (defined as temperature ≥ 37.8°C, cough or sore throat, and no use of antipyretics) then a nasal swab was tested for influenza by RT‐PCR, ELISA and culture. Cannot separate outcomes for those > 60 |
| Carusone 2007 | Study of pneumonia and lower respiratory infections in nursing home residents as predictors of hospitalisation and mortality; based on previous RCT; influenza vaccination status of patients; no HCW vaccination data |
| Chicaíza‐Becerra 2008 | Economic evaluation of influenza vaccination of HCWs; no vaccination or outcome data for elderly people |
| Chittaro 2009 | Influenza vaccination campaign for HCWs; no data on elderly people |
| del Villar‐Belzunce 2007 | Programme to increase influenza vaccination among HCWs; no vaccination or outcome data for elderly people |
| Doratotaj 2008 | Programme to increase influenza vaccination among HCWs; no vaccination or outcome data for elderly people |
| Enserink 2011 | Study of 18 long‐term care facilities in the Netherlands in which GPs and nurse practitioners reported ILI cases. They did not use the WHO or CDC ILI definitions but required sudden onset and one symptom (fever or febrile feeling, malaise, headache, sore throat or shortness of breath). These criteria include many respiratory illnesses. They compared patient ILI incidence in facilities with < 15% and ≥ 15% HCW vaccination, December 2008‐April 2009. There were "no institutional influenza outbreaks" but "ILI was frequently diagnosed." This absence of outbreaks implies that their ILI measure did not measure influenza. Nevertheless, they computed an adjusted rate ratio for patient ILI rates = 0.3 (95% CI 0.1 to 1.2). |
| Hood 2009 | Programme to increase influenza vaccination among HCWs; no vaccination or outcome data for elderly people |
| Isaacs 1997 | Data were not presented by HCW vaccine coverage; only 21% of staff were vaccinated; amantadine was a confounder as it was given to patients and not staff; a flow sheet of admissions and discharges was not presented |
| Isahak 2007 | Programme to increase influenza vaccination among elderly people in long‐term care homes; no vaccination data for HCWs |
| Kheok 2008 | Programme to increase influenza vaccination among HCWs; no vaccination or outcome data for elderly people |
| Kimura 2007 | Programme to increase influenza vaccination among HCWs; no vaccination or outcome data for elderly people |
| Landi 2006 | Prospective observational study of influenza vaccination in elderly people; no HCW data |
| Lee 2008 | Programme to increase influenza vaccination among HCWs; no vaccination or outcome data for elderly people |
| Looijmans‐van den Akker 2007 | Survey of effect of national policy on influenza vaccination among HCWs; no vaccination or outcome data for elderly people |
| Mangtani 2004 | Historical cohort study of individuals older than 64 years in the UK General Practice Research Database 1989 to 1999 in England and Wales. No intervention for HCWs |
| Munford 2008 | Campaign to increase influenza vaccination among elderly people and HCWs; no outcome data for elderly people |
| Riphagen‐Dalhuisen 2013 | RCT. Randomised 6 university medical centres in the Netherlands to either receive a programme to increase staff influenza vaccination rates or pursue their usual vaccination policy. The effect on patient morbidity was a secondary goal, limited to the internal medicine and pediatrics wards and patient outcome data were collected retrospectively from charts, laboratory records and discharge letters. Cannot separate outcomes for patients > 60 |
| Sato 2005 | Study of antibody levels in elderly people and HCWs in response to influenza vaccination |
| Shugarman 2006 | Retrospective cross‐sectional study of 344 nursing homes (310 replied) from one chain in the US, with reports of staff and resident vaccination rates and whether the home had an ILI cluster (≥ 3 residents with ILI within 72 hours) |
| Wendelboe 2011 | 75 long‐term care facilities in New Mexico, US, during the influenza seasons of 2006‐7 and 2007‐8. 12% (9 homes) provided no reports in 2006‐7 and 18% (which computes as 13.5 homes!) no reports in 2007‐8. However, data are presented for all 75 homes (15 homes which had an outbreak and 50 which had none). An influenza outbreak was defined as a single patient case. Cases were diagnosed by viral culture or a rapid antigen test The authors noted that: "The ecologic study design limits our ability to control for certain characteristics such as the distribution of residents’ ages and the presence of comorbidities… For example, it is possible that certain facilities cared for residents in poorer health, which likely resulted in those patients who were vaccinated against influenza being less effectively protected from influenza by vaccination." The authors also noted that: "Another potential limitation is that we restricted our surveillance to HCWs with direct patient care. Future surveillance systems may find it helpful to include all healthcare personnel (including clerical, dietary, housekeeping, maintenance, and volunteer personnel)…" There were no data on the total number of patients during the 2 years. The odds of an "outbreak" were paradoxically higher with resident vaccination rates of 91% to 100% compared to 0% to 90% (OR 4.85, 95% CI 1.17 to 20.18) implying more vulnerable patients were more likely to be vaccinated. The authors computed an adjusted OR of 0.76 (0.62 to 0.93) for a reduction in "outbreaks" for a 10% increase in HCW vaccination. However, with only 21 cases and an unknown denominator it is inappropriate to place weight on the odds ratios computed for the effects of HCW vaccination. This is not a RCT and is subject to unmeasured confounders such as a superior LCT culture, which limits the transmission of influenza by hand‐washing, quarantining patients and limiting visitors |
| Yang 2007 | Programme to increase influenza vaccination among HCWs; no vaccination or outcome data for elderly people |
| Yassi 1993 | Data were not presented by HCW vaccine coverage. Vaccine and amantadine were used to control outbreak: amantadine acts as confounder |
| Zimmerman 2009 | Programme to increase influenza vaccination among HCWs; no vaccination or outcome data for elderly people |
CDC: Centers for Disease Control and Prevention CI: confidence interval ELISA: enzyme‐linked immunosorbent assay HCW: healthcare worker ILI: influenza‐like illness OR: odds ratio RCT: randomised controlled trial RT‐PCR: reverse‐transcriptase polymerase chain reaction WHO: World Health Organization
Differences between protocol and review
Since the first version of this review we have restricted the types of outcome measures to reflect specific effects of the vaccine which has led us to exclude measures effect relating influenza‐like illness. We have described the limitations of ILI‐outcomes in Appendix 1.
As a response to the feedback submitted on our review in 2016 we have reinstated the outcome of mortality due to any cause.
We have changed the measures of effect from risk ratios to risk differences because risk differences are easier to interpret than relative effect measures.
Contributions of authors
Responsible for the design of the review: Roger Thomas (RET), Tom Jefferson (TOJ). Responsible for data extraction: all authors. Responsible for the assessment of study quality and outcomes: RET and TJL (Toby Lasserson). Responsible for the first draft: RET. Responsible for the final draft: RET, TOJ, TJL.
Sources of support
Internal sources
No sources of support supplied
External sources
-
National Institute for Health Research (NIHR), UK.
Competitive grant awarded through The Cochrane Collaboration
-
National Health and Medical Research Council (NHMRC), Australia.
Competitive grant to Chris Del Mar and Tom Jefferson, 2009
Declarations of interest
Dr. Roger Thomas: no declarations of interest. Toby Lasserson is an employee of Cochrane and is an editor for the Cochrane Airways Group. He is an associate editor of the journal of 'Research Integrity and Peer Review'. Dr. Jefferson (TJ) was a recipient of a UK National Institute for Health Research grant for a Cochrane review of neuraminidase inhibitors for preventing and treating influenza. In addition TJ receives royalties from his books published by Il Pensiero Scientifico Editore, Rome and Blackwells. TJ is occasionally interviewed by market research companies about phase I or II pharmaceutical products. In 2011‐13, TJ acted as an expert witness in a litigation case related to the antiviral oseltamivir, in two litigitation cases on potential vaccine‐related damage and in a labour case on influenza vaccines in healthcare workers in Canada. He has acted as a consultant for Roche (1997‐99), GSK (2001‐2), Sanofi‐Synthelabo (2003), and IMS Health (2013) and in 2014 was retained as a scientific adviser to a legal team acting on oseltamivir. In 2014‐16 TJ was a member of three advisory boards for Boerhinger Ingelheim and is holder of a Cochrane Methods Innovations Fund grant to develop guidance on the use of regulatory data in Cochrane reviews. TJ is a member of an independent data monitoring committee for a Sanofi Pasteur clinical trial on an influenza vaccine.
New search for studies and content updated (no change to conclusions), comment added to review
References
References to studies included in this review
Carman 2000 {published data only}
- Carman WF, Elder AG, Wallace LA, McAulay K, Walker A, Murray GD, et al. Effects of influenza vaccination of health‐care workers on mortality of elderly people in long‐term care: a randomised controlled trial. Lancet 2000;355(9198):93‐7. [DOI] [PubMed] [Google Scholar]
Hayward 2006 {published data only}
- Hayward AC, Harling R, Wetten S, Johnson AM, Munro S, Smedley J, et al. Effectiveness of an influenza vaccine programme for care home staff to prevent death, morbidity, and health service use among residents: cluster randomised controlled trial. BMJ 2006;333(7581):1241. [DOI: 10.1136/bmj.39010.581354.55] [DOI] [PMC free article] [PubMed] [Google Scholar]
Lemaitre 2009 {published data only}
- Lemaitre M, Meret T, Rothan‐Tondeur M, Belmin J, Lejonc JL, Luquel L, et al. Effect of influenza vaccination of nursing home staff on mortality of residents: a cluster‐randomized trial. Journal of the American Geriatrics Society 2009;57(9):1580‐6. [DOI] [PubMed] [Google Scholar]
Oshitani 2000 {published data only}
- Oshitani H, Saito R, Seki N, Tanabe N, Yamazaki O, Hayashi S, et al. Influenza vaccination levels and influenza‐like illness in long‐term‐care facilities for elderly people in Niigata, Japan, during an influenza A (H3N2) epidemic. Infection Control and Hospital Epidemiology 2000;21(11):728‐30. [DOI] [PubMed] [Google Scholar]
Potter 1997 {published data only}
- Potter J, Stott DJ, Roberts MA, Elder AG, O'Donnell B, Knight PV, et al. Influenza vaccination of health care workers in long‐term‐care hospitals reduces the mortality of elderly patients. Journal of Infectious Diseases 1997;175(1):1‐6. [DOI] [PMC free article] [PubMed] [Google Scholar]
References to studies excluded from this review
Amodio 2014 {published data only}
- Amodio E, Restivo V, Firenze A, Mammina C, Tramuto F, Vitale F. Can influenza vaccination coverage among healthcare workers influence the risk of nosocomial influenza‐like illness in hospitalized patients?. Journal of Hospital Infection 2014;86(3):182‐7. [DOI] [PubMed] [Google Scholar]
Bellei 2007 {published data only}
- Bellei N, Carraro E, Perosa AHS, Benfica D, Granato CFH. Influenza and rhinovirus infections among health‐care workers. Respirology 2007;12:100‐3. [DOI] [PMC free article] [PubMed] [Google Scholar]
Bénet 2012 {published data only}
- Bénet T, Régis C, Voirin N, Robert O, Lina B, Cronenberger S, et al. Influenza vaccination of healthcare workers in acute‐care hospitals: a case‐control study of its effect on hospital‐acquired influenza among patients. BMC Infectious Diseases 2012;12:30. [DOI: ] [DOI] [PMC free article] [PubMed] [Google Scholar]
Bertin 2007 {published data only}
- Bertin M, Scarpelli M, Proctor AW, Sharp J, Robitson E, Donnelly T, et al. Novel use of the intranet to document health care personnel participation in a mandatory influenza vaccination reporting program. American Journal of Infection Control 2007;35:33‐7. [DOI] [PubMed] [Google Scholar]
Carusone 2007 {published data only}
- Carusone SBC, Walter SD, Brazil K, Loeb MB. Pneumonia and lower respiratory infections in nursing home residents: predictors of hospitalization and mortality. Journal of the American Geriatric Society 2007;55:414‐9. [DOI] [PubMed] [Google Scholar]
Chicaíza‐Becerra 2008 {published data only}
- Chicaíza‐Becerra LA, García‐Molina M, Ballesteros M, Gamboa O, Díaz J, Vega R. Economic evaluation of influenza vaccine provided to health personnel who care for hospitalised cancer patients [Evaluacíon económica de la vacuna contra la influenza aplicada al personal de salud que atiende pacientes oncológicos hospitalizados]. Revista Salud Pública 2008;10(5):756‐66. [DOI] [PubMed] [Google Scholar]
Chittaro 2009 {published data only}
- Chittaro M, Turello D, Calligaris L, Farneti F, Faruzzo A, Fiappo E, et al. Impact of vaccinating HCWs on the ward and possible influence of avian flu threat. Infection 2009;37(1):29‐33. [DOI] [PubMed] [Google Scholar]
del Villar‐Belzunce 2007 {published data only}
- Villar‐Belzunce A, Hernández‐Navarrete J, Lapresta‐Moros C, Solano‐Bernad VM, Arribas‐Lorente JL. Influenza vaccine for health personnel [Vacunacíon antigripal en personal sanitario]. Enfermedades Infecciosas y Microbiologica Clinica 2007;25(4):247‐9. [DOI] [PMC free article] [PubMed] [Google Scholar]
Doratotaj 2008 {published data only}
- Doratotaj S, Macknin ML, Worley S. A novel approach to improve influenza vaccination rates among health care professionals: a prospective randomized controlled trial. American Journal of Infection Control 2008;36:301‐3. [DOI] [PubMed] [Google Scholar]
Enserink 2011 {published data only}
- Enserink R, Meijer A, Dijkstra F, Benthem B, Steen JT, Haenen A, et al. Absence of influenza A (H1N1) during seasonal and pandemic seasons in a sentinel nursing home surveillance network in the Netherlands. Journal of the American Geriatric Society 2011;59:2301–5. [DOI] [PubMed] [Google Scholar]
Hood 2009 {published data only}
- Hood J, Smith A. Developing a "Best practice" influenza vaccination program for health care workers ‐ an evidence‐based leadership‐modeled program. AAOHN Journal 2009;57(8):308‐12. [DOI] [PubMed] [Google Scholar]
Isaacs 1997 {published data only}
- Isaacs S, Dickinson C, Brimmer G. Outbreak of influenza A in an Ontario nursing home. Canada Communicable Disease Report 1997;23(14):105‐8. [PubMed] [Google Scholar]
Isahak 2007 {published data only}
- Isahak I, Mahayiddin AA, Ismail R. Effectiveness of influenza vaccination in prevention of influenza‐like illness among inhabitants of old folks homes. Southeast Asian Journal of Tropical Medicine and Public Health 2007;38(5):841‐8. [PubMed] [Google Scholar]
Kheok 2008 {published data only}
- Kheok SW, Chong CY, McCarthy G, Lim WY, Goh KT, Razak L, et al. The efficacy of influenza vaccination in healthcare workers in a tropical setting: a prospective investigator blinded observational study. Annals of the Academy of Medicine of Singapore 2008;37:465‐9. [PubMed] [Google Scholar]
Kimura 2007 {published data only}
- Kimura AC, Nguyen CN, Higa JI, Hurwitz EL, Vugia DJ. The effectiveness of vaccine day and educational interventions on influenza vaccine coverage among health care workers at long‐term care facilities. American Journal of Public Health 2007;97(4):684‐90. [DOI] [PMC free article] [PubMed] [Google Scholar]
Landi 2006 {published data only}
- Landi F, Onder G, Csari M, Russo A, Barillaro C, Bernabei R, on behalf of the SILVERTNET‐HC Study Group. In a prospective observational study, influenza vaccination prevented hospitalization among older home care patients. Journal of Clinical Epidemiology 2006;59:1072‐7. [DOI] [PubMed] [Google Scholar]
Lee 2008 {published data only}
- Lee C‐S, Lee K‐H, Jung M‐H, Lee H‐B. Rate of influenza vaccination and its adverse reactions seen in health care personnel in a single tertiary hospital in Korea. Japanese Journal of Infectious Disease 2008;61:457‐60. [PubMed] [Google Scholar]
Looijmans‐van den Akker 2007 {published data only}
- Looijmans‐van den Akker I, Delden JJM, Hak E. Uptake of influenza vaccination in Dutch nursing home personnel following national recommendations. Journal of the American Geriatric Society 2007;55(9):1486‐7. [DOI] [PubMed] [Google Scholar]
Mangtani 2004 {published data only}
- Mangtani P, Cumberland P, Hodgson CR, Roberts JA, Cutts FT, Hall AJ. A cohort study of the effectiveness of influenza vaccine in older people, performed using the United Kingdom General Practice Research Database. Journal of Infectious Diseases 2004;190:1‐10. [DOI] [PubMed] [Google Scholar]
Munford 2008 {published data only}
- Munford C, Finnigan S. Influenza campaign 2006 and 2007: a residential care success story. Canadian Journal of Infection Control 2008;23(4):222‐5, 227. [PubMed] [Google Scholar]
Riphagen‐Dalhuisen 2013 {published data only}
- Riphagen‐Dalhuisen J, Burgerhof JG, Frijstein G, Geest‐Blankert AD, Danhof‐Pont MB, Jager HJ, et al. Hospital‐based cluster randomised controlled trial to assess effects of a multi‐faceted programme on influenza vaccine coverage among hospital health care workers and nosocomial influenza in the Netherlands, 2009 to 2011. Euro Surveillance 2013;18(26):20512. [DOI] [PubMed] [Google Scholar]
Sato 2005 {published data only}
- Sato M, Saito R, Tanabe N, Nishikawa M, Sasaki A, Gejyo F, et al. Antibody response to influenza vaccination in nursing home residents and healthcare workers during four successive seasons in Niigata, Japan. Infection Control and Hospital Epidemiology 2005;26:859‐66. [DOI] [PubMed] [Google Scholar]
Shugarman 2006 {published data only}
- Shugarman LR, Hales C, Setodji CM, Bardenheier B, Lynn J. The influence of staff and resident immunization rates on influenza‐like outbreaks in nursing homes. Journal of the American Medical Directors Association 2006;7:562‐7. [DOI] [PubMed] [Google Scholar]
Wendelboe 2011 {published data only}
- Wendelboe AM, Avery C, Andrade B, Baumbach J, Landen MG. Importance of employee vaccination against influenza in preventing cases in long‐term care facilities. Infection Control and Hospital Epidemiology 2011;32(10):990‐7. [DOI] [PubMed] [Google Scholar]
Yang 2007 {published data only}
- Yang K‐S, Fong Y‐T, Koh D, Lim M‐K. High coverage of influenza vaccination among healthcare workers can be achieved during heightened awareness of impending threat. Annals of the Academy of Medicine of Singapore 2007;36:384‐7. [PubMed] [Google Scholar]
Yassi 1993 {published data only}
- Yassi A, Mcgill M, Holton C, Nicolle L. Morbidity, cost and role of health care worker transmission in an outbreak in a tertiary care hospital. Canadian Journal of Infectious Diseases 1993;4:42‐56. [DOI] [PMC free article] [PubMed] [Google Scholar]
Zimmerman 2009 {published data only}
- Zimmerman RK, Nowalk MP, Lin CJ, Raymund M, Fox DE, Harper JD, et al. Factorial design for improving influenza vaccination among employees of a large health system. Infection Control and Hospital Epidemiology 2009;30:691‐7. [DOI] [PubMed] [Google Scholar]
Additional references
Ahmed 2014
- Ahmed A, Lindley MC, Allred N, Weinbaum CM, Grohskopf L. Effect of influenza vaccination of healthcare personnel on morbidity and mortality among patients: systematic review and grading of evidence. Clinical Infectious Diseases 2014;58(1):50‐7. [DOI] [PubMed] [Google Scholar]
Anikeeva 2009
- Anikeeva O, Braunack‐Mayer A, Roger W. Requiring influenza vaccination for health care workers. American Journal of Public Health 2009;99(1):24‐9. [DOI] [PMC free article] [PubMed] [Google Scholar]
Atkins 2004
- Atkins D, Best D, Briss PA, Eccles M, Falck‐Ytter Y, Flottorp S, et al. GRADE Working Group. Grading quality of evidence and strength of recommendations. BMJ 2004;328(7454):1490. [DOI] [PMC free article] [PubMed] [Google Scholar]
Ballada 1994
- Ballada D, Biasio LR, Cascio G, D'Alessandro D, Donatelli I, Fara GM, et al. Attitudes and behavior of health care personnel regarding influenza vaccination. European Journal of Epidemiology 1994;10:63‐8. [DOI] [PubMed] [Google Scholar]
Barbara 2012
- Barbara AM, Loeb M, Dolovich L, Brazil K, Russell ML. A comparison of self‐report and health care provider data to assess surveillance definitions of influenza‐like illness in outpatients. Canadian Journal of Public Health 2012;103(1):69‐75. [DOI] [PMC free article] [PubMed] [Google Scholar]
Burls 2006
- Burls A, Jordan R, Barton P, Olowokure B, Wake B, Albon E, et al. Vaccinating healthcare workers against influenza to protect the vulnerable ‐ is it a good use of healthcare resources? A systematic review of the evidence and an economic evaluation. Vaccine 2006;24:4212‐21. [DOI] [PubMed] [Google Scholar]
Campos 2002‐3
- Campos W, Jalaludin BB. Predictors of influenza vaccination amongst Australian nurses. Australian Journal of Advanced Nursing 2002‐2003;20:19‐21. [PubMed] [Google Scholar]
CDC 2003
- Centers for Disease Control and Prevention. Recommendations of the Advisory Committee on Immunization Practices (ACIP). MMWR 2003;RR‐8:1‐34. [PubMed] [Google Scholar]
CDC 2006
- Centers for Disease Control and Prevention. Prevention and control of influenza: Recommendation of the Advisory Committee on Immunization Practices (ACIP). MMWR 2006;55(RR‐10):1‐42. [PubMed] [Google Scholar]
Chadha 2011
- Chadha MS, Broor S, Gunasekaran P, Potdar VA, Krishnan A, Chawla‐Sarkar M, et al. Multisite virological influenza surveillance in India: 2004–2008. Influenza and Other Respiratory Viruses 2011;6(3):196–203. [DOI] [PMC free article] [PubMed] [Google Scholar]
Chami 2011
- Chami K, Gavazzi G, Carrat F, Wazières B, Lejeune B, Piette F, et al. Burden of infections among 44,869 elderly in nursing homes: a cross‐sectional cluster nationwide survey. Journal of Hospital Infection 2011;79:254‐9. [DOI] [PubMed] [Google Scholar]
Chartrand 2012
- Chartrand C, Leeflang MMG, Minion J, Brewer T, Pai M. Accuracy of rapid influenza diagnostic tests: a meta‐analysis. Annals of Internal Medicine 2012;156:500–11. [DOI] [PubMed] [Google Scholar]
Charu 2011
- Charu V, Viboud C, Simonsen L, Sturm‐Ramirez K, Shinjoh M, Chowell G, et al. Influenza‐related mortality trends in Japanese and American seniors: evidence for the indirect mortality benefits of vaccinating schoolchildren. PloS One 6;11:e26282. [DOI: 10.1371/journal.pone.0026282] [DOI] [PMC free article] [PubMed] [Google Scholar]
Chuang 2012
- Chuang J‐H, Huang AS, Huang W‐T, Liu M‐T, Chou J‐H, Chang F‐Y, et al. Nationwide surveillance of influenza during the pandemic (2009–10) and post‐pandemic (2010–11) periods in Taiwan. PloS One 2012;7(4):e36120. [DOI] [PMC free article] [PubMed] [Google Scholar]
Cohen 2010
- Cohen C, Simonsen L, Kang J‐W, Miller M, McAnerney J, Blumberg L. Elevated influenza‐related excess mortality in South African elderly individuals, 1998–2005. Clinical Infectious Diseases 2010;51(12):1362–9. [DOI] [PMC free article] [PubMed] [Google Scholar]
Coles 1992
- Coles FB, Balzano GJ, Morse DL. An outbreak of influenza A (H3N2) in a well‐immunized nursing home population. Journal of the American Geriatrics Society 1992;40:589‐92. [DOI] [PubMed] [Google Scholar]
Dalton 2011
- Dalton CB, Carlson SJ, Butler MT, Fejsa J, Elvidge E, Durrheim DN. Flutracking weekly online community survey of influenza‐like illness Annual Report, 2010. Communicable Diseases Intelligence 2011;35(4):288‐93. [PubMed] [Google Scholar]
Demicheli 2014
- Demicheli V, Jefferson T, Al‐Ansary LA, Ferroni E, Rivetti A, Pietrantonj C. Vaccines for preventing influenza in healthy adults. Cochrane Database of Systematic Reviews 2014, Issue 3. [DOI: 10.1002/14651858.CD001269.pub5] [DOI] [PubMed] [Google Scholar]
Dharmaraj 2009
- Dharmaraj P, Smyth RL. Vaccines for preventing influenza in people with cystic fibrosis. Cochrane Database of Systematic Reviews 2009, Issue 4. [DOI: 10.1002/14651858.CD001753.pub2] [DOI] [PubMed] [Google Scholar]
Doebbeling 1997
- Doebbeling BN, Edmond MB, Davis CS, Woodin JR, Zeitler RR. Influenza vaccination of health care workers: evaluation of factors that are important in acceptance. Preventive Medicine 1997;26:68‐77. [DOI] [PubMed] [Google Scholar]
Elder 1996
- Elder AG, O'Donnell B, McCruden EAB, Symington IS, Carman WF. Incidence and recall of influenza in a cohort of Glasgow healthcare workers during the 1993‐4 epidemic: results of serum testing and questionnaire. BMJ 1996;313(7067):1241‐2. [DOI] [PMC free article] [PubMed] [Google Scholar]
Fune 1999
- Fune L, Shua‐Haim JR, Ross JS, Frank E. Infectious disease among residents of nursing homes. Annals of Long‐term Care 1999;7:410‐7. [Google Scholar]
Goldstein 2012
- Goldstein E, Viboud C, Charu V, Lipsitch M. Improving the estimation of influenza‐related mortality over a seasonal baseline. Epidemiology 2012;23(6):829‐38. [DOI] [PMC free article] [PubMed] [Google Scholar]
GRADEpro GDT 2015 [Computer program]
- McMaster University (developed by Evidence Prime, Inc.). GRADEpro Guideline Development Tool [www.guidelinedevelopment.org]. Hamilton: McMaster University (developed by Evidence Prime, Inc.), 2015.
Gross 1995
- Gross PA, Hermogenes AW, Sacks HS, Lau J, Levandowski RA. The efficacy of influenza vaccine in elderly persons: a meta‐analysis and review of the literature. Annals of Internal Medicine 1995;123(7):518‐27. [DOI] [PubMed] [Google Scholar]
Harper 2004
- Harper SA, Fukuda K, Uyeki TM, Cox NJ, Bridges CB. Prevention and control of influenza: recommendations of the Advisory Committee on Immunization Practices (ACIP). MMWR Recommendations & Reports 2004;53(RR‐6):1‐40. [PubMed] [Google Scholar]
Higgins 2011
- Higgins JPT, Altman DG (editors). Chapter 8: Assessing risk of bias in included studies. In: Higgins JPT, Green S (editors). Cochrane Handbook for Systematic Reviews of Interventions Version 5.0.1 [updated March 2011]. The Cochrane Collaboration, 2011. Available from www.cochrane‐handbook.org.
Jackson 1992
- Jackson MM, Fierer J, Barrett‐Connor E, Fraser D, Klauber MR, Tatch R, et al. Intensive surveillance for infections in a three‐year study of nursing home patients. American Journal of Epidemiology 1992;135:685‐96. [DOI] [PubMed] [Google Scholar]
Jefferson 2009
- Jefferson T. Editorial. Mistaken identity: seasonal influenza versus influenza‐like illness. Clinical Evidence 5 October 2009:1‐4.
Jefferson 2010
- Jefferson T, Pietrantonj C, Al‐Ansary LA, Ferroni E, Thorning S, Thomas R. Vaccines for preventing influenza in the elderly. Cochrane Database of Systematic Reviews 2010, Issue 2. [DOI: 10.1002/14651858.CD004876.pub3] [DOI] [PubMed] [Google Scholar]
Jefferson 2012
- Jefferson T, Rivetti A, Pietrantonj C, Demicheli V, Ferroni E. Vaccines for preventing influenza in healthy children. Cochrane Database of Systematic Reviews 2012, Issue 8. [DOI: 10.1002/14651858.CD004879.pub4] [DOI] [PMC free article] [PubMed] [Google Scholar]
Jordan 2004
- Jordan R, Wake B, Hawker J, Boxall E, Fry‐Smith A, Chen Y‐F, et al. Influenza vaccination of health care workers (HCW) to reduce influenza‐related outcomes in high risk patients: a systematic review of clinical and cost‐effectiveness. West Midlands Health Technology Assessment Collaboration (WMHTAC). Vol. 88, WMHTAC, 2004. [Google Scholar]
Kuster 2011
- Kuster SP, Shah PS, Coleman BL, Lam P‐P, Tong A, Wormsbecker A, et al. Incidence of influenza in healthy adults and healthcare workers: a systematic review and meta‐analysis. PloS One 2011;6(10):e26239. [DOI: ] [DOI] [PMC free article] [PubMed] [Google Scholar]
Lau 2012
- Lau EHY, Cheng CKY, Ip DKM, Cowling BJ. Situational awareness of influenza activity based on multiple streams of surveillance data using multivariate dynamic linear model. PLoS One 2012;7(5):e38346. [DOI] [PMC free article] [PubMed] [Google Scholar]
Lee 2011
- Lee VJ, Chen MI, Yap J, Ong J, Lim L‐M, Lin RTP, et al. Comparability of different methods for estimating influenza infection rates over a single epidemic wave. American Journal of Epidemiology 2011;174(4):468–78. [DOI] [PMC free article] [PubMed] [Google Scholar]
Lefebvre 2011
- Lefebvre C, Manheimer E, Glanville J. Chapter 6: Searching for studies. In: Higgins JPT, Green S (editors). Cochrane Handbook for Systematic Reviews of Interventions Version 5.1.0 [updated March 2011]. The Cochrane Collaboration, 2011. Available from www.cochrane‐handbook.org.
Ludwig‐Beymer 2002
- Ludwig‐Beymer P, Gerc SC. An influenza prevention campaign: the employee perspective. Journal of Nursing Care Quality 2002;16:1‐12. [DOI] [PubMed] [Google Scholar]
Martinello 2003
- Martinello RA, Jones L, Topal JE. Correlation between healthcare workers' knowledge of influenza vaccine and vaccine receipt. Infection Control and Hospital Epidemiology 2003;24:845‐7. [DOI] [PubMed] [Google Scholar]
McGeer 1991
- McGeer A, Campbell B, Emori TG, Hierholzer WJ, Jackson MM, Nicolle LE, et al. Definitions of infection for surveillance in long‐term care facilities. American Journal of Infection Control 1991;19(1):1‐7. [DOI] [PubMed] [Google Scholar]
Muder 1998
- Muder RR. Pneumonia in residents of long‐term care facilities: epidemiology, etiology, management, and prevention. American Journal of Medicine 1998;105:319‐30. [DOI] [PubMed] [Google Scholar]
NFID 2004
- National Foundation for Infectious Diseases. Improving influenza vaccination rates in health care workers. www.nfid.org//pdf/publications/hcwmonograph.pdf. Bethesda, Maryland, USA: National Foundation for Infectious Diseases, 2004 (accessed 9 July 2013).
Nicolle 1984
- Nicolle LE, McIntyre M, Zacharia H, MacDonell JA. Twelve‐month surveillance of infections in institutionalized elderly men. Journal of the American Geriatrics Society 1984;32:513‐9. [DOI] [PubMed] [Google Scholar]
Ortiz 2011
- Ortiz JR, Zhou H, Shay DK, Neuzil KM, Fowlkes AL, Goss CH. Monitoring influenza activity in the United States: a comparison of traditional surveillance systems with Google Flu Trends. PLoS One 2011;4:e18687. [DOI] [PMC free article] [PubMed] [Google Scholar]
Pin 2012
- Pin SP, Golmard JL, Cotto E, Rothan‐Tondeur M, Chami K, Piette F. Excess winter mortality in France: influence of temperature, influenza like illness, and residential care status. Journal of the American Medical Directors Association 2012;309:309.e1‐7. [DOI] [PubMed] [Google Scholar]
Poole 2010
- Poole PJ, Chacko E, Wood‐Baker RWB, Cates CJ. Influenza vaccine for patients with chronic obstructive pulmonary disease. Cochrane Database of Systematic Reviews 2010, Issue 8. [DOI: 10.1002/14651858.CD002733.pub2] [DOI] [Google Scholar]
Quereshi 2004
- Quereshi AM, Hughes NJM, Murphy E, Primrose WR. Factors influencing uptake of influenza vaccine among hospital‐based health care workers. Occupational Medicine 2004;54:197‐201. [DOI] [PubMed] [Google Scholar]
Reichert 2004
- Reichert TA, Simonsen l, Sharma A, Pardo SA, Fedson DS, Miller MA. Influenza and the winter increase in mortality in the United States, 1959–1999. American Journal of Epidemiology 2004;160(5):492‐502. [DOI] [PubMed] [Google Scholar]
RevMan 2014 [Computer program]
- The Nordic Cochrane Centre, The Cochrane Collaboration. Review Manager (RevMan). Version 5.3. Copenhagen: The Nordic Cochrane Centre, The Cochrane Collaboration, 2014.
Rothan‐Tondeur 2010
- Rothan‐Tondeur M, Filiali‐Zegzouti Y, Golmard J‐L, Wazieres B, Piette F, Carrat F, et al. Randomised active programs on healthcare workers' flu vaccination in geriatric health care settings in France: the VESTA study. Journal of Nutrition, Health & Aging 2011;15(2):126‐32. [DOI] [PubMed] [Google Scholar]
Ruel 2002
- Ruel N, Odelin MF, Jolly J, Momplot C, Diana MC, Bourlet T, et al. Outbreaks due to respiratory syncytial virus and influenza virus A/H3N in institutionalized aged. Role of immunological status to influenza vaccine and possible implication of caregivers in the transmission [Infections groupées à virus respiratoire syncytial et à influenza virus A/H3N2 chez des sujets âgés en institution. Influence du status vaccinal anti‐grippal et implication possible des soignants dans la transmission]. Presse Medicale 2002;31(8):349‐55. [PubMed] [Google Scholar]
Russell 2003a
- Russell ML, Henderson EA. The measurement of influenza vaccine coverage among health care workers. American Journal of Infection Control 2003;31:457‐61. [DOI] [PubMed] [Google Scholar]
Russell 2003b
- Russell ML, Thurston WE, Henderson EA. Theory and models for planning and evaluating institutional influenza prevention and control programs. American Journal of Infection Control 2003;31:336‐41. [DOI] [PubMed] [Google Scholar]
Schanzer 2007
- Schanzer DL, Tam TWS, Langley JM, Winchester BT. Influenza attributable deaths, Canada 1990–1999. Epidemiology and Infection 2007;135:1109‐16. [DOI] [PMC free article] [PubMed] [Google Scholar]
SIGN 2009
- Scottish Intercollegiate Guideline Network. SIGN. http://www.sign.ac.uk/methodology/filters.html 2009 (accessed 2 October 2009).
Simonsen 2006
- Simonsen L, Reichert TA, Viboud C, Blackwelder WC, Taylor RJ, Miller MA. Impact of influenza vaccination on seasonal mortality in the US elderly population. Annals of Internal Medicine 2006;165:265‐72. [DOI] [PubMed] [Google Scholar]
Stevenson 2001
- Stevenson GG, McArthur MA, Naus M, Abraham E, McGeer AJ. Prevention of influenza and pneumococcal pneumonia in Canadian long‐term care facilities: how are we doing?. Canadian Medical Association Journal 2001;164:1413‐9. [PMC free article] [PubMed] [Google Scholar]
Sydnor 2014
- Sydnor E, Perl TM. Healthcare providers as sources of vaccine‐preventable diseases. Vaccine 2014;38(32):4814‐22. [DOI] [PubMed] [Google Scholar]
Thiberville 2012
- Thiberville SD, Ninove L, Vu V, Botelho‐Nevers E, Gazin C, Thirion L, et al. The viral etiology of an influenza‐like illness during the 2009 pandemic. Journal of Medical Virology 2012;84:1071–9. [DOI] [PMC free article] [PubMed] [Google Scholar]
Thomas 2014a
- Thomas RE. Is influenza‐like illness a useful concept and an appropriate test of influenza vaccine effectiveness?. Vaccine 2014;32:2143‐9. [DOI] [PMC free article] [PubMed] [Google Scholar]
Thomas 2014b
- Thomas RE. Are influenza‐associated morbidity and mortality estimates for those 65 in statistical databases accurate, and an appropriate test of influenza vaccine effectiveness?. Vaccine 2014;32:6884‐901. [DOI] [PubMed] [Google Scholar]
van den Dool 2008
- Dool C, Bonten MJM, Hak E, Heijne CM, Wallinga J. The effects of influenza vaccination of health care workers in nursing homes: insights from a mathematical model. PLoS Medicine 2008;5(10):1453‐60. [DOI] [PMC free article] [PubMed] [Google Scholar]
Vila‐Córcoles 2007
- Vila‐Córcoles A, Rodriguez T, Diego C, Ochoa O, Valdivieso A, Salsench E, et al. Effect of influenza vaccine status on winter mortality in Spanish community‐dwelling elderly people during 2002‐2005 influenza periods. Vaccine 2007;25:6699‐707. [DOI] [PubMed] [Google Scholar]
Vu 2002
- Vu T, Farish S, Jenkins M, Kelly H. A meta‐analysis of effectiveness of influenza vaccine in persons aged 65 years and over living in the community. Vaccine 2002;20(13‐4):1831‐6. [DOI] [PubMed] [Google Scholar]
Weingarten 1989
- Weingarten S, Riedinger M, Bolton LB, Miles P, Ault M. Barriers to influenza vaccination acceptance: a survey of physicians and nurses. American Journal of Infection Control 1989;17:202‐7. [DOI] [PubMed] [Google Scholar]
Wells 2005
- Wells GA, Shea B, O'Connell D, Peterson J, Welch V, Losos M, et al. The Newcastle‐Ottawa Scale (NOS) for assessing the quality of non‐randomised studies in meta‐analyses. http://www.ohri.ca/programs/clinical_epidemiology/oxford.asp 2005 (accessed 9 July 2013).
Wikipedia 2009
- Wikipedia. Barthel scale. http://en.wikipedia.org/wiki/Barthel_scale 2009 (accessed 24 December 2009).
References to other published versions of this review
Thomas 2005
- Thomas RE, Jefferson T, Demicheli V. Influenza vaccination for healthcare workers who work with the elderly. Cochrane Database of Systematic Reviews 2005, Issue 2. [DOI: 10.1002/14651858.CD005187] [DOI] [PubMed] [Google Scholar]
Thomas 2006
- Thomas RE, Jefferson T, Demicheli V, Rivetti D. Influenza vaccination for healthcare workers who work with the elderly. Cochrane Database of Systematic Reviews 2006, Issue 3. [DOI: 10.1002/14651858.CD005187.pub2] [DOI] [PubMed] [Google Scholar]
Thomas 2010
- Thomas RE, Jefferson T, Lasserson TJ. Influenza vaccination for healthcare workers who work with the elderly. Cochrane Database of Systematic Reviews 2010, Issue 2. [DOI: 10.1002/14651858.CD005187.pub3] [DOI] [PubMed] [Google Scholar]
Thomas 2013
- Thomas RE, Jefferson T, Lasserson TJ. Influenza vaccination for healthcare workers who care for people aged 60 or older living in long‐term care institutions. Cochrane Database of Systematic Reviews 2013, Issue 7. [DOI: 10.1002/14651858.CD005187.pub4] [DOI] [PubMed] [Google Scholar]