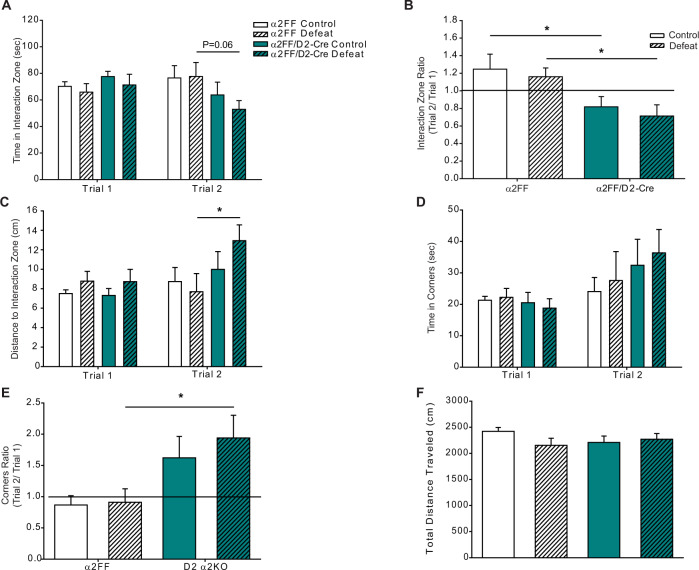
Fig. 5. Conditional knockdown of α2-GABAARs in D2+ cells enhances susceptibility to stress-induced social avoidance.
A Mice lacking α2-GABAARs in D2+ cells display a trend to less time in the interaction zone in Trial 2 (two-way ANOVA, the main effect of genotype F1,45 = 4.204, p < 0.05; the main effect of defeat F1,45 = 0.288, p > 0.05, genotype × defeat interaction F1,45 = 0.423, p > 0.05; defeat α2FF/D2-Cre vs. defeat α2FF, p = 0.06) but not in Trial 1 (two-way ANOVA, the main effect of defeat F1,44 = 0.721, p > 0.05, the main effect of genotype F1,44 = 1.04, p > 0.05, genotype × defeat interaction F1,44 = 0.0256, p > 0.05). B Interaction zone ratios are decreased in mice lacking α2-GABAARs in D2+ cells (two-way ANOVA, the main effect of genotype F1,44 = 11.187, p < 0.01, main effect of defeat F1,44 = 0.527, p > 0.05, interaction defeat × genotype F1,44 = 0.00473, p > 0.05). Line denotes the ratio of 1, animals with interaction zone ratios ≥ 1 are considered sociable. C Following 5 days of defeat stress, α2FF/D2-Cre average a greater distance from the interaction zone in Trial 2 (two-way ANOVA, main effect of defeat F1,45 = 0.114, p > 0.05, main effect of genotype F1,45 = 4.129, p < 0.05, defeat × genotype interaction F1,45 = 2.220, p > 0.05) but not in Trial 1 (two-way ANOVA, main effect of defeat F1,45 = 0.623, p > 0.05, main effect of genotype F1,45 = 0.463, p > 0.05, defeat × genotype interaction F1,45 = 0.111, p > 0.05). D Time spent in corners does not differ between animals in either trial (Trial 1: two-way ANOVA, the main effect of defeat F1,42 = 0.0439, p > 0.05, main effect of genotype F1,42 = 1.565, p > 0.05, defeat × genotype interaction F1,42 = 0.0744, p > 0.05; Trial 2: two-way ANOVA, main effect of defeat F1,44 = 0.06, p > 0.05, main effect of genotype F1,44 = 1.152, p > 0.05, defeat × genotype interaction F1,44 = 0.712, p > 0.05). E Corner ratios are increased in defeated α2FF/D2-Cre mice (two-way ANOVA, main effect of genotype F1,43 = 9.694, p < 0.01, main effect of defeat F1,43 = 0.394, p > 0.05, defeat × genotype interaction F1,43 = 0.229, p > 0.05). Line denotes the ratio of 1, animals with corner ratios ≤ 1 are considered sociable. F No differences in total distance traveled were detected in the SIT (two-way ANOVA, main effect of defeat F1,44 = 0.996, p > 0.05, main effect of genotype F1,44 = 0.220, p > 0.05, defeat × genotype interaction F1,44 = 2.526, p > 0.05). Control α2FF n = 12, defeat α2FF n = 12, control α2FF/D2-Cre n = 12, defeat α2FF/D2-Cre n = 13. *p < 0.05.

