Abstract
Psoriatic arthritis (PsA) is a chronic inflammatory disease associated with T cell dysregulation. The lymphocyte‐activation gene (LAG)‐3 is one of the regulatory receptors expressed on T cells in a soluble form. LAG‐3 expression on T cells was analyzed in vitro in PsA patients with minimal disease activity (MDA), active disease (non‐MDA) and healthy controls. In cultured in‐vitro peripheral blood mononuclear cells (PBMCs), LAG‐3 expression on CD4+ T cells was similar in both MDA PsA patients (7.5 ± 0.9) (n = 14) and healthy controls (7.8 ± 0.6) (n = 15), but significantly lower in non‐MDA PsA patients (3.1 ± 0.3) (n = 13) (p < 0.0001). An inverse correlation between PsA clinical disease activity and %CD4+LAG‐3+ T cells in vitro was observed (composite psoriatic disease activity index r = −0.47, p < 0.02 and psoriatic arthritis disease activity score, r = −0.51, p < 0.008). In‐vitro co‐culture of CD4+ T cells with anti‐tumor necrosis factor (TNF) or anti‐interleukin (IL)‐17A had no effect on LAG‐3+ expression in MDA PsA patients and healthy controls. In non‐MDA patients, anti‐TNF, but not anti‐IL‐17A, restored the %CD4+LAG‐3+ T cells (7.9 ± 0.9 and 3.2 ± 0.4, respectively) (p < 0.0004). Lower soluble LAG‐3 levels were found in sera of naive to biological PsA patients (n = 39) compared to healthy controls (n = 35) (p < 0.03). Impaired LAG‐3 on CD4+ T cells may reflect active PsA disease state. Anti‐TNFs have potency to up‐regulate the CD4+LAG‐3+ T cells in vitro.
Keywords: arthritis (including rheumatoid arthritis), inhibitory/activating receptors, T cells
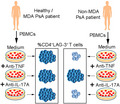
A simplified demonstration of difference in the percentages of the in vitro cultured CD4+LAG‐3+ T cells derived from PBMCs of PsA patients classified MDA and healthy controls as compared to non‐MDA PsA patients. This figure also demonstrates the effect of in vitro supplementation of TNF and IL‐17A inhibitors on the in vitro cultured CD4+LAG‐3+ T cells population
INTRODUCTION
Psoriatic arthritis (PsA) is a chronic immune‐mediated inflammatory disease that affects peripheral joints, entheses and the axial skeleton, together with skin and nail. PsA activity ranges between mild monoarticular to severe polyarticular deforming disease. Accordingly, patients can be classified into a state of minimal disease activity (MDA) or active disease (non‐MDA) [1]. Activated T cells mediate the inflammatory condition by producing inflammatory cytokines, such as tumor necrosis factor (TNF)‐α, interleukin (IL)‐17 and IL‐23, which have a dominant pathogenic role in psoriatic plaques and inflamed joints [2]. The major T cell subsets playing a significant role in inflammatory diseases are pathogenic Th17 and regulatory T (Treg) cells. Tregs are a subset of T cells critical for immune homeostasis, preventing the onset of autoimmunity. Tregs suppress autoreactive T cells [3] and the lack or dysfunction of Tregs might lead to a breakdown of immunological tolerance to self‐antigens, resulting in autoimmune/inflammatory diseases [3, 4]. Indeed, Tregs isolated from PsA patients showed defects in suppressing effector T cells [5].
A number of Treg subsets have been identified, with forkhead box protein 3 (FoxP3+) Tregs being the most studied subset [6, 7]. FoxP3 is a transcription factor and a member of the forkhead or winged helix family that was proposed as a master switch for Treg development and function [8]. Lymphocyte‐activation gene (LAG)‐3 (also known as CD223) is an additional immune inhibitory molecule expressed on activated T cells, contributing to Treg suppression activity through binding to major histocompatibility complex (MHC) class II proteins and inhibition of inflammatory T cell responses [9, 10, 11, 12, 13].
PsA therapy is directed to control the inflammatory process and includes anti‐cytokine biologicals, such as anti‐TNF and anti‐IL‐17A agents [14, 15, 16]. Anti‐IL‐6 receptor (R) antibody, an effective biological in rheumatoid arthritis (RA) therapy [17], has shown disappointing results in PsA [18]. There are only a few reports demonstrating changes in T cell subsets during biological treatment, mainly in RA patients treated with anti‐TNF agents [19, 20, 21, 22]. Some of these studies reported Treg up‐regulation [19, 20, 21], while others reported no impact of biologicals on Treg fraction [23]. The mode of action of biologicals on T cells possessing CD4+LAG‐3+ derived from PsA patients is unknown.
The aim of this study was to assess the expression level of CD4+LAG‐3+ T cells in vitro in peripheral blood mononuclear cells (PBMCs) of PsA patients classified upon disease activity as MDA or non‐MDA in comparison with healthy controls, and to assess soluble LAG‐3 levels in PsA patients’ sera compared to healthy controls. The secondary aim was to evaluate the immunomodulatory effects of biologics used in PsA treatment on CD4+LAG‐3+ T cells in vitro. Changes in LAG‐3 expression were compared to changes in the activation marker CD25 on CD4 T cells.
MATERIALS AND METHODS
Patient data
Adult PsA patients (18 years) who fulfilled the classification criteria for PsA (CASPAR) [24] were eligible to participate and were consecutively enrolled into the study. The study was conducted according to the Declaration of Helsinki guidelines and approved by the institute’s review board (Tel‐Aviv Sourasky Medical Center, Tel‐Aviv, Israel; 0182‐18‐TLV). All participants signed an informed consent upon the enrollment into the study, underwent a clinical disease activity evaluation in cases of PsA and donated a single blood sample that was used for the described experiments. A total of 58 PsA patients and 40 healthy controls participated in the study. A flow‐chart of PsA patients and healthy controls included in the study and their distribution in stages I and II experiments is shown in Figure 1.
FIGURE 1.
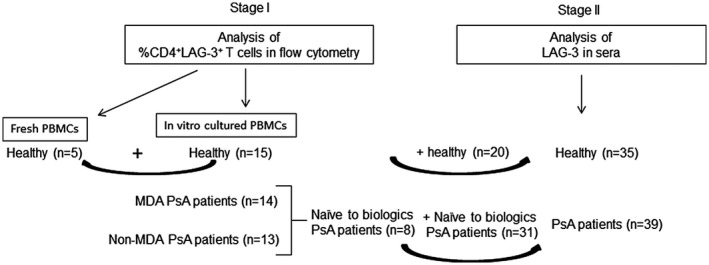
Flow‐chart of psoriatic arthritis (PsA) patients and healthy controls participating in the study
At stage I, LAG‐3 cell surface expression on peripheral T cells was evaluated by flow cytometry in a total of 27 PsA patients and 15 healthy controls. For this evaluation, patients were clinically assessed as detailed in the clinical assessment section. The laboratory tests for PsA disease activity evaluation included the erythrocyte sedimentation rate (ESR) with a normal cut‐off value of <13 mm/h for males and <20 mm/h for females and the C reactive protein (CRP) level with a normal cut‐off value <5 mg/l.
Clinical assessment
The study patients underwent a complete medical history and physical examination by experienced rheumatologists (A.P., V.F., D.L. and O.E.). The physical examination included evaluation of tender and swollen joint counts according to the 66/68 articular index, counts of the number of fingers and toes affected by dactylitis and assessment of enthesitis according to the Leeds and Spondyloarthritis Research Consortium of Canada (SPARCC) enthesitis index. Patients’ global assessment of disease activity, patients’ pain assessment and the evaluator’s global assessment of disease activity were determined using visual analogue scales (VAS, range = 0–100 mm). The psoriasis skin disease activity was evaluated by body surface area (BSA) and the psoriasis area severity index (PASI) [25]. Each patient completed the health assessment questionnaire (HAQ) [26]. Disease activity measures included: minimal disease activity (MDA) in PsA, disease activity in psoriatic arthritis (DAPSA), composite psoriatic disease activity index (CPDAI) and the psoriatic arthritis disease activity score (PASDAS). Demographic and clinical characteristics of patients and controls are summarized in Table 1.
TABLE 1.
Clinical characteristics of the MDA, non‐MDA PsA patients and healthy controls enrolled for the analysis of T cells in flow cytometry
| Non‐MDA (n = 13) | MDA (n = 14) | Healthy (n = 20) | |
|---|---|---|---|
| Female/male | 6/7 | 7/7 | 15/5 |
| Age, mean ± SD years | 47.7 ± 2.5 | 47.5 ± 3.8 | 42.0 ± 2.6 |
| CRP, mean ± SD, mg/l | 11.9 ± 3.7 | 2.5 ± 1.0 | – |
| ESR, mean ± SD mm/hour | 21.1 ± 5.4 | 14.2 ± 2.4 | – |
| TJC | 6.6 ± 1.9 | 2.0 ± 1.1 | – |
| SJC | 3.4 ± 1.5 | 0.14 ± 0.1 | – |
| PASI | 0.5 ± 0.2 | 0.6 ± 0.3 | – |
| CPDAI | 8.9 ± 1.0 | 3.8 ± 0.9 | – |
| DAPSA | 22 .4 ± 3.5 | 4.6 ± 1.2 | – |
| PASDAS | 4.0 ± 0.5 | 1.0 ± 0.3 | – |
| Naive to treatment | 4/13 | 6/14 | – |
| Current synthetic DMARDs | 3/16 | 2/14 | – |
| Current biological therapy | 6/13 | 8/14 | – |
Abbreviations: CPDAI, composite psoriatic disease activity index; CRP, C reactive protein; DAPSA, disease activity index for psoriatic arthritis; DMARDs, disease‐modifying anti‐rheumatic drugs; ESR, erythrocyte sedimentation rate; MDA, minimal disease activity; PASDAS, psoriatic arthritis disease activity score; PASI, psoriasis area severity index (range = 0–72); PGA, patients’ global assessment of disease activity (range = 0–100 mm); SD, standard deviation; SJC, swollen joint count (range = 0–66); TJC, tender joint count (range = 0–68).
PBMC isolation
Peripheral whole‐blood samples were collected in ethylenediamine tetraacetic acid (EDTA) tubes on the same day that the patients arrived for the clinical evaluation. PBMCs were isolated by density gradient centrifugation with lymphoprep (Axis‐Shield, Oslo, Norway) and cells were cultured in vitro as described below. Freshly PBMCs from healthy donors (n = 5) were evaluated on the same day that the blood samples were drawn for %CD4+LAG‐3+ T cells by the method described below.
In‐vitro cell culture
PBMCs were cultured at a density of 1.5x10⁶ cells/ml in a 48‐well plate in RPMI‐1640 medium containing 10% heat‐inactivated fetal bovine serum supplemented with penicillin (100 U/ml), streptomycin (100 μg/ml), 2 mmol/l L‐glutamine and 50 μM 2β‐mercaptoethanol. The cells were incubated for 5 days at 37°C with 5% CO2 and with the following experimental biologicals: TNF blocker [adalimumab (ADA); infliximab (IFX); Enbrel (ETN)], IL‐17A blocker [ixekizumab (IXE)] and IL‐6R blocker [tocilizumab (TCZ)] at a concentration of 10 μg/ml (doses reflect the biological agent concentrations in human circulation) or medium alone as control.
CD4+LAG‐3+ and CD4+CD25+ T cell analysis
After 5 incubation days, cells were collected and stained with the following monoclonal antibodies: anti‐CD4‐allophycocyanin (APC)‐eFluor 780 (eBioscience, San Diego, California, USA; 47‐0049‐42), anti‐LAG‐3‐peridinin chlorophyl (PerCP)‐eFluor 710 (eBioscience; 46‐2239‐42) and CD25 phycoerythrin (PE) (eBioscience; 12‐0259‐42) for 30 min at room temperature. The cells were then analyzed using fluorescence activated cell sorter (FACS) Canto II flow cytometer (BD Biosciences). A total of 60 000 events were collected from each sample. Analysis by FlowJo analysis software identified lymphocytes on the basis of forward‐ and side‐scatter after gating for %CD4+LAG‐3+ and %CD4+CD25+ T cells was performed. After culture, cells viability assessment was performed using propidium iodide (PI). The gated lymphocytes were confirmed as viable cells (<95% PI‐negative cells; data not shown).
Soluble LAG‐3 measurement in sera using enzyme‐linked immunosorbent assay (ELISA)
The second stage aimed to detect the difference in soluble LAG‐3 levels in sera. As the stage I analysis revealed that biologicals could affect surface LAG‐3 levels on T cells, the latter was analyzed in blood samples collected from naive to biological PsA patients (n = 39) and healthy controls (n = 35). In this assessment, peripheral blood was collected from PsA patients (among whom eight patients naive to biological therapy were also assessed for surface LAG‐3 or CD25 on CD4+ T cells) and healthy controls (among whom 15 controls who were also assessed for surface LAG‐3 or CD25 on CD4+ T cells). Demographic and clinical characteristics of PsA patients and controls included in this assessment are shown in Table 2. Blood samples were centrifuged at 1000 g for 10 min before separating serum and then stored frozen at −20°C. Soluble LAG‐3 serum concentrations were determined using the Duoset ELISA human LAG‐3 ELISA kit (DY2319B; R&D Systems, Minneapolis, Minnesota, USA), following the manufacturer’s instructions. Assay was read using ELISA plate reader BioTek 800TS microplate reader (BioTek, Winooski, Vermont, USA) using GEN5 version 2.05 software. Optical density units (OD) for comparison were determined at a wavelength of 450 nm and the reference wavelength at 630 nm.
TABLE 2.
Clinical characteristics of the PsA patients and healthy controls enrolled for analysis of soluble sera LAG‐3
| PsA (n = 39) | Healthy (n = 35) | |
|---|---|---|
| Female/male | 20/19 | 23/12 |
| Age, mean ± SD years | 49.0 ± 2.1 | 40.7 ± 1.9 |
| SJC | 3.0 ± 0.7 | – |
| TJC | 5.1 ± 0.9 | – |
| PASI | 3.4 ± 1.0 | – |
| Naive to treatment | 31/39 | – |
| Current synthetic DMARDs | 8/39 | – |
Abbreviations: DMARDS, disease‐modifying anti‐rheumatic drugs; PASI, psoriasis area severity index; SD, standard deviation; SJC, swollen joint count; TJC, tender joint count.
Statistical analysis
Data are presented as mean ± standard error (SE). Non‐parametric analyses were performed with the Mann–Whitney U‐test for comparison of independent data between the two groups. The Kruskal–Wallis test was used to analyze more than two independent groups. Dunn’s multiple comparison test was used if the Kruskal–Wallis p value was < 0.05. The degree of correlation between variables was determined with Pearson’s test. Statistical significance was determined when the p value was < 0.05, and all analyses were performed with GraphPad Prism software version 8 (San Diego, California, USA).
RESULTS
CD4+LAG‐3+ T cell levels were negligible in fresh PBMCs but visible after in‐vitro culture
PBMCs from healthy donors (n = 5) were analyzed by FACS for CD4 and LAG‐3 expression at baseline and after culture for 5 days in vitro. As shown in Figure 2a, the mean expression level of the %CD4+LAG‐3+ T cell population at baseline was 0.08 ± 0.03. After 5 incubation days, this population was expanded and reached a mean level of 7.4 ± 0.8, p < 0.01 (Figure 2b,c).
FIGURE 2.
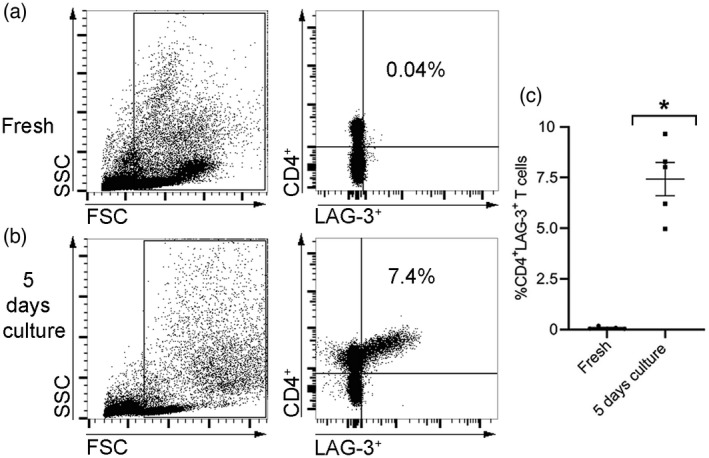
The effect of in‐vitro incubation on the %CD4+ lymphocyte‐activation gene (LAG)‐3+ T cell population. Peripheral blood mononuclear cells (PBMCs) of healthy controls (n = 5) were analyzed by flow cytometry when fresh after undergoing 5 days in culture in vitro to determine the percentage of %CD4+LAG‐3+ T cells. (a,b) Representative flow cytometric dot‐plot of a healthy donor’s PBMCs’ gating strategy presented as a side‐scatter area (SSC) and a forward‐scatter area (FSC) (left panels). Evaluation of %CD4+LAG‐3+ T cells (right panels) is shown. The percentage of positive cells is indicated in the upper right quadrant. (c) Graph indicating the average percentage of %CD4+LAG‐3+ T cells for tested donors (n = 5). Data are shown with standard error of the mean (SEM) values; *p < 0.01 (Mann–Whitney U‐test)
CD4+LAG‐3+ T cell population distribution between healthy donors and PsA patients classified as MDA, non‐MDA and biological effect on this population
Following the finding of negligible percentage of CD4+LAG‐3+ T cells in the fresh isolated PBMCs, we aimed to determine the percentage of CD4+LAG‐3+ T cells in PBMCs derived from healthy donors and PsA patients classified as MDA and non‐MDA in vitro after 5 days in culture. As presented in Figure 3a (left panel) and Figure 3b, there was no significant difference in the mean percentage of CD4+LAG‐3+ T cells between healthy donors (n = 15) and the MDA PsA patients (n = 14; 7.8 ± 0.6 and 7.5 ± 0.9, respectively). However, the percentage of CD4+LAG‐3+ T cells (3.1 ± 0.3) in the non‐MDA PsA patients (n = 13) was significantly lower compared to the healthy controls and the MDA PsA patients (p < 0.0001). We then determined whether biologicals used in PsA management could affect the latter cell population and cultured MDA‐ and non‐MDA PsA patient‐derived PBMCs in vitro for 5 days with the biological agents anti‐TNF and anti‐IL‐17A. We also included cells derived from healthy donors incubated in vitro with those biologicals in these experiments.
FIGURE 3.
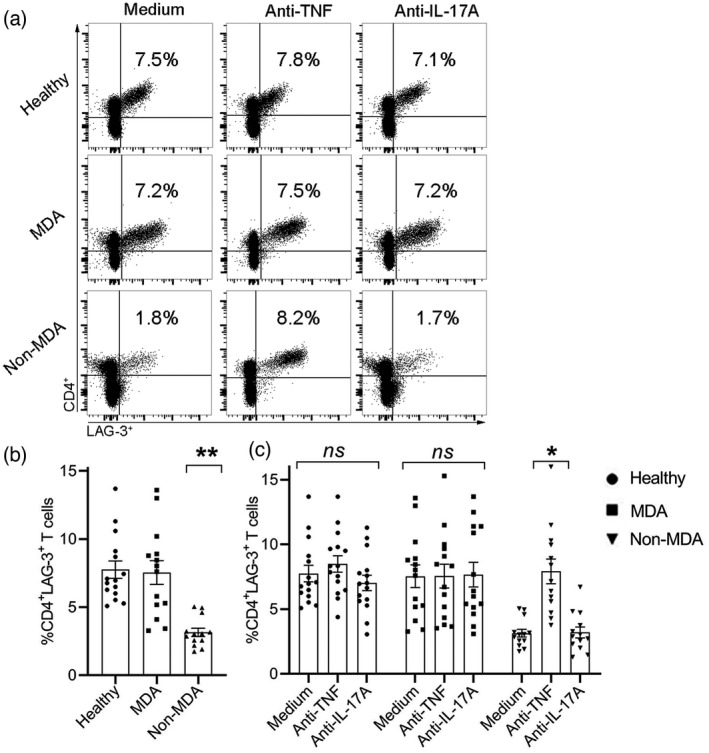
Difference in %CD4+ lymphocyte‐activation gene (LAG)‐3+ T cells after in‐vitro culture of peripheral blood mononuclear cells (PBMCs) derived from healthy donors, minimal disease activity (MDA) and non‐MDA psoriatic arthritis (PsA) patients, and the biological effects on %CD4+LAG‐3+ T cells. (a) Representative dot‐plot of CD4 and LAG‐3 staining of PBMCs from healthy donors, MDA and non‐MDA PsA patients after 5 incubation days with medium, anti‐tumor necrosis factor (TNF) or anti‐interleukin (IL)‐17A. Positive staining is presented in the right upper quadrant of each plot with the percentage indicated. (b) Box‐plot graphs represent the mean percentage of CD4+LAG‐3+ T cells after 5 incubation days in medium alone. (c) Box‐plot graphs represent the mean ± standard error (SE) percentage of CD4+LAG‐3+ T cells after 5 incubation days with medium alone, adalimumab (ADA) or ixekizumab (IXE). Analysis of samples from healthy donors (n = 15), MDA PsA patients (n = 14) and non‐MDA PsA patients (n = 13). Statistical analysis of the graphs in (b) and (c) was performed with the Kruskal–Wallis test followed with Dunn’s post‐hoc test. *p < 0.0003, **p < 0.0001; NS = not statistically significant
Figure 3a,c shows that the mean percentage of CD4+LAG‐3+ T cells in healthy controls PBMCs following incubation with medium alone was 7.7 ± 0.6 (Figure 3b). Supplementation of the TNF or IL‐17A blockers, ADA and IXE, respectively, to the culture of the healthy donors PBMCs at doses that reflect therapeutic levels did not significantly change the percentage of CD4+LAG‐3+ T cells (8.5 ± 0.6 and 7.0 ± 0.6, respectively) (Figure 3a, upper panel, and Figure 3c). Similarly, no significant differences in the percentage of CD4+LAG‐3+ T cells in MDA PsA patients PBMCs were observed following in‐vitro incubation with biologicals (7.6 ± 0.9 and 7.7 ± 1.0, respectively) (Figure 3a, middle panel, and Figure 3c). In contrast, supplementation of ADA significantly up‐regulated the percentage of CD4+LAG‐3+ T cells (7.9 ± 0.9, p < 0.0004) compared to medium (3.1 ± 0.3) and IXE (3.2 ± 0.4) in non‐MDA PsA patients (Figure 3a, lower panel, and Figure 3c). The percentage of CD4+LAG‐3+ T cells after supplementation of ADA were restored to an extent similar to those observed in healthy donors and MDA PsA patients. Incubation with IXE, however, did not change the percentage of CD4+LAG‐3+ T cells in the PBMCs derived from non‐MDA PsA patients (3.2 ± 0.4) compared to medium.
Altered distribution of CD4+LAG‐3+ and CD4+CD25+ T cell subsets in MDA and non‐MDA PsA patients after culture with anti‐TNF
We further analyzed the level of T cell activation measured as %CD4+CD25+ T cell expression in relation to the changes observed in the %CD4+LAG‐3+ T cells in all experimental samples. As shown in Figure 4, in a concomitant analysis of %CD4+LAG‐3+ and %CD4+CD25+ T cells we found that in healthy controls (Figure 4a), anti‐TNF non‐significantly reduced the %CD4+CD25+ T cells (5.1 ± 0.6) compared to medium (5.4 ± 0.5) and to anti‐IL‐17A (5.3 ± 0.6) and %CD4+LAG‐3+ T cells were unchanged in medium, anti‐TNF and anti‐IL‐17A samples. In MDA PsA patients (Figure 4b), %CD4+LAG‐3+ T cells were unchanged following co‐culture with anti‐TNF but %CD4+CD25+ T cells were significantly reduced by anti‐TNF (3.2 ± 0.4, p < 0.05) compared to medium (5.0 ± 0.7) and anti‐IL‐17A (4.6 ± 0.5). In non‐MDA PsA patients (Figure 4c) %CD4+LAG‐3+ T cells were significantly induced but, conversely, %CD4+CD25+ T cells were significantly reduced by anti‐TNF (3.2 ± 0.4, p < 0.01) compared to medium (5.1 ± 0.5) and anti‐IL‐17A (5.3 ± 0.6).
FIGURE 4.
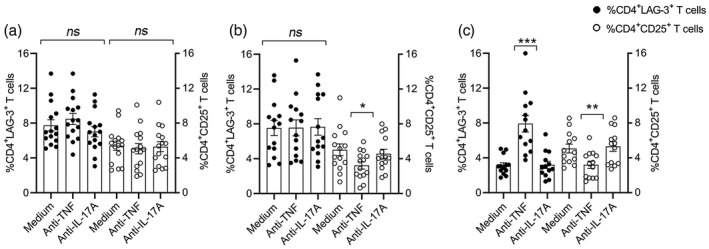
Anti‐tumor necrosis factor (TNF) induces up‐regulation of CD4+ lymphocyte‐activation gene (LAG)‐3+ and down‐regulation of CD4+CD25+ T cells after in‐vitro culture of peripheral blood mononuclear cells (PBMCs) derived from non‐minimal disease activity (MDA) psoriatic arthritis (PsA) patients. Flow cytometric analysis of % T cell populations after 5 days co‐culture with medium alone, anti‐TNF (10 μg/ml) or anti‐interleukin (IL)‐17A (10 μg/ml) in PBMCs (1.5 × 10⁶ cells/ml) derived from (a) healthy controls, n = 15; (b) MDA PsA patients, n = 14; and (c) non‐MDA PsA patients, n = 13. Dot graphs represent the mean ± standard error (SE); statistical analysis was performed using Kruskall–Wallis or Mann–Whitney U‐tests. *p < 0.05, **p < 0.01, ***p < 0.001; NS = not statistically significant
In order to determine whether the potency to up‐regulate the %CD4+LAG‐3+ T cells in vitro was solely attributed to the anti‐TNF agent employed in these experiments (namely, ADA), or could be mediated by other anti‐TNFs, we incubated PBMCs derived from non‐MDA PsA patients in the presence of two additional anti‐TNFs, IFX and ETN. In addition, a control consisting of a biological that targets the IL‐6 receptor, TCZ, that is not clinically used to treat PsA, was added. All three anti‐TNFs were able to significantly up‐regulate the percentage of CD4+LAG‐3+ T cells in PBMCs derived from non‐MDA PsA patients (n = 7): ADA = 9.7 ± 0.4, p < 0.001; IFX = 9.5 ± 0.8, p < 0.03; and ETN 8.6 ± 0.6, p < 0.03 compared to medium control (5.7 ± 0.8). In contrast, anti‐IL‐6R, TCZ, did not significantly change the percentages of CD4+LAG‐3+ T cells (6.4 ± 0.6) compared to the medium control (Figure 5).
FIGURE 5.
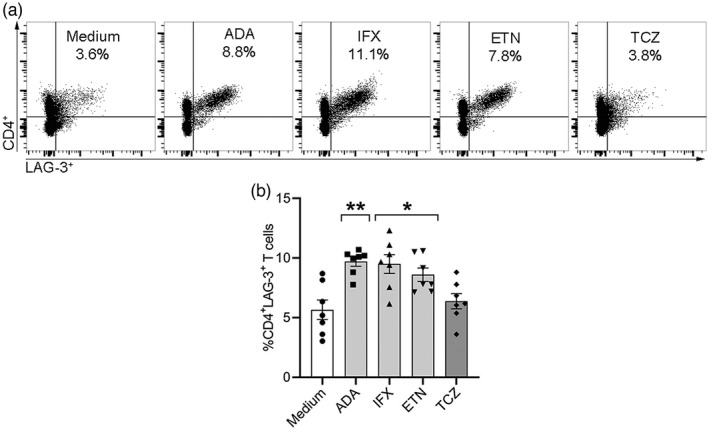
Three different anti‐tumor necrosis factors (TNFs) induce CD4+ lymphocyte‐activation gene (LAG)‐3+ T cells in peripheral blood mononuclear cells (PBMCs) derived from non‐minimal disease activity (MDA) psoriatic arthritis (PsA) patients in vitro. PBMCs from non‐MDA PsA patients (n = 7) were incubated for 5 days with adalimumab (ADA), infliximab (IFX), etanercept (ETN) or with tocilizumab (TCZ) (10 μg/ml) and medium alone as a control in vitro. (a) Representative dot‐plots of CD4+LAG‐3+ T cells are presented in the right upper quadrant of each graph with the percentage indicated. (b) Box‐plot graphs represent the mean ± standard error (SE) percentage of CD4+LAG‐3+ T cells after 5 days in vitro. Statistical analysis for graph in (b) was performed using the Kruskal–Wallis test with Dunn’s post‐hoc test. *p < 0.03, **p < 0.001
Inverse correlation between proportion of CD4+LAG‐3+ T cells in PBMCs cultured in vitro and PsA disease activity
The rate of PsA disease activity correlated with the percentage of CD4+LAG‐3+ T cells in PBMCs derived from MDA PsA patients (n = 14) and non‐MDA PsA patients (n = 13) after 5 days in culture in vitro (Figure 6). Pearson’s analysis confirmed a significant inverse correlation between PsA disease activity scores measured by CPDAI (Figure 6a) (r = −0.47, p > 0.02) and PASDAS (Figure 6b) (r = −0.51, p < 0.008) and the percentage of CD4+LAG‐3+ T cells in PBMCs derived from MDA PsA patients and non‐MDA PsA patients. No correlations were found between the following clinical parameters for assessing disease activity: CRP, ESR, tender joints, swollen joints, PASI, DAPSA and percentages of CD4+LAG‐3+ T cells in the PBMCs derived from the MDA PsA and non‐MDA PsA patients (data not shown).
FIGURE 6.
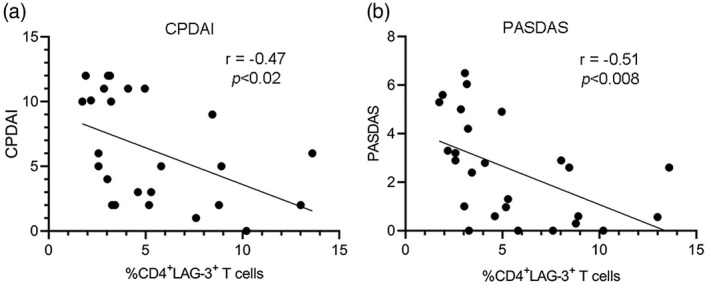
Correlation of psoriatic arthritis (PsA) disease activity rates with percentage of CD4+ lymphocyte‐activation gene (LAG)‐3+ T cells in peripheral blood mononuclear cells (PBMCs) derived from minimal disease activity (MDA) and non‐MDA PsA patients after in‐vitro culture. Correlation analyses between expression levels of CD4+LAG‐3+ T cells in PBMCs derived from MDA and non‐MDA PsA patients after in‐vitro culture and (a) composite psoriatic disease activity index (CPDAI) and (b) psoriatic arthritis disease activity score (PASDAS), which measure PsA disease activity. Pearson’s correlation was applied for analysis, and regression lines are presented in the correlation plots
Concentration of soluble LAG‐3 in sera of PsA patients
To further determine differences in soluble LAG‐3 levels in PsA compared to healthy controls, we evaluated sera samples from PsA patients naive to biologicals to exclude the possible impact of biologics on LAG‐3 expression. The concentration of soluble LAG‐3 in PsA patients naive to biological therapy was significantly lower (2.4 ± 0.3 ng/ml) than in healthy controls (4.2 ± 0.7 ng/ml), p < 0.03 (Figure 7). However, there was no significant correlation between disease activity scores (tender joint, swollen joint and PASI) and soluble LAG‐3 levels (data not shown).
FIGURE 7.
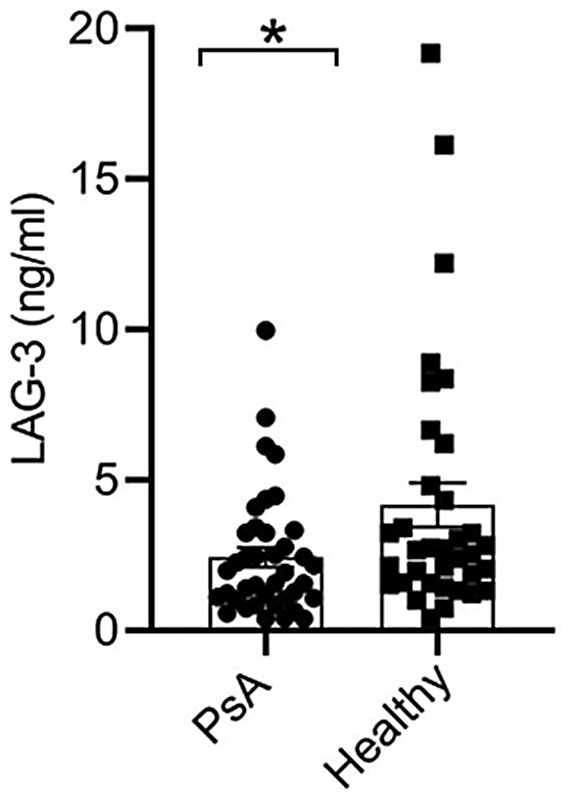
Lower concentration of soluble lymphocyte‐activation gene (LAG)‐3 in PsA patients than in healthy controls. Serum soluble LAG‐3 in psoriatic arthritis (PsA) patients (n = 39) and healthy controls (n = 35) determined by enzyme‐linked immunosorbent assay (ELISA). Graph shows mean ± standard error (SE); statistical analysis was performed using the Mann–Whitney U‐test, *p < 0.03
DISCUSSION
The findings of the current study showed a significant down‐regulation of in‐vitro %CD4+LAG‐3+ T cells in PsA patients with active disease (non‐MDA) compared to those derived from inactive PsA patients (MDA) and healthy controls. In addition, only anti‐TNF but not anti‐IL‐17A agents could restore the %CD4+LAG‐3+ T cell population in non‐MDA PsA patients, while %CD4+LAG‐3+ T cells derived from the MDA PsA patients or healthy controls were not affected by either of the biological agents. An opposite effect of anti‐TNF potency to up‐regulate the %CD4+LAG‐3+ and down‐regulate the activated %CD4+CD25+ T cells was observed in non‐MDA PsA patients. We also found an inverse correlation between the clinical parameters CPDAI and PASDAS of the MDA PsA and non‐MDA PsA patients and the percentage of CD4+LAG‐3+ T cells. This finding suggests that CD4+LAG‐3+ T cells may constitute an unrecognized immune cell population associated with high disease activity in PsA. Consistently, sera LAG‐3 levels were also lower in naive to biological PsA patients compared to healthy controls.
LAG‐3+ Tregs have been implicated in several inflammatory diseases. Similar to our results in PsA, in RA, peripheral LAG‐3+ Tregs were significantly reduced compared to healthy donors, and their levels were particularly low in RA patients with higher disease activity. Those LAG‐3 T cells were IL‐10‐producing cells that suppressed antibody‐producing B cells in an IL‐10‐independent manner, but rather through Fas–Fas ligand interaction [27].
Reduced LAG‐3 levels were also found in psoriasis (PsO) [28]. Recently, Yu et al. [29] demonstrated that LAG‐3 was dramatically decreased in circulating CD4+ T cells of moderate‐to‐severe plaque PsO patients. In contrast, mild PsO patients and healthy controls had higher and equivalent levels of LAG‐3 on CD4+ T cells (although relatively low). This study is in line with ours, showing that in active PsA and PsO LAG‐3 T cells were reduced, while in mild disease activity patients the LAG‐3 level on T cells was equivalent to its level in healthy controls. The difference between studies is that Yu et al. determined LAG‐3 T cell levels in circulation and we used in‐vitro conditions that putatively overcome restrictions found in circulation to allow the low LAG‐3 T cell frequency to expand. As our goal was to imitate in‐vivo conditions, we incubated the cells for 5 days without stimulating agents such as anti‐CD3/CD28.
PsA and PsO fall within a spectrum of diseases with a shared genetic background and immunological pathways; LAG‐3 T cells might be involved in anti‐inflammatory pathways in both diseases. Our study revealed that in‐vitro culture of PBMCs derived from PsA patients could mirror changes in the LAG‐3 T cell population in PsA patients with different disease activity, as shown by Yu et al. in PsO. Moreover, in‐vitro conditions can be employed to detect changes in the LAG‐3 T cell population as a biomarker for PsA disease activity, as formal autoantibodies or biomarkers for diagnosis and prognosis are still lacking.
The next step of our study was to assess the ability of biologicals commonly used for PsA treatment to modulate LAG‐3+ T cells. We found that TNF but not IL‐17A or IL‐6R blockers restored the particularly low CD4+LAG‐3+ T cells in active non‐MDA PsA patients. In agreement with our results, Yu et al. [29] reported on TNF blockers’ potency to modulate LAG‐3+ T cells in moderate‐to‐severe plaque PsO patients treated with IFX, with LAG‐3 on CD4 T cells increased after treatment. These results show that anti‐TNF could up‐regulate LAG‐3 T cells in each disease context, namely PsA and PsO, and that the impact of anti‐TNF on these immune cells could be mirrored in ex‐vivo conditions that reflect anti‐TNF activity on LAG‐3 T cells after therapy, as was determined in the patients’ circulation. Another biological agent, abatacept, composed of recombinant domains of cytotoxic T lymphocyte‐associated antigen 4 (CTLA‐4) fused to human IgG constant region domains [30], was shown to promote LAG‐3+ T cells in RA patients [27, 31]. Moreover, supplementation of abatacept to T cell culture derived from RA patients was able to induce LAG‐3+ Treg expansion in vitro [27].
In accordance with our finding of reduced CD4+LAG‐3+ T cells in active PsA patients, the programmed cell death protein 1 (PD‐1) shown to induce Treg suppressive function [32] was reduced in T cells of PsA patients [33, 34]. This may suggest that PD‐1 and LAG‐3 are synergistically involved in abnormal T cell activation and function in PsA.
We have previously shown that anti‐TNF reduced the activated CD4+CD25+ T cells derived from PBMCs of PsA patients in vitro [35]. These findings were consolidated with recently published reports demonstrating that LAG‐3 inhibited CD4 + T cell activation [36] and that LAG‐3 was up‐regulated in the reduced activated cells [37]. The mechanisms proposed for anti‐TNF ability to increase Tregs function are through FoxP3 mRNA and protein up‐regulation and restoration of suppressive function through TNF receptor 2 on Tregs [38]. Anti‐TNF ability to induce LAG‐3 on CD4 T cells could result from the observation of its ability to induce the IFN type I pathway [39] and the latter to regulate LAG‐3 on T cells [40]. In addition, this study confirmed that sera LAG‐3 levels were lower in PsA patients naive to biological treatment compared to healthy controls.
The current study has a few limitations. First, we did not detect LAG‐3+ Tregs at the same time that the samples were taken, as the LAG‐3 expression level on fresh PBMCs was relatively very low and the analysis was performed after in‐vitro culture. Secondly, we looked at the surface expression without measuring the intracellular LAG‐3, although half the cellular content of LAG‐3 was retained in intracellular compartments [41]. Finally, our study sample size was relatively small.
In conclusion, CD4+LAG‐3+ T cell analyses after in‐vitro culture were reduced in active PsA patients (non‐MDA) compared to non‐active PsA patients (MDA) and healthy controls. There was an inverse correlation between the percentage of CD4+LAG‐3+ T cells and the clinical parameters CPDAI and PASDAS in patients with PsA. This implies that LAG‐3 may be considered as a marker for PsA disease activity and that LAG‐3 might play a role in PsA pathogenesis. Our results demonstrated a critical role of anti‐TNF, but not for anti‐IL‐17A, in CD4+LAG‐3+ T cell population modulation in non‐MDA PsA patients. In addition, PsA patients displayed significantly decreased LAG‐3 sera levels compared with healthy controls. Further studies on larger PsA cohorts are warranted to address these issues.
CONFLICTS OF INTEREST
All authors report no conflicts of interest.
AUTHOR CONTRIBUTIONS
S.G. and A.P. were responsible for study design, experiments performance, acquisition and data analysis. A.P., V.F., D.L. and O.E. provided clinical samples and analyzed clinical data and results. S.G. prepared the figures and wrote the manuscript. All authors approved the final version of the manuscript.
ACKNOWLEDGEMENTS
This research was funded by internal research funds of the Department of Rheumatology at the Tel Aviv Sourasky Medical Center, Israel.
Gertel S, Polachek A, Furer V, Levartovsky D, Elkayam O. CD4+LAG‐3+ T cells are decreased in active psoriatic arthritis patients and their restoration in vitro is mediated by TNF inhibitors. Clin Exp Immunol. 2021;206:173–183. 10.1111/cei.13646
Smadar Gertel and Ari Polachek contributed equally to this study.
DATA AVAILABILITY STATEMENT
The data sets used and/or analyzed during the present study are available from the corresponding author on reasonable request.
REFERENCES
- 1. Coates LC, Fransen J, Helliwell PS. Defining minimal disease activity in psoriatic arthritis: a proposed objective target for treatment. Ann Rheum Dis. 2010;69:48–53. [DOI] [PubMed] [Google Scholar]
- 2. Diani M, Altomare G, Reali E. T cell responses in psoriasis and psoriatic arthritis. Autoimmun Rev. 2015;14:286–92. [DOI] [PubMed] [Google Scholar]
- 3. Roncarolo MG, Battaglia M. Regulatory T‐cell immunotherapy for tolerance to self antigens and alloantigens in humans. Nat Rev Immunol. 2007;7:585–98. [DOI] [PubMed] [Google Scholar]
- 4. Sakaguchi S, Yamaguchi T, Nomura T, Ono M. Regulatory T cells and immune tolerance. Cell. 2008;133:775–87. [DOI] [PubMed] [Google Scholar]
- 5. Szentpetery A, Heffernan E, Gogarty M, Mellerick L, McCormack J, Haroon M, et al. Abatacept reduces synovial regulatory T‐cell expression in patients with psoriatic arthritis. Arthritis Res Ther. 2017;19:158. [DOI] [PMC free article] [PubMed] [Google Scholar]
- 6. Linterman MA, Pierson W, Lee SK, Kallies A, Kawamoto S, Rayner TF, et al. Foxp3+ follicular regulatory T cells control the germinal center response. Nat Med. 2011;17:975–82. [DOI] [PMC free article] [PubMed] [Google Scholar]
- 7. Sakaguchi S, Sakaguchi N, Asano M, Itoh M, Toda M. Immunologic self‐tolerance maintained by activated T cells expressing IL‐2 receptor alpha‐chains (CD25). Breakdown of a single mechanism of self‐tolerance causes various autoimmune diseases. J Immunol. 1995;155:1151–64. [PubMed] [Google Scholar]
- 8. Yagi H, Nomura T, Nakamura K, Yamazaki S, Kitawaki T, Hori S, et al. Crucial role of FOXP3 in the development and function of human CD25+CD4+ regulatory T cells. Int Immunol. 2004;16:1643–56. [DOI] [PubMed] [Google Scholar]
- 9. Huang CT, Workman CJ, Flies D, Pan X, Marson AL, Zhou G, et al. Role of LAG‐3 in regulatory T cells. Immunity. 2004;21:503–13. [DOI] [PubMed] [Google Scholar]
- 10. Huard B, Prigent P, Tournier M, Bruniquel D, Triebel F. CD4/major histocompatibility complex class II interaction analyzed with CD4‐ and lymphocyte activation gene‐3 (LAG‐3)‐Ig fusion proteins. Eur J Immunol. 1995;25:2718–21. [DOI] [PubMed] [Google Scholar]
- 11. Huard B, Tournier M, Hercend T, Triebel F, Faure F. Lymphocyte‐activation gene 3/major histocompatibility complex class II interaction modulates the antigenic response of CD4+ T lymphocytes. Eur J Immunol. 1994;24:3216–21. [DOI] [PubMed] [Google Scholar]
- 12. Triebel F. LAG‐3: a regulator of T‐cell and DC responses and its use in therapeutic vaccination. Trends Immunol. 2003;24:619–22. [DOI] [PubMed] [Google Scholar]
- 13. Workman CJ, Vignali DA. The CD4‐related molecule, LAG‐3 (CD223), regulates the expansion of activated T cells. Eur J Immunol. 2003;33:970–9. [DOI] [PubMed] [Google Scholar]
- 14. Mease PJ, Gladman DD, Ritchlin CT, Ruderman EM, Steinfeld SD, Choy EH, et al. Adalimumab effectiveness in Psoriatic Arthritis Trial Study G. Adalimumab for the treatment of patients with moderately to severely active psoriatic arthritis: results of a double‐blind, randomized, placebo‐controlled trial. Arthritis Rheum. 2005;52:3279–89. [DOI] [PubMed] [Google Scholar]
- 15. Mease PJ, McInnes IB, Kirkham B, Kavanaugh A, Rahman P, van der Heijde D, et al., Group FS . Secukinumab inhibition of interleukin‐17A in patients with psoriatic arthritis. N Engl J Med. 2015;373:1329–39. [DOI] [PubMed] [Google Scholar]
- 16. Mease PJ, van der Heijde D, Ritchlin CT, Okada M, Cuchacovich RS, Shuler CL, et al., Group S‐PS . Ixekizumab, an interleukin‐17A specific monoclonal antibody, for the treatment of biologic‐naive patients with active psoriatic arthritis: results from the 24‐week randomised, double‐blind, placebo‐controlled and active (adalimumab)‐controlled period of the phase III trial SPIRIT‐P1. Ann Rheum Dis. 2017;76:79–87. [DOI] [PMC free article] [PubMed] [Google Scholar]
- 17. Maini RN, Taylor PC, Szechinski J, Pavelka K, Broll J, Balint G, Emery P, Raemen F, Petersen J, Smolen J, Thomson D, Kishimoto T, Group CS . Double‐blind randomized controlled clinical trial of the interleukin‐6 receptor antagonist, tocilizumab, in European patients with rheumatoid arthritis who had an incomplete response to methotrexate. Arthritis Rheum. 2006;54:2817–29. [DOI] [PubMed] [Google Scholar]
- 18. Ogata A, Umegaki N, Katayama I, Kumanogoh A, Tanaka T. Psoriatic arthritis in two patients with an inadequate response to treatment with tocilizumab. Joint Bone Spine. 2012;79:85–7. [DOI] [PubMed] [Google Scholar]
- 19. Aravena O, Pesce B, Soto L, Orrego N, Sabugo F, Wurmann P, et al. Anti‐TNF therapy in patients with rheumatoid arthritis decreases Th1 and Th17 cell populations and expands IFN‐gamma‐producing NK cell and regulatory T cell subsets. Immunobiology. 2011;216:1256–63. [DOI] [PubMed] [Google Scholar]
- 20. Huang Z, Yang B, Shi Y, Cai B, Li Y, Feng W, et al. Anti‐TNF‐alpha therapy improves Treg and suppresses Teff in patients with rheumatoid arthritis. Cell Immunol. 2012;279:25–9. [DOI] [PubMed] [Google Scholar]
- 21. Lina C, Conghua W, Nan L, Ping Z. Combined treatment of etanercept and MTX reverses Th1/Th2, Th17/Treg imbalance in patients with rheumatoid arthritis. J Clin Immunol. 2011;31:596–605. [DOI] [PubMed] [Google Scholar]
- 22. Szalay B, Vasarhelyi B, Cseh A, Tulassay T, Deak M, Kovacs L, et al. The impact of conventional DMARD and biological therapies on CD4+ cell subsets in rheumatoid arthritis: a follow‐up study. Clin Rheumatol. 2014;33:175–85. [DOI] [PubMed] [Google Scholar]
- 23. Blache C, Lequerre T, Roucheux A, Beutheu S, Dedreux I, Jacquot S, et al. Number and phenotype of rheumatoid arthritis patients' CD4+CD25hi regulatory T cells are not affected by adalimumab or etanercept. Rheumatology (Oxford). 2011;50:1814–22. [DOI] [PubMed] [Google Scholar]
- 24. Taylor W, Gladman D, Helliwell P, Marchesoni A, Mease P, Mielants H, Group CS . Classification criteria for psoriatic arthritis: development of new criteria from a large international study. Arthritis Rheum. 2006;54:2665–73. [DOI] [PubMed] [Google Scholar]
- 25. Fredriksson T, Pettersson U. Severe psoriasis – oral therapy with a new retinoid. Dermatologica. 1978;157:238–44. [DOI] [PubMed] [Google Scholar]
- 26. Fries JF, Spitz P, Kraines RG, Holman HR. Measurement of patient outcome in arthritis. Arthritis Rheum. 1980;23:137–45. [DOI] [PubMed] [Google Scholar]
- 27. Nakachi S, Sumitomo S, Tsuchida Y, Tsuchiya H, Kono M, Kato R, et al. Interleukin‐10‐producing LAG3(+) regulatory T cells are associated with disease activity and abatacept treatment in rheumatoid arthritis. Arthritis Res Ther. 2017;19:97. [DOI] [PMC free article] [PubMed] [Google Scholar]
- 28. Kim J, Lee J, Gonzalez J, Fuentes‐Duculan J, Garcet S, Krueger JG. Proportion of CD4(+)CD49b(+)LAG‐3(+) Type 1 regulatory T cells in the blood of psoriasis patients inversely correlates with psoriasis area and severity index. J Invest Dermatol. 2018;138:2669–72. [DOI] [PubMed] [Google Scholar]
- 29. Yu Y, Chen Z, Wang Y, Li Y, Lu J, Cui L, et al. Infliximab modifies regulatory T cells and co‐inhibitory receptor expression on circulating T cells in psoriasis. Int Immunopharmacol. 2021;96:107722. [DOI] [PubMed] [Google Scholar]
- 30. Emery P. The therapeutic potential of costimulatory blockade with CTLA4Ig in rheumatoid arthritis. Expert Opin Invest Drugs. 2003;12:673–81. [DOI] [PubMed] [Google Scholar]
- 31. Alenazy MF, Saheb Sharif‐Askari F, Omair MA, El‐Wetidy MS, Omair MA, Mitwalli H, et al. Abatacept enhances blood regulatory B cells of rheumatoid arthritis patients to a level that associates with disease remittance. Sci Rep. 2021;11:5629. [DOI] [PMC free article] [PubMed] [Google Scholar]
- 32. Francisco LM, Salinas VH, Brown KE, Vanguri VK, Freeman GJ, Kuchroo VK, et al. PD‐L1 regulates the development, maintenance, and function of induced regulatory T cells. J Exp Med. 2009;206:3015–29. [DOI] [PMC free article] [PubMed] [Google Scholar]
- 33. Bartosinska J, Zakrzewska E, Purkot J, Michalak‐Stoma A, Kowal M, Krasowska D, et al. Decreased blood CD4+PD‐1+ and CD8+PD‐1+ T cells in psoriatic patients with and without arthritis. Postepy Dermatol Alergol. 2018;35:344–50. [DOI] [PMC free article] [PubMed] [Google Scholar]
- 34. Bartosinska J, Zakrzewska E, Raczkiewicz D, Purkot J, Michalak‐Stoma A, Kowal M, et al. Suppressed programmed death 1 expression on CD4(+) and CD8(+) T cells in psoriatic patients. Mediat Inflamm. 2017;2017:5385102. [DOI] [PMC free article] [PubMed] [Google Scholar]
- 35. Gertel S, Polachek A, Furer V, Levartovsky D, Sidis H, Pel S, et al. T cell functions of psoriatic arthritis patients are regulated differently by TNF, IL‐17A and IL‐6 receptor blockades in vitro . Clin Exp Rheumatol. 2021. [DOI] [PubMed] [Google Scholar]
- 36. Maruhashi T, Okazaki IM, Sugiura D, Takahashi S, Maeda TK, Shimizu K, et al. LAG‐3 inhibits the activation of CD4(+) T cells that recognize stable pMHCII through its conformation‐dependent recognition of pMHCII. Nat Immunol. 2018;19:1415–26. [DOI] [PubMed] [Google Scholar]
- 37. Koga MM, Engel A, Pigni M, Lavanchy C, Stevanin M, Laversenne V, et al. IL10‐ and IL35‐secreting MutuDC lines act in cooperation to inhibit memory t cell activation through LAG‐3 expression. Front Immunol. 2021;12:607315. [DOI] [PMC free article] [PubMed] [Google Scholar]
- 38. Valencia X, Stephens G, Goldbach‐Mansky R, Wilson M, Shevach EM, Lipsky PE. TNF downmodulates the function of human CD4+CD25hi T‐regulatory cells. Blood. 2006;108:253–61. [DOI] [PMC free article] [PubMed] [Google Scholar]
- 39. Wampler Muskardin TL, Fan W, Jin Z, Jensen MA, Dorschner JM, Ghodke‐Puranik Y, et al. Distinct single cell gene expression in peripheral blood monocytes correlates with tumor necrosis factor inhibitor treatment response groups defined by Type I interferon in rheumatoid arthritis. Front Immunol. 2020;11:1384. [DOI] [PMC free article] [PubMed] [Google Scholar]
- 40. Sumida TS, Dulberg S, Schupp J, Stillwell HA, Axisa PP, Comi M, et al. Type I interferon transcriptional network regulates expression of coinhibitory receptors in human T cells. bioRxiv 2020. 10.1101/2020.10.30.362947 [DOI] [PMC free article] [PubMed] [Google Scholar]
- 41. Woo SR, Li N, Bruno TC, Forbes K, Brown S, Workman C, et al. Differential subcellular localization of the regulatory T‐cell protein LAG‐3 and the coreceptor CD4. Eur J Immunol. 2010;40:1768–77. [DOI] [PMC free article] [PubMed] [Google Scholar]
Associated Data
This section collects any data citations, data availability statements, or supplementary materials included in this article.
Data Availability Statement
The data sets used and/or analyzed during the present study are available from the corresponding author on reasonable request.


