

Abstract
Gamma‐tocotrienol (γT3) is an analogue of vitamin E with beneficial effects on the immune system, including immune‐modulatory properties. This study reports the immune‐modulatory effects of daily supplementation of γT3 on host T helper (Th) and T regulatory cell (Treg) populations in a syngeneic mouse model of breast cancer. Female BALB/c mice were fed with either γT3 or vehicle (soy oil) for 2 weeks via oral gavage before they were inoculated with syngeneic 4T1 mouse mammary cancer cells (4T1 cells). Supplementation continued until the mice were euthanized. Mice (n = 6) were euthanized at specified time‐points for various analysis (blood leucocyte, cytokine production and immunohistochemistry). Tumour volume was measured once every 7 days. Gene expression studies were carried out on tumour‐specific T lymphocytes isolated from splenic cultures. Supplementation with γT3 increased CD4+ (p < 0.05), CD8+ (p < 0.05) T‐cells and natural killer cells (p < 0.05) but suppressed Treg cells (p < 0.05) in peripheral blood when compared to animals fed with the vehicle. Higher interferon (IFN)‐γ and lower transforming growth factor (TGF)‐ꞵ levels were noted in the γT3 fed mice. Immunohistochemistry findings revealed higher infiltration of CD4+ cells, increased expression of interleukin‐12 receptor‐beta‐2 (IL‐12ꞵ2R), interleukin (IL)‐24 and reduced expression of cells that express the forkhead box P3 (FoxP3) in tumours from the γT3‐fed animals. Gene expression studies showed the down‐regulation of seven prominent genes in splenic CD4+ T cells isolated from γT3‐fed mice. Supplementation with γT3 from palm oil‐induced T cell‐dependent cell‐mediated immune responses and suppressed T cells in the tumour microenvironment in a syngeneic mouse model of breast cancer.
Keywords: adaptive immunity, breast cancer, gamma‐tocotrienol, mouse model, T lymphocyte
Supplementation with gamma‐tocotrienols modulate host immune system to produce anti‐cancer immune responses in a syngeneic mouse model of breast cancer. Evidence from cellular studies to show that supplementation with gamma‐tocotrienol induce T‐cell dependent cell‐mediated immune responses (Th1) and suppress Treg cells in a tumour microenvironment
INTRODUCTION
The immune system plays a pivotal role in the host defence immune system, mainly by protecting the host from infections, fighting infections and detecting and eliminating abnormal and malignant cells. Both innate and adaptive arms of the immune system work hand‐in‐hand to protect the host. The immune system’s innate arm possesses non‐specific defence mechanisms such as phagocytosis by neutrophils, macrophages and dendritic cells (DC) and cytotoxic effects by natural killer (NK) cells. The immune system’s adaptive arm, also known as acquired immune response, is triggered later once the innate responses have tried to overcome infection or other pathological conditions. The adaptive responses are highly antigen‐specific, provide immunological tolerance to self‐antigen and possess immunological memory [1]. The adaptive arm provides cell‐mediated and humoral immune responses. Cell‐mediated immune responses are useful in fighting viral infections, and cancers are considered T cell‐mediated immune responses. The B lymphocytes differentiate into plasma and memory cells when appropriately activated. Plasma cells secrete antibodies. In the event of tumour development and progression, host anti‐tumour immune responses are provided by the NK cells and cytotoxic T lymphocytes (CTL) with the help of T helper (Th) cells and DC [2]. Th cells express the glycoprotein CD4 on their surface. In the literature, it is reported that naive Th cells can be differentiate into Th type 1 (Th1) [3], Th2 [4], Th17 [5], Th22 [6] and regulatory T cells (Treg) [7]. The actions of the Th cells are generally balanced by the Treg cells. Treg cells play a key role in suppressing the activation of autoreactive immune cells and protect the host from autoimmune diseases.
Cancer cells are host cells that have become ‘rogue’ cells that have unlimited ability to proliferate. As cancer cells express mainly self‐antigens, the host Treg cells often inhibit host anti‐tumour immune responses, resulting in overall immunosuppression, especially in the tumour microenvironment, to protect the tumour cells from host immune response, thus facilitating tumour progression [8]. Recent studies suggest that Treg cells may play dual roles in the tumour microenvironment by protecting the host and the tumour cells [9, 10]. For instance, Treg cells are reported to down‐regulate inflammatory responses associated with tumour progression, generally benefiting the host [11]. However, high numbers of Treg cells in the tumour microenvironment can interfere with immune surveillance and support tumour progression [12].
Many bioactive compounds derived from natural plants have been shown to have immune‐modulatory effects on regulating the Th population, particularly cancer. One such compound is gamma‐tocotrienol (γT3), a natural compound which belongs to the vitamin E family. Tocotrienols are found abundantly in palm oil, and the vitamin E fraction from palm oil is known as tocotrienol‐rich fraction (TRF), which contains 30% alpha‐tocopherols (αToc) and 70% tocotrienols (T3) (isoforms α, β, δ and γ) [13]. Previous studies have shown that T3 have potent anti‐oxidant [14], neuroprotective [15], cholesterol‐lowering [16], cardioprotective [17], anti‐cancer [18, 19] and immune regulatory properties [20]. The γT3 isoform was reported to possess anti‐oxidant [21], radioprotective [22] and anti‐cancer [23] activities. In the present study, the effects of daily supplementation of palm γT3 on modulating the host immune system were evaluated using a syngeneic mouse model of breast cancer that we have previously described [24, 25].
MATERIALS AND METHODS
Cell lines and culture condition
The 4T1 mouse mammary cancer cell line [American Type Culture Collection (ATCC), Rockville, Maryland, USA] was derived from a mammary gland tumour of BALB/c mice and is reported to be comparable to human stage IV breast cancer [26]. The 4T1 cells were cultured in T75 flasks (Orange Scientific, Braine‐l’Alleud, Belgium) in complete medium [RPMI‐1640 media containing L‐glutamine (gibco; Invitrogen, San Diego, California, USA), supplemented with 10% fetal bovine serum (FBS/gibco; Invitrogen), 1% penicillin‐streptomycin (Gibco; Invitrogen) and 1% glutamine (Gibco; Invitrogen)] at 37°C in a humidified atmosphere of 5% carbon dioxide.
Treatment preparation
Pure γT3 derived from palm oil was obtained from the Malaysian Palm Oil Board (MPOB). The γT3 was extracted from palm oil at 95 to 99% purity using a published method [27]. For daily supplementation, 0.5 mg of γT3 was dissolved in 50 μl soy oil, which served as the vehicle.
Tumour inoculation and animal experimentation
Female BALB/c mice aged 5–6 weeks were purchased from a local supplier (Chenur Suppliers, Selangor, Malaysia). The mice were housed in an animal holding facility (AHF) at the International Medical University (IMU), which was maintained at room temperature (25 ± 2°C) with a 12:12 h dark/light cycle. All mice were acclimatised for a week. They had free access to standard food pellet and water. Following acclimatization, the mice were randomly assigned into experimental and vehicle groups (Table 1). The mice in the experimental group were fed with 0.5 mg γT3 (dissolved in the vehicle) twice a day via oral gavage for 14 days while mice in the vehicle group received 50 µl of soy oil, which served as the vehicle. On day 15, all the mice were inoculated with 4T1 cells to induce breast cancer (BC) [26]. Briefly, the 4T1 cells were counted, and a cell suspension containing 10 000 cells/ml was prepared in RPMI medium. Tumour‐induced mice fed with vehicle (T vehicle) or γT3 (T‐GT3) groups received an injection (100 µl) of this 4T1 cell suspension in their right mammary fat pad. The mice continued to receive the same supplementation throughout this study. Tumour was palpable 14 days after inoculation with the 4T1 cells. Following this, tumour volume was measured every 7 days using a digital Vernier calliper, and six mice from each group were euthanized. The tumour volume was calculated according to the formula: V = 0.52 × L2 × W (V = volume, L = length, W = width) [24]. The experiment was terminated on day 49, when the mice in the T vehicle group began to show signs of distress due to the tumour.
TABLE 1.
Grouping of study groups
| Groups | Treatment (oral gavage) | Number | Tumour induction |
|---|---|---|---|
| T vehicle | 50 μl of vehicle twice a day | 36 | Inoculated with 4T1 cells on day 14 |
| T‐GT3 | 50 μl of γT3 (0.5 mg) in vehicle twice a day | 36 |
Abbreviations: C, control; T, tumour‐induced; γT3/GT3, gamma‐tocotrienols.
Vehicle: soy oil.
Analysis of leucocytes in peripheral blood
At autopsy, blood was obtained through cardiac puncture and collected in heparinized tubes. The tubes were centrifuged (1
132 g for 10 min at 4°C) to separate the plasma and buffy coat. The buffy coat containing the peripheral blood leucocytes was washed thrice with cold phosphate‐buffered saline (PBS) and recovered by centrifugation (90 g for 5 min at 4°C). The cells were counted (1 × 10⁶ cells per tube) and stained with fluorochrome‐conjugated antibodies to various cell surface markers and analysed using a multi‐colour flow cytometer (FACSCalibur; Becton‐Dickson, Franklin Lakes, New Jersey, USA). The mouse fluorochrome‐conjugated antibodies (BD Biosciences, San Jose, California, USA) used in the study were (i) Th cells: T cell receptor (TCR)‐β+CD4+CD8A+ [fluorescein isothiocyanate (FITC) TCR‐β+, fluorescein peridinin chlorophyll protein (PerCP)‐conjugated CD4+, allophycocyanin (APC)‐conjugated CD25+]; (ii) NK cells: CD335+CD3e−,CD49b+ [FITC CD335+, PerC‐conjugated CD3e−, phycoerythrin (PE) CD49b+]; (iii) Treg cells: CD4+CD25+ folate receptor‐4+ (fluorescein/PerCP‐conjugated CD4+, APC‐conjugated CD25+, FITC folate receptor‐4+). Data were collected using the Cell Quest software provided by the manufacturer (Becton Dickinson). For each sample, 10 000 cells were acquired for data analysis.
Histopathological assessment and immunohistochemistry staining
At autopsy, tumour, lung and liver were excised from the animals and fixed in 10% formalin for 48 h before being processed and embedded in paraffin wax. Following this, the specimens were sectioned (4 µm) and stained with haematoxylin and eosin (H&E) stains. The stained slides were observed under a light microscope by a consultant pathologist blinded to the study. For immunohistochemistry analysis, the tumour tissue sections were incubated with appropriately diluted primary antibody to murine (i) CD4 (rabbit anti‐mouse CD4 polyclonal antibody); (ii) forkhead box protein 3 (FoxP3) (rabbit anti‐mouse FoxP3 polyclonal antibody); (iii) IL‐24 (rabbit anti‐mouse IL‐24 polyclonal antibody) or (iv) IL‐12Rβ2 (rabbit anti‐mouse IL‐12Rβ2 polyclonal antibody) for 1 h at room temperature. Following this, the slides were washed with washing buffer and incubated with an appropriate secondary antibody (biotinylated anti‐rabbit polyclonal antibody) at room temperature for 20 min. The slides were then washed and incubated with diluted streptavidin‐conjugated horseradish peroxidase (HRP) for 20 min at room temperature. Following this, the slides were washed and incubated with the chromogen and substrate chromogen for 20 min at room temperature. All the antibody‐stained sections were counterstained with haematoxylin for 4 min, and a pathologist observed slides under a microscope to identify immune‐positive areas. Staining intensity was identified by implementing a semi‐quantitative method of the Allred scoring system (0 = negative, 1 = weak, 2 = moderate and 3 = strong) [28]. The percentage of stained cells and the intensity of staining weas determined based on the IHC scores.
Quantification of cytokines
The spleen was aseptically removed during the autopsy and placed in a sterile Petri dish with complete medium. The splenocytes were gently squeezed out of the splenic capsule and recovered by centrifugation (90 g × 10 min at 4°C) and seeded in 96‐well flat‐bottomed plates at a cell density of 5 × 10³ cells per well. Then, 100 μl of 4T1 cells (5 × 10⁴ cells) treated with 25 µg/ml mitomycin C (MMC) for 2 h was prepared and added to the wells containing the splenocytes. The cells were incubated at 37°C in a humidified 5% CO2 incubator for 72 h. Following this, the cells from each well were harvested and recovered by centrifugation (90 g for 10 minutes). The culture supernatant was collected and stored at −80°C, which was used to quantify interferon (IFN)‐γ and transforming growth factor (TGF)‐β produced using commercial enzyme‐linked immunosorbent assay (ELISA) kits as recommended by the manufacturer (eBiosciences, San Diego, California, USA).
Identification of differentially expressed genes of mouse T helper cell differentiation using PCR array
The CD4+ T cells were isolated from mouse splenocyte cultures using a mouse CD4‐positive selection kit, as recommended by the manufacturer (Miltenyi Biotech, Auburn, California, USA). Following this, total RNA was extracted from the isolated CD4+ T cells using the RNeasy Plus Micro Kit (Qiagen, Hilden, Germany). The RNA purity and concentration were determined by measuring absorbance at 260 and 280 nm using a spectrophotometer (NanoQuant, Tecan, San Jose, California, USA). The RNA was used for gene expression profiling analysis using a commercial mouse T helper cell differentiation array [RT2 profiler quantitative PCR (qPCR) array (PAMM‐503Z)], as recommended by the manufacturer (Qiagen)]. This qPCR array consists of a 96‐well plate annotated with primers for 84 essential genes classified under various functional categories, such as cytokines, cytokine receptors, transcription factors and other signalling molecules (see Supporting information). The extracted splenic CD4+ RNA was treated with RT2 SYBR Green Fluor qPCR Mastermix (Qiagen), as per the manufacturer’s protocol and analysed using a real‐time PCR machine [iQ5 Optical Module PCR Detection System (Biorad, Hercules, California, USA)]. A quality check of samples was performed to check on mouse genomic DNA contamination, reverse transcription control (RTC) and positive PCR control (PPC). The cycle threshold (CT) value of mouse genomic DNA was greater than 35 in all samples, indicating no DNA contamination in the extracted RNA samples. The mRNA expression levels were calculated using the fold change using a formula described previously [29].
Interaction of genes
All the genes that have more than a two‐fold change were analysed in the STRING Consortium version 19 software. The gene network was identified by selecting an experimentally determined analysis and k‐mean clustering. The interaction between proteins using the String database can predict possible signalling pathways.
Statistical analysis
Statistical analysis was performed using one‐way analysis of variance (ANOVA). The post‐hoc Dunnett’s test (SPSS version 16) was used to compare the experimental group against the vehicle group. A p value less than 0.05 (p < 0.05) was considered to be statistically significant.
RESULTS
Tumour volume and weight
Reduction in tumour volume was observed on days 21, 28 and 35 in the γT3‐treated group (T‐GT3) compared to the vehicle group (T vehicle) (p < 0.05) (Figure 1a). The reduction in tumour volume was approximately 37.5% on day 35 in the γT3‐treated mice compared to the vehicle. A corresponding reduction in tumour weight was also observed in the γT3‐treated compared to the vehicle on days 21, 28 and 35 (p < 0.05) (Figure 1b).
FIGURE 1.
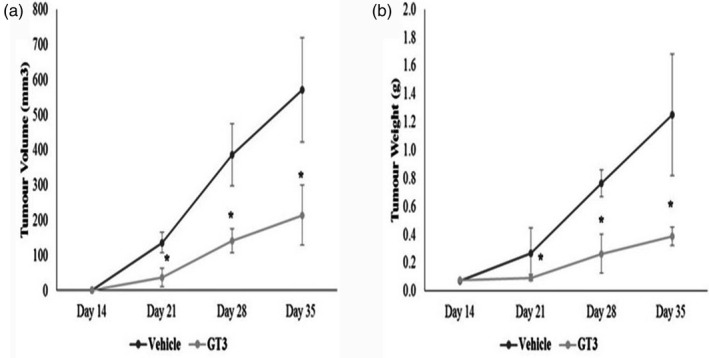
Tumour (a) volume and (b) weight of mice fed with 50 μl of vehicle (vehicle) or γT3 (0.5 mg) twice daily by oral gavage for 2 weeks before they were inoculated with 4T1 murine mammary cancer cells. Tumour was palpable on day 14 post‐inoculation with the 4T1 cells. Tumour (a) volume and (b) weight were measured every 7 days from the time the tumour was palpable. The mice continued to be on the respective supplementation until they were euthanized on day 49. *p < 0.05 versus the vehicle group
T lymphocytes population in peripheral blood
The percentage of CD4+ T cells increased in tumour‐induced animals when the tumour was palpable. There was a marked increase in the CD4+ population in the blood from tumour‐induced animals fed with γT3 (T‐GT3) on days 42 (34%) (p < 0.05) and 49 (26%) (p < 0.05) compared to baseline as well as the T vehicle groups (Figure 2a). There was also a marked increase in CD8+ T cells in tumour‐induced mice supplemented with γT3 on day 42 (10.6%) (p < 0.05) compared to baseline and the T vehicle groups. The mice from the T‐GT3 showed a significant increase in the NK cell population on day 49 compared to baseline or the T vehicle group (Figure 2c). There was a reduction (p < 0.05) in the percentage of Treg cells in mice from the T‐GT3 group on days 28 and 42 when compared to the T vehicle group (Figure 2d).
FIGURE 2.
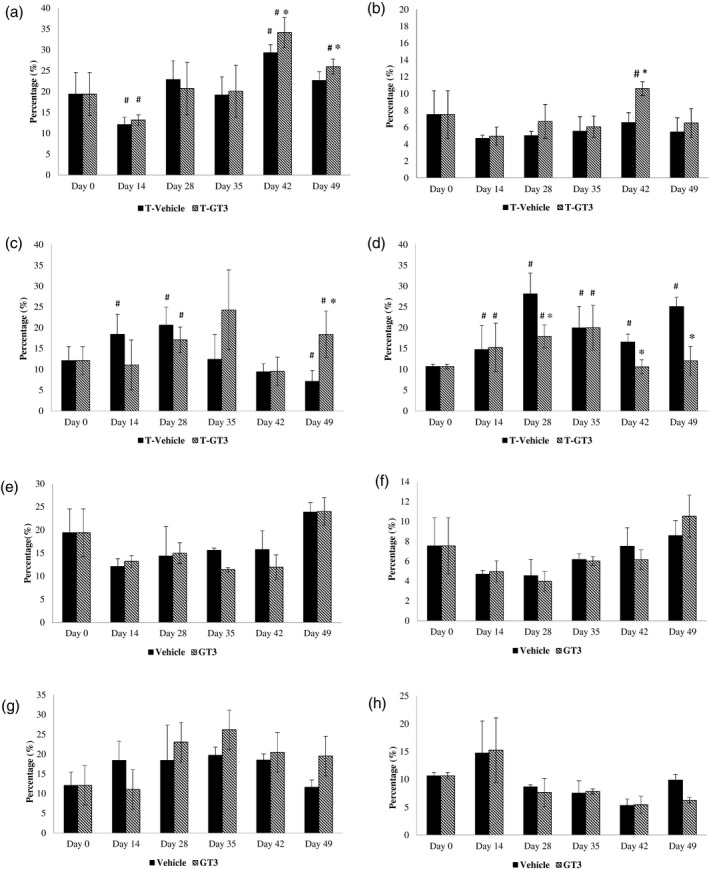
Analysis of leucocyte populations in blood from mice from tumour vehicle and experimental groups. Leucocytes from peripheral blood were isolated and stained with antibodies to various cell surface molecules such as (a) CD4; (b) CD8; (c) natural killer (NK) cells and (d) regulatory T cells (Treg) cells to estimated proportion in peripheral blood. For each sample, 10 000 cells were acquired using a flow cytometer (FACScalibur; BD Biosciences, San Jose, California, USA) [T vehicle: vehicle (V), fed with soy oil and tumour (T) inoculated; T‐GT3: fed with γ‐T3 (GT3) and tumour (T) inoculated]. # p < 0.05 compared against baseline (day 0) and *p < 0.05 compared against tumour vehicle
Measurement of cytokines
The level of IFN‐γ was significantly altered in all the groups on days 28, 35, 42 and 49 when compared against the baseline. There was a marked increase (p < 0.05) in IFN‐γ levels on days 35 and 49 in tumour‐bearing mice fed with γT3 (T‐GT3) compared to T vehicle mice (Figure 3a). A significant reduction in TGF‐β was observed in tumour‐bearing animals fed with γT3 (T‐GT3) on days 14, 28 and 42 at 126, 136 and 203 pg/ml, respectively, in comparison to the T vehicle group.
FIGURE 3.
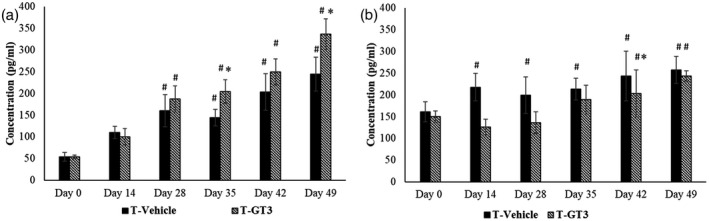
The amount of (a) interferon (IFN)‐γ and (b) transforming growth factor (TGF)‐β cytokines in supernatant from the splenocyte culture were quantified [T vehicle: vehicle (V), fed with soy oil and tumour (T) inoculated; T‐GT3: fed with γ‐T3 (GT3) and tumour (T) inoculated]. #p < 0.05 compared against baseline (day 0) and *p < 0.05 compared against tumour vehicle
Histopathological assessment
Breast tumour tissue excised from tumour‐induced mice from both tumour‐induced groups (T vehicle or T‐GT3) was graded as poorly differentiated carcinoma (Figure 4a). An increased hyperchromatic nucleus with pleomorphic features was observed in the tumour tissue sections excised from both groups. It was noted that four of six animals showed increased necrosis in tumour tissue from the γT3‐treated groups compared to the vehicle group. The percentage of metastasis observed in the lung sections taken from the T vehicle group was 66.7 % on day 49 compared to T‐GT3, which has reduced levels 16.7% (1/6) (Figure 4b). The liver sections from T vehicle mice showed malignant cells and the incidence of metastasis on day 49 was 50% (3/6) whereas, in the T‐GT3 mice, there were no signs of metastasis observed in the liver tissue (Table 2).
FIGURE 4.
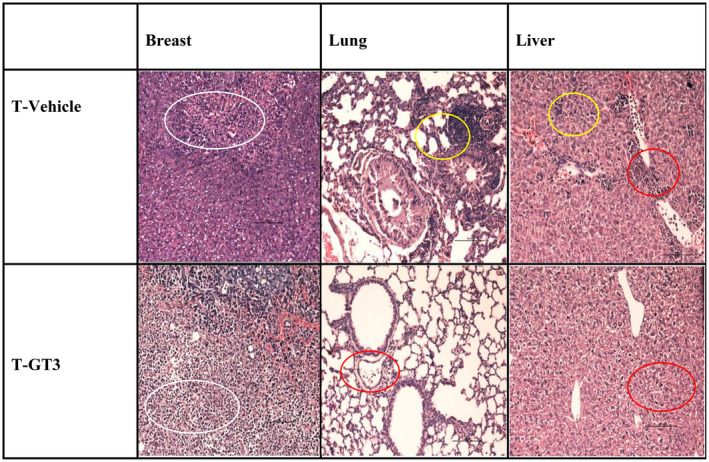
Photomicrograph images of haematoxylin and eosin (H&E) (×200) represents H&E‐stained tissue sections of a breast tumour (white circle refers to area of necrosis), lung and liver (yellow circles refer to metastatic deposits and red circles refer to inflammatory exudates) collected on day 49 from the animals at autopsy
TABLE 2.
Kruskal–Wallis test of lung and liver metastasis between vehicle or gamma‐tocotrienols animals induced with breast cancer
| Groups | Mouse | Breast tumour differentiation | Metastasis | |
|---|---|---|---|---|
| Lung | Liver | |||
| T vehicle | 1 | Poorly differentiated | + | + |
| 2 | Poorly differentiated | + | + | |
| 3 | Poorly differentiated | + | − | |
| 4 | Poorly differentiated | + | + | |
| 5 | Moderately differentiated | − | − | |
| 6 | Moderately differentiated | − | − | |
| T‐GT3 | 1 | Moderately differentiated | − | − |
| 2 | Necrosis | − | − | |
| 3 | Necrosis | − | − | |
| 4 | Necrosis | − | − | |
| 5 | Necrosis | − | − | |
| 6 | Moderately differentiated | + | − | |
The metastasis deposits in the lung and liver of vehicle (T vehicle) or gamma‐tocotrienol (T‐GT3) fed mice were compared.
+ = Metastatic deposits were present; − = metastatic deposits were absent.
Immunohistochemistry findings
There was a strong expression of CD4+ cells in the tumour tissue taken from mice from the T‐GT3 group compared to the T vehicle group (Figure 5a). In contrast, there were more FoxP3+ cells in the tumour tissue sections taken from the T vehicle group compared to the T‐GT3 group, which exhibited moderate expression (Figure 5a). Strong expression of IL‐12Rβ2+ (Figure 5a) and IL‐24+ (Figure 5a) cells were noted in the tumour tissue sections from the γT3‐supplemented (T‐GT3) group compared to the vehicle (T vehicle) group. The staining intensity observed with antibodies to four [4] cell surface markers is shown in Figure 5a.
FIGURE 5.
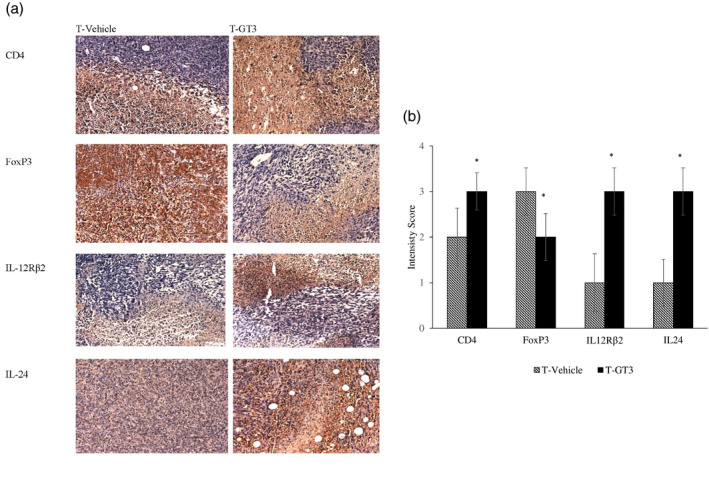
(a) The photomicrograph images (×200) represent histology sections of breast tumour tissue excised from tumour vehicle (T vehicle) and tumour γT3 (T‐GT3) groups on day 49 and stained with immunohistochemistry antibodies CD4, forkhead box protein 3 (FoxP3), interleukin (IL)‐12Rβ2 and IL‐24. (b) Immunohistochemistry score was obtained using a semi‐quantitative method (Allred scoring system) representing staining intensity and percentage of cells expressing the markers in the T vehicle and T‐GT3 groups. The results were expressed with an immunohistochemistry (IHC) score of (0 = negative, 1 = weak, 2 = moderate and 3 = strong) and percentage ± standard deviation (SD) of six mice per group and *p < 0.05 against vehicle group
Gene expression studies
The gene expression pattern in splenic CD4+ T cells isolated from mice in the tumour‐induced group treated with γT3 or soy oil were compared. The data (Table 3) showed that 19 genes were down‐regulated in the γT3‐fed group compared against tumour‐induced mice (T vehicle). Further, gene network String analysis performed with high confidence and k‐mean clustering showed seven (Jak1, Maf, Stat1, Socs1, Tlr4, Tlr6 and IL18) genes that were strongly interconnected. These genes were mainly involved in regulating the immune system and T helper cell differentiation based on functional enrichment analysis (Figure 6).
TABLE 3.
Differential expression of genes in splenic CD4+ T cells
| Accession number | Gene name | Gene symbol | a Fold change (p < 0.05) |
|---|---|---|---|
| NM_011330 | Chemokine (C‐C motif) ligand 7 | CCL7 | −4.59 |
| NM_010278 | Growth factor independent 1 | GFI1 | −12.16 |
| NM_175606 | HOP homeobox | HOPX | −26.04 |
| NM_030691 | Immunoglobulin superfamily member 6 | IGSF6 | −10.39 |
| NM_054039 | Interleukin‐18 | IL18 | −10.77 |
| NM_010555 | Interleukin‐1 receptor, type II | IL1R2 | −35.76 |
| NM_010743 | Interleukin‐1 receptor, type I | IL1RL1 | −18.62 |
| NM_146145 | Janus kinase 1 | JAK1 | −5.08 |
| NM_001025577 | Avian musculoaponeurotic fibrosarcoma (v‐MAF) AS42 oncogene homologue | MAF | −4.80 |
| NM_010848 | Myeloblastosis oncogene | MYB | −23.65 |
| NM_010900 | Nuclear factor of activated T cells, cytoplasmic, calcineurin‐dependent 2 interacting protein | NFATC2IP | −8.56 |
| NM_009044 | Reticuloendotheliosis oncogene | REL | −6.23 |
| NM_009821 | Runt‐related transcription factor 1 | RUNX1 | −5.94 |
| NM_009896 | Suppressor of cytokine signalling 1 | SOCS1 | −7.57 |
| NM_009283 | Signal transducer and activator of transcription 1 | STAT1 | −6.05 |
| NM_009372 | TGF‐β‐induced factor homeobox 1 | TGIF1 | −3.22 |
| NM_021297 | Toll‐like receptor 4 | TLR4 | −17.21 |
| NM_011604 | Toll‐like receptor 6 | TLR6 | −8.69 |
| NM_011910 | Urotensin 2 | UTS2 | −3.51 |
Abbreviations: HOP, homeodomain‐only protein; TGF‐β, transforming growth factor‐beta.
Fold change in splenic CD4+ T cells isolated from tumour‐induced mice fed with gamma‐tocotrienol compared to mice fed with vehicle.
FIGURE 6.
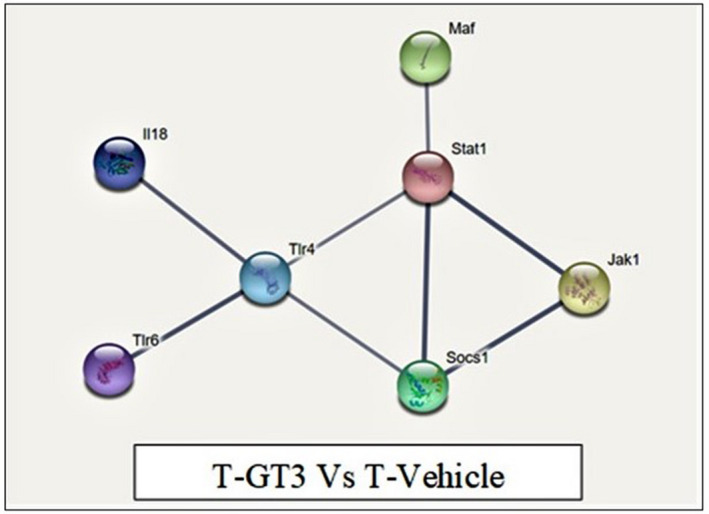
Gene network of mouse T helper differentiation genes using String Consortium 2019 software. Protein–protein interaction of dysregulated proteins network formed with 19 proteins. The line colour represents evidence‐based interaction. The coloured nodes represent down‐regulated genes in the GT3 tumour group
DISCUSSION
The 70% of tocotrienols derived from crude palm oil consist of isomers such as α, γ and δ. Previously, palm tocotrienol was reported for its excellent anti‐oxidant, anti‐cancer and anti‐angiogenic activities. In this study, the individual isomer of tocotrienols, mainly γT3, was investigated for its immune‐enhancing property, contributing to anti‐cancer activity. The role of γT3 as an anti‐tumour agent was significantly proved in this study when the reduction in tumour weight and volume were observed in γT3‐fed tumour mice. We also showed that γT3 supplementation successfully ameliorated tumour progression in the distant organs by reducing metastasis to the lungs and liver. A previous study also showed a reduction in tumour and metastatic deposits by TRF [24]. Also, an increase of necrosis in the tumour tissue was noted in mice fed γT3, which could be related to the anti‐angiogenic activity of γT3. A study has reported that abundant necrosis in cancer cells was due to insufficient blood supply in the central portion of the tumour [30] which then correlates with tumour growth inhibition and anti‐angiogenic activity, as reported in palm tocotrienol [24]. It was also noted that γT3 supplementation in the control mice group exhibits no evidence of toxicity and retained normal histology of the organs.
Both CD4+ and CD8+ T cells have been reported to have a crucial role in activating an immune response to combat cancer progression [31]. The NK cell was responsible for triggering cytolytic activity in the presence of tumour cells that lack major histocompatibility complex (MHC) proteins [32]. Our study showed that supplementation of γT3 in tumour mice promotes a good immune response by activating cytotoxic activity against tumour cells and producing increased CD4+, CD8+ and NK cell populations. In this study, folate receptor 4 (FR4), a marker for Treg cell population [33] was reduced in tumour mice upon supplementation of γT3, indicating that the suppression of the Treg population regulates cell‐mediated immune responses against tumour. It was noted that mice fed with γT3 before challenge with tumour inoculation had improved T cell populations, suggesting the γT3 role to regulate host immune response to combat cancer progression.
IFN‐γ is a signature cytokine for Th1 cells and has a primordial role in tumour rejection [34] whereby TGF‐β and Treg are associated with the tumour‐promoting process [35]. Supplementation of γT3 in tumour‐induced mice showed increased production of IFN‐γ and decreased production of TGF‐β, which may indicate that γT3 supplementation could mediate the Th1 immune response by enhancing the production of IFN‐γ and suppress the Treg population to restrict tumour progression.
Immunohistochemistry analysis showed strong CD4 expression and moderate FoxP3 antibody expression in the mice supplemented with γT3. In contrast, tumour vehicle mice exhibit high FoxP3 expression related to Treg cell accumulation and lead to poor cancer prognosis [36], and this could indicate γT3‐enhanced differentiation of CD4+ T cells into T helper subsets but limits Treg population in tumour tissues. Strong expression of IL‐24 noted in γT3‐fed mice linked to the previous finding that tocotrienol exerts anti‐cancer effects by increasing expression of IL‐24 [37]. Also, high expression of IL‐12Rβ2 suggests accumulation of Th1 cells in the tumour microenvironment, whereby binding of IL‐12 to IL‐12Rβ2 receptor can promote anti‐tumour effects by regulating Th1 immune responses to produce more IFN‐γ [38]. These findings show that γT3 could enhance Th1 immune response in the tumour microenvironment and suppress the Treg cell population, favouring restricting breast cancer progression.
Gamma‐T3 modulated the splenic CD4 T cell in tumour‐induced mice, and the molecular mechanism modulating the immune response in the tumour microenvironment was investigated. We have shown that 19 genes were down‐regulated upon administration of γT3. These genes have been known to have an influential role in regulating the immune system process, T cell activation and T helper differentiation. For the first time, to our knowledge, we have shown that γT3 can regulate the tumour microenvironment’s immune response by activating T cells and suppressing the Treg population.
We have demonstrated that JAK1, STAT1, SOCS1 and MAF genes were interconnected, and down‐regulation of these genes by γT3 was important in inhibiting tumorigenesis. It was reported that the intracellular signalling cascade was activated by the tyrosine Janus kinase (JAK) family upon cytokine exposure activates signal transducers and activators of transcription (STAT) [39]. Followed by this, STAT stimulates transcription of cytokine‐inducible genes, which was regulated by suppressors of the cytokine signalling (SOCS) protein family [39]. JAK1 strongly associated with IFN‐γ, which is the major cytokine secreted by NK cells and has a significant role in promoting tumour immunity in malignant cells. A study showed that silencing JAK1/2 gene expression and reduced expression of STAT1 contributes to enhanced NK cell activity in killing tumour cells [40]. Our results showed that γT3, as an immune enhancer, reduced JAK1 and STAT1 expression by expressing IFN‐γ and promote Th 1 immunity in the tumour microenvironment, which suggest that γT3 may alter or inhibit the JAK–STAT pathway in the tumour.
Further, SOCS1, known as a potent inhibitor of the JAK–STAT signalling pathway, was highly expressed in breast cancer progression [41], which shows γT3’s ability to reduce SOCS1 expression by controlling tumour progression. MAF is a proto‐oncogene expressed on monocytes and macrophages and is a critical transcription factor for IL‐10 [42]. It is learnt that the MAF gene is highly expressed in tumour and γT3 supplementation reduced MAF expression by dampening breast cancer progression.
We also identified that another cluster of genes modulated by γT3 were IL18, TLR4 and TLR6. IL‐18 is a proinflammatory cytokine that mediates Th1 immune response and has a significant role in inducing IFN‐γ in the presence of IL‐12 [43]. A study reported that IL‐18 has a similar structure to IL‐1, and its receptor classified under the superfamily IL‐1R/Toll‐like receptor (TLR). Although IL‐18 reported as a tumour suppressor, over‐expression of IL‐18 leads to chronic inflammatory conditions. IL‐18 plays a prominent role in malignant tumours, particularly breast cancer, whereby high IL‐18 trigger tumour progression and leads to a poor prognosis [44]. It was seen that γT3 decreased IL‐18 over‐expression by inducing IFN‐γ and regulated Th1 immune response to inhibit tumour progression. TLRs belong to the pattern recognition receptor (PRR) family and mediates innate anti‐microbial immunity by activating the NF‐κB pathway and inflammatory cytokine productions [45]. Microbial infection is detected by TLR proteins leading to dendritic cell maturation that triggers antigen‐specific adaptive immune responses, which will induce T cell differentiation into the Th1 subset [46]. However, both TLR‐4 and TLR‐6 were identified as tumour promoters that initiate immune suppression by increasing IL‐10 and TGF‐β [47]. A study reported that reduced TLR‐4 suppresses proliferation of the human breast cancer cell line [48]. These findings suggest that γT3 reduced the expression of TLR proteins in the tumour microenvironment by triggering recruitment of T and NK cell and resulted in tumour suppression.
CONCLUSION
In conclusion, γT3 supplementation showed anti‐tumour and immune‐modulatory activities by increasing the Th population in immunocompetent mice. The ability of γT3 to act as an immune‐enhancing agent was shown to contribute to anti‐tumour effects. The molecular mechanism has shown that γT3 modulates the immune response pathway mainly via a T helper‐dependent immune mechanism by expressing Th1 immunity to combat breast cancer. Hence, γT3 should be evaluated further as a potential immunotherapeutic agent to treat and prevent breast cancer.
ETHICS STATEMENT
The Joint Committee approved all experimental procedures involving animals for Research and Ethics of the International Medical University (IMU) (IMU‐R060‐2010). The study complied with the Animal Ethics Guidelines of the IMU.
CONFLICTS OF INTEREST
The authors declare no conflicts of interest.
AUTHOR CONTRIBUTIONS
S.S. was the PhD student working on this project performed did the animal and laboratory work and drafted the manuscript; J.S.A.R. helped with the animal work; P.R. helped with the gene expression and data analysis and critically reviewed the manuscript; M.H.N. extracted and purified the γT3; K.S.R. co‐supervised the PhD candidate and critically reviewed the manuscript; M.K.K. read the histopathology and immunohistochemistry slides; A.K.R. was the principal investigator who developed the research idea and plan as well as supervised the PhD candidate, reviewed and revised the manuscript.
Supporting information
Supplementary Material
ACKNOWLEDGEMENTS
This work was supported by research grants from the Malaysian Palm Oil Board (MPOB) [PD167] and Ministry of Higher Education, Malaysia (FRGS/1/2013/SG05/IMU/01/1). All the laboratory work carried out at International Medical University (IMU). The authors would like to thank the International Medical University for providing the research facilities to carry out this study.
Subramaniam S, Anandha Rao JS, Ramdas P, Ng MN, Kannan Kutty M, Selvaduray KR, et al. Reduced infiltration of regulatory T cells in tumours from mice fed daily with gamma‐tocotrienol supplementation. Clin Exp Immunol. 2021;206:161–172. 10.1111/cei.13650
DATA AVAILABILITY STATEMENT
The raw data and material used to write this manuscript can be made available from the authors if necessary.
REFERENCES
- 1. Hoebe K, Janssen E, Beutler B. The interface between innate and adaptive immunity. Nat Immunol. 2004;5:971–4. [DOI] [PubMed] [Google Scholar]
- 2. Drake CG, Jaffee E, Pardoll DM. Mechanisms of immune evasion by tumors. Adv Immunol. 2006;90:51–81. [DOI] [PubMed] [Google Scholar]
- 3. Szabo SJ, Sullivan BM, Stemmann C, Satoskar AR, Sleckman BP, Glimcher LH. Distinct effects of T‐bet in TH1 lineage commitment and IFN‐γ production in CD4 and CD8 T cells. Science. 2002;295:338–42. [DOI] [PubMed] [Google Scholar]
- 4. Tanaka H, Demeure CE, Rubio M, Delespesse G, Sarfati M. Human monocyte–derived dendritic cells induce naive T cell differentiation into T helper cell type 2 (Th2) or Th1/Th2 effectors: role of stimulator/responder ratio. J Exp Med. 2000;192:405–12. [DOI] [PMC free article] [PubMed] [Google Scholar]
- 5. Weaver CT, Harrington LE, Mangan PR, Gavrieli M, Murphy KM. Th17: an effector CD4 T cell lineage with regulatory T cell ties. Immunity. 2006;24:677–88. [DOI] [PubMed] [Google Scholar]
- 6. Hu YU, Li H, Zhang L, Shan B, Xu X, Li H, et al. Elevated profiles of Th22 cells and correlations with Th17 cells in patients with immune thrombocytopenia. Hum Immunol. 2012;73:629–35. [DOI] [PubMed] [Google Scholar]
- 7. Zhu J, Paul WE. CD4 T cells: fates, functions, and faults. Blood J Am Soc Hematol. 2008;112:1557–69. [DOI] [PMC free article] [PubMed] [Google Scholar]
- 8. Beyer M, Schultze JL. Regulatory T cells in cancer. Blood. 2006;108:804–11. [DOI] [PubMed] [Google Scholar]
- 9. Carreras J, Lopez‐Guillermo A, Fox BC, Colomo L, Martinez A, Roncador G, et al. High numbers of tumor‐infiltrating FOXP3‐positive regulatory T cells are associated with improved overall survival in follicular lymphoma. Blood. 2006;108:2957–64. [DOI] [PubMed] [Google Scholar]
- 10. Banerjee A, Vasanthakumar A, Grigoriadis G. Modulating T regulatory cells in cancer: how close are we? Immunol Cell Biol. 2013;91:340–9. [DOI] [PubMed] [Google Scholar]
- 11. Ohkura N, Kitagawa Y, Sakaguchi S. Development and maintenance of regulatory T cells. Immunity. 2013;38:414–23. [DOI] [PubMed] [Google Scholar]
- 12. Whiteside TL. What are regulatory T cells (Treg) regulating in cancer and why? Semin Cancer Biol 2012;22:327–34. [DOI] [PMC free article] [PubMed] [Google Scholar]
- 13. Sundram K, Sambanthamurthi R, Tan YA. Palm fruit chemistry and nutrition. Asia Pacific J Clin Nutr. 2003;12:355–62. [PubMed] [Google Scholar]
- 14. Packer L, Weber SU, Rimbach G. Molecular aspects of α‐tocotrienol antioxidant action and cell signalling. J Nutr. 2001;131:369S–73S. [DOI] [PubMed] [Google Scholar]
- 15. Frank J, Chin XW, Schrader C, Eckert GP, Rimbach G. Do tocotrienols have potential as neuroprotective dietary factors? Ageing Res Rev. 2012;11:163–80. [DOI] [PubMed] [Google Scholar]
- 16. Wong WY, Poudyal H, Ward LC, Brown L. Tocotrienols reverse cardiovascular, metabolic and liver changes in high carbohydrate, high fat diet‐fed rats. Nutrients. 2012;4:1527–41. [DOI] [PMC free article] [PubMed] [Google Scholar]
- 17. Das S, Nesaretnam K, Das DK. Tocotrienols in cardioprotection. Vitam Horm. 2007;1:285–99. [DOI] [PubMed] [Google Scholar]
- 18. Loganathan R, Selvaduray KR, Nesaretnam K, Radhakrishnan AK. Tocotrienols promote apoptosis in human breast cancer cells by inducing poly (ADP‐ribose) polymerase cleavage and inhibiting nuclear factor kappa‐B activity. Cell Prolif. 2013;46:203–13. [DOI] [PMC free article] [PubMed] [Google Scholar]
- 19. Nesaretnam K, Ambra R, Selvaduray KR, Radhakrishnan A, Canali R, Virgili F. Tocotrienol‐rich fraction from palm oil and gene expression in human breast cancer cells. Ann NY Acad Sci. 2004;1031:143–57. [DOI] [PubMed] [Google Scholar]
- 20. Hafid SR, Radhakrishnan AK, Nesaretnam K. Tocotrienols are good adjuvants for developing cancer vaccines. BMC Cancer. 2010;10:1. [DOI] [PMC free article] [PubMed] [Google Scholar]
- 21. Kamat JP, Devasagayam TP. Tocotrienols from palm oil as potent inhibitors of lipid peroxidation and protein oxidation in rat brain mitochondria. Neurosci Lett. 1995;195:179–82. [DOI] [PubMed] [Google Scholar]
- 22. Kulkarni SS, Cary LH, Gambles K, Hauer‐Jensen M, Kumar KS, Ghosh SP. Gamma‐tocotrienol, a radiation prophylaxis agent, induces high levels of granulocyte colony‐stimulating factor. Int Immunopharmacol. 2012;14:495–503. [DOI] [PubMed] [Google Scholar]
- 23. Akl MR, Ayoub NM, Abuasal BS, Kaddoumi A, Sylvester PW. Sesamin synergistically potentiates the anticancer effects of γ‐tocotrienol in mammary cancer cell lines. Fitoterapia. 2013;1:347–59. [DOI] [PubMed] [Google Scholar]
- 24. Selvaduray KR, Radhakrishnan AK, Kutty MK, Nesaretnam K. Palm tocotrienols inhibit proliferation of murine mammary cancer cells and induce expression of interleukin‐24 mRNA. J Interferon Cytokine Res. 2010;30:909–16. [DOI] [PubMed] [Google Scholar]
- 25. Abdul Hafid SR, Chakravarthi S, Nesaretnam K, Radhakrishnan AK. Tocotrienol‐adjuvanted dendritic cells inhibit tumor growth and metastasis: A murine model of breast cancer. PLOS ONE. 2013;8:e74753. [DOI] [PMC free article] [PubMed] [Google Scholar]
- 26. Pulaski BA, Ostrand‐Rosenberg S. Mouse 4T1 breast tumor model. Curr Protoc Immunol. 2000;39:20–2. [DOI] [PubMed] [Google Scholar]
- 27. Sundram K, Gapor A. Vitamin E from palm oil: its extraction and nutritional properties. Lipid Technol. 1992;4:37–41. [Google Scholar]
- 28. Fedchenko N, Reifenrath J. Different approaches for interpretation and reporting of immunohistochemistry analysis results in the bone tissue–a review. Diagn Pathol. 2014;9:1–2. [DOI] [PMC free article] [PubMed] [Google Scholar]
- 29. Schmittgen TD, Livak KJ. Analyzing real‐time PCR data by the comparative CT method. Nat Protoc. 2008;3:1101–8. [DOI] [PubMed] [Google Scholar]
- 30. Balkwill F. Tumour necrosis factor and cancer. Nat Rev Cancer. 2009;9:361–71. [DOI] [PubMed] [Google Scholar]
- 31. Huang Y, Ma C, Zhang Q, Ye J, Wang F, Zhang Y, et al. CD4+ and CD8+ T cells have opposing roles in breast cancer progression and outcome. Oncotarget. 2015;6:17462‐17478. [DOI] [PMC free article] [PubMed] [Google Scholar]
- 32. Vance RE, Kraft JR, Altman JD, Jensen PE, Raulet DH. Mouse CD94/NKG2A is a natural killer cell receptor for the nonclassical major histocompatibility complex (MHC) class I molecule Qa‐1b. J Exp Med. 1998;188:1841–8. [DOI] [PMC free article] [PubMed] [Google Scholar]
- 33. Tian YI, Wu G, Xing J‐C, Tang J, Zhang YI, Huang Z‐M, et al. A novel splice variant of folate receptor 4 predominantly expressed in regulatory T cells. BMC Immunol. 2012;13:1–8. [DOI] [PMC free article] [PubMed] [Google Scholar]
- 34. Dunn GP, Koebel CM, Schreiber RD. Interferons, immunity and cancer immunoediting. Nat Rev Immunol. 2006;6:836–48. [DOI] [PubMed] [Google Scholar]
- 35. Wakefield LM, Hill CS. Beyond TGFβ: roles of other TGFβ superfamily members in cancer. Nat Rev Cancer. 2013;13:328–41. [DOI] [PMC free article] [PubMed] [Google Scholar]
- 36. Takenaka M, Seki N, Toh U, Hattori S, Kawahara A, Yamaguchi T, et al. FOXP3 expression in tumor cells and tumor‐infiltrating lymphocytes is associated with breast cancer prognosis. Mol Clin Oncol. 2013;1:625–32. [DOI] [PMC free article] [PubMed] [Google Scholar]
- 37. Menezes ME, Shen XN, Das SK, Emdad L, Guo C, Yuan F, et al. MDA‐7/IL‐24 functions as a tumor suppressor gene in vivo in transgenic mouse models of breast cancer. Oncotarget. 2015;6:36928. [DOI] [PMC free article] [PubMed] [Google Scholar]
- 38. Lasek W, Zagożdżon R, Jakobisiak M. Interleukin 12: still a promising candidate for tumor immunotherapy? Cancer Immunol Immunother. 2014;63:419–35. [DOI] [PMC free article] [PubMed] [Google Scholar]
- 39. Liau NP, Laktyushin A, Lucet IS, Murphy JM, Yao S, Whitlock E, et al. The molecular basis of JAK/STAT inhibition by SOCS1. Nat Commun. 2018;9:1–4. [DOI] [PMC free article] [PubMed] [Google Scholar]
- 40. Bellucci R, Martin A, Bommarito D, Wang K, Hansen SH, Freeman GJ, et al. Interferon‐γ‐induced activation of JAK1 and JAK2 suppresses tumor cell susceptibility to NK cells through upregulation of PD‐L1 expression. Oncoimmunology. 2015;4:e1008824. [DOI] [PMC free article] [PubMed] [Google Scholar]
- 41. Raccurt M, Tam SP, Lau P, Mertani HC, Lambert A, Garcia‐Caballero T, et al. Suppressor of cytokine signalling gene expression is elevated in breast carcinoma. Br J Cancer. 2003;89:524–32. [DOI] [PMC free article] [PubMed] [Google Scholar]
- 42. Cao S, Liu J, Song L, Ma X. The protooncogene c‐Maf is an essential transcription factor for IL‐10 gene expression in macrophages. J Immunol. 2005;174:3484–92. [DOI] [PMC free article] [PubMed] [Google Scholar]
- 43. Dinarello CA. Interleukin‐18, a proinflammatory cytokine. Eur Cytokine Netw. 2000;11:483–6. [PubMed] [Google Scholar]
- 44. Merendino RA, Gangemi S, Ruello A, Bene A, Losi E, Lonbardo G, et al. Serum levels of interleukin‐18 and sICAM‐1 in patients affected by breast cancer: preliminary considerations. Int J Biol Mark. 2001;16:126–9. [DOI] [PubMed] [Google Scholar]
- 45. Kumar H, Kawai T, Akira S. Toll‐like receptors and innate immunity. Biochem Biophys Res Commun. 2009;388:621–5. [DOI] [PubMed] [Google Scholar]
- 46. Schnare M, Barton GM, Holt AC, Takeda K, Akira S, Medzhitov R. Toll‐like receptors control activation of adaptive immune responses. Nat Immunol. 2001;2:947–50. [DOI] [PubMed] [Google Scholar]
- 47. Li C, Li H, Jiang K, Li J, Gai X. TLR4 signaling pathway in mouse Lewis lung cancer cells promotes the expression of TGF‐β1 and IL‐10 and tumor cells migration. Bio‐Med Mater Eng. 2014;24:869–75. [DOI] [PubMed] [Google Scholar]
- 48. Yang H, Zhou H, Feng P, Zhou X, Wen H, Xie X, et al. Reduced expression of Toll‐like receptor 4 inhibits human breast cancer cells proliferation and inflammatory cytokines secretion. J Exp Clin Cancer Res. 2010;29:1–8. [DOI] [PMC free article] [PubMed] [Google Scholar]
Associated Data
This section collects any data citations, data availability statements, or supplementary materials included in this article.
Supplementary Materials
Supplementary Material
Data Availability Statement
The raw data and material used to write this manuscript can be made available from the authors if necessary.