

Abstract
Mechanisms that regulate metabolites and downstream energy generation are key determinants of T cell cytokine production, but the processes underlying the Th17 profile that predicts the metabolic status of people with obesity are untested. Th17 function requires fatty acid uptake, and our new data show that blockade of CPT1A inhibits Th17-associated cytokine production by cells from people with type 2 diabetes (T2D). A low CACT:CPT1A ratio in immune cells from T2D subjects indicates altered mitochondrial function and coincides with the preference of these cells to generate ATP through glycolysis rather than fatty acid oxidation. However, glycolysis was not critical for Th17 cytokines. Instead, β oxidation blockade or CACT knockdown in T cells to mimic characteristics of T2D promotes cells from lean subjects to utilize 16C-fatty acylcarnitine to support a Th17 cytokines. These data show long chain acylcarnitine combines with compromised β oxidation to promote disease-predictive inflammation in human T2D.
eTOC blurb
Although glycolysis generally fuels inflammation, Nicholas, Proctor and Agrawal et al. report that PBMCs from subjects with type 2 diabetes use a different mechanism to support chronic inflammation largely independent of fuel utilization. Loss- and gain-of-function experiments in cells from healthy subjects show mitochondrial alterations combine with increases in fatty acid metabolites to drive chronic T2D-like inflammation.
Introduction:
T cells recirculate through key metabolic regulatory tissues in obesity (Lynch et al., 2015; Travers et al., 2015; Wouters et al., 2017), and produce inflammatory cytokines that support insulin resistance and type 2 diabetes (T2D) (Fabbrini et al., 2013; Ip et al., 2016; McLaughlin et al., 2014; Zuniga et al., 2010). CD4+ T cell cytokines contribute to metabolic dysfunction through multiple mechanisms that include lipogenic support and inhibition of both lipid oxidation and IRS-1 phosphorylation (Feingold and Grunfeld, 1987; Grunfeld et al., 1988; Hotamisligil et al., 1996; Jones Iv et al., 2017). We defined a Th17 cytokine profile in people with T2D that dominates systemic T cell inflammation, activates TNFα production, and mathematically predicts T2D in obese people (Ip et al., 2016). This combinatorial profile is consistent with numerous demonstrations that cytokines within the profile, such as IL-17A, are overrepresented in tissues from T2D compared to non-T2D (ND) subjects, and support both insulin resistance and feed-forward inflammatory loops (Fabbrini et al., 2013; Ip et al., 2016; Jagannathan-Bogdan et al., 2011; Pandolfi et al., 2016). Queries of cellular mechanisms underlying the T2D-associated Th17 profile have uncovered the importance of partially understood inputs from other PBMC cell types, especially B cells, as essential for profile maintenance (Defuria et al., 2013; Ip et al., 2016; Jagannathan-Bogdan et al., 2011).
Perturbations of the nutrient milieu in T2D include glucose and lipid overabundance that, coupled with alterations in key T cell metabolic proteins like AMPK and higher circulating lipid metabolites like 16C-acylcarnitine, may alter T cell metabolism and thus function (Blagih et al., 2015; Brand, 1985; Brand et al., 1984; Gauthier et al., 2011; Guasch-Ferre et al., 2018). Such metabolic imbalances drive non-T2D pathologies like encephalomyelitis and lupus through various T cell-associated mechanisms (Delgoffe et al., 2009; Delgoffe et al., 2011; Gerriets et al., 2015; Kim et al., 2013; Xu et al., 2017; Yin et al., 2015), but roles of similar mechanisms in the T2D-associated Th17 profile (Ip et al., 2016) remain poorly understood. Recent work showed that ACC1 and the downstream enzyme fatty acid synthase play critical roles in Th17 development at the expense of Th1 cells in obese mice (Endo et al., 2015), and suggest that lipid flux is important for obesity-associated inflammation in this Th1-dominated model (Winer et al., 2009). How ACC1, AMPK and other T cell lipid regulators function in Th17-dominated inflammation in human T2D is unknown.
We demonstrate herein that activated immune cells and purified CD4+ T cells from T2D compared to ND subjects are strongly biased toward non-mitochondrial glycolytic metabolism, herein designated “glycolysis”, which associates with higher AMPK activation and altered mitochondria as evidenced by a lower CACT:CPT1A ratio. However, glucose starvation to switch T2D cells away from glycolysis and towards alternative fuel sources failed to normalize T cell inflammatory profiles, showing that glycolysis parallels but does not fuel T2D inflammation. Instead, blockade of fatty acid transport and/or β oxidation in PBMCs with etomoxir/trimetazidine or CACT-specific siRNA, alone or in combination with excess 16C fatty acyl carnitine, respectively, promoted Th17 cytokine production independent of glucose metabolism. Furthermore, knockdown of CPT1A ameliorated Th17 cytokine production, indicating that a decrease in the CACT:CPT1A ratio promotes Th17 function. These data demonstrate that an environment rich in long chain fatty acid metabolites induces immune cells with compromised fatty acid oxidation machinery to produce the Th17 cytokines that define inflammation in human T2D. These findings challenge the current dogmas that increases in glycolysis uniquely fuel T cell inflammation, by showing instead that suboptimal fatty acid oxidation independently promotes Th17 activation. Our work refocuses anti-inflammatory clinical trials in T2D towards control of fatty acid metabolism rather than euglycemia.
Results
AMPK and mitochondrial mass are lower in immune cells from T2D compared to non-T2D subjects
AMPK is a master mitochondrial regulator that has relatively low activity under conditions of nutrient excess, such as in the adipose tissue of people with obesity or T2D (Gauthier et al., 2011; Herzig and Shaw, 2018). To test if AMPK is partially inactivated by T2D in blood immune cells, which reflect the immune compartment of adipose tissue due to re-circulation (Lynch et al., 2015; McLaughlin et al., 2014), we quantified pAMPK in PBMCs and CD4+ T cells from equally obese T2D and ND subjects (Table S1). The proportion of activated AMPK was higher in both fresh ex vivo CD4+ T cells and PBMCs from T2D compared to ND subjects (Fig. 1A–C). One possible explanation for more activated AMPK in T2D samples is that only the T2D subjects were clinically prescribed metformin, a glycemic control drug that inhibits complex I to activate AMPK (Cameron et al., 2018). To directly test the ability of metformin to activate AMPK in circulating cells, we quantified pAMPK in CD4+ T cells from pre-diabetes (pre-T2D) subjects (Table S2) who do or do not take metformin as part of their clinical care. AMPK activation was indistinguishable in cells from these cross-sectionally recruited subjects (Fig. 1D). Metformin also failed to impact major AMPK-sensitive metabolic pathways in PBMCs collected before and 3 months after metformin treatment of pre-T2D subjects, as measured by extracellular flux outcomes in a mitochondrial stress test (Fig. S1A–D). We conclude that chronic AMPK activation is not explained by metformin intervention, but instead putatively indicates T2D-associated changes in PBMC and CD4+ T cell mitochondria and/or metabolism.
Figure 1. Metabolic regulators differentiated PBMCs and CD4+ T cells from T2D and non-T2D (ND) subjects.
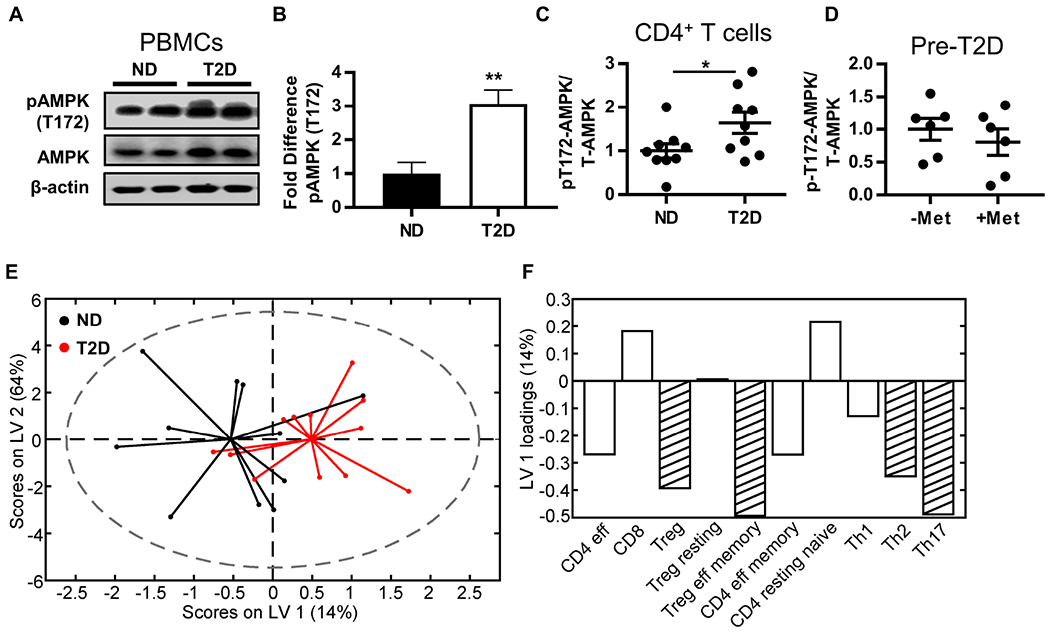
(A,B) Western blot quantification of pAMPK (T172) in resting PBMCs (ND, N=6; T2D, N=5) and (C) resting CD4+ T cells (N=9). (D) Western blot quantification of pAMPK in CD4+ T cells from pre-diabetes (pre-T2D) subjects who did or did not take metformin (1000mg/day). Differences were determined by two-tailed student’s t test with significance accepted at p < 0.05. (E,F) Orthogonalized partial least squares discriminant analysis model of mitochondrial mass measured by mitotracker green in PBMC cell subsets (Fig. S2). (E) Biplot from partial least squares discriminant analysis model shows that mitochondrial mass in PBMC cell populations distinguished ND (black) from T2D (red) PBMCs with 52% cross-validated prediction accuracy (approximately one standard deviation greater than the mean of 100 random models, or 68% confidence). (F) Loadings on latent variable 1 (orthogonalized) indicated lower mitochondrial mass in T2D as compared to ND in most immune cell populations. Stripes highlight cell populations with above average contribution to the difference in mitochondrial mass between T2D and ND as determined by variable importance in projection (VIP) scores > 1. See also Figure S1–S2 and Tables S1–S2.
AMPK regulates mitochondrial dynamics and homeostasis, including biogenesis and fission (Rabinovitch et al., 2017; Toyama et al., 2016), and thereby may regulate T cell bioenergetics and downstream inflammation. To begin determining the effect of chronic AMPK activation on T cell mitochondria in T2D, we used flow cytometry to quantify mitochondrial mass in resting immune cells representing several major subsets (Fig. S2A–D). All immune cell subsets tested were similarly frequent in T2D and ND blood as previously published (van Beek et al., 2014) except CD8+ T cells, which were less frequent in T2D samples (Fig. S2B). Notably, Th17 cells, as identified by chemokine receptors, were similarly frequent in both subject cohorts, extending our previous demonstration that Th17 cells are more abundant in PBMCs from T2D compared to lower BMI/normoglycemic subjects (Jagannathan-Bogdan et al., 2011). Univariate analyses of all major cell subsets indicated no disease-associated difference in mitochondrial mass as indicated by Mitotracker green (Fig. S2C,D), although previously reported outcomes like higher dependence of T cells than B cells on mitochondrial metabolism were reflected by higher mitochondrial mass in CD4+ T cells and higher glucose uptake (as measured by NBDG uptake) by B cells (Fig. S2C–E) (Caro-Maldonado et al., 2014). Because cell-by-cell univariate analysis may underestimate a more physiological/combinatorial effect of T2D on mitochondrial mass, we used partial least squares discriminant analysis to predict whether variation in mitochondrial mass of specific immune cell subsets could differentiate samples from T2D and ND subjects (Lau et al., 2011; Simmons et al., 2013; Wold et al., 2001). Mitochondrial mass in T cells correctly predicted disease state with 68% confidence (~1SD above the mean of random) and was statistically different from random models (Fig. 1E). Loading analyses generated latent variables that ranked the importance of mitochondrial mass in specific T cell subsets for predicting that a blood donor was T2D or ND (not shown). Variable importance in projection (VIP) analysis, which combines the weight of each analyte over all latent variables in the model to assess the importance of each T cell type’s contribution to the disease-associated difference in mitochondrial mass, showed lower mitochondrial mass of Tregs, Th2s, and Th17s as most indicative of T2D status (Fig. 1F, striped bars; negative values indicate the overall mitochondrial mass is lower in T2D samples). Taken together, more pAMPK and less mitochondrial mass in CD4+ but not CD8+ T cells of subjects with T2D suggest that disease-associated changes in key regulators of cellular metabolism may promote T2D inflammation.
Lower mitochondrial mass and AMPK activation coincide with higher glycolysis by immune cells from T2D compared to non-T2D subjects
To test the metabolic consequences of chronic AMPK activation and subset-selective decreases in mitochondrial mass in T2D, we quantified oxygen consumption rate (OCR; which measures mitochondrial respiration) and extracellular acidification rate (ECAR; a proxy for acid production from all sources including lactate from glycolysis) of resting and αCD3/αCD28-stimulated PBMCs from T2D and ND subjects (Table S1) by extracellular flux responses in a mitochondrial stress test. OCR and ECAR were statistically similar in resting cells (Fig. 2A–C). OCR of stimulated PBMCs was also disease-independent (Fig. 2D). More detailed analysis of OCR-derived measures of mitochondrial respiration, including basal O2 consumption, spare respiratory capacity, and proton leak with SHORE software (Nicholas et al., 2017) followed by partial least squares analysis showed that none of these indicators of mitochondrial function preferentially associated with Th17 cytokines (Fig. S3A). In contrast, ECAR was higher in stimulated PBMCs from T2D compared to ND subjects, and corresponded with higher lactate production, a definitive measure of glycolysis (Fig. 2E,F). Ratio analysis by SHORE confirmed that stimulated cells from T2D subjects preferentially used glycolysis, as measured by the post-stimulation OCR:ECAR ratio, ΔOCR, and ΔECAR (Fig. 2G–I). Lower ATP generation by cells from T2D subjects (Fig. 2J,K) was consistent with a preference for glycolysis and compensatory AMPK activation. CD4+ T cells stimulated in the context of PBMCs then purified immediately before a mito stress test did not recapitulate the T2D-associated preference of PBMCs for glycolysis, nor did the remaining T cell-depleted PBMCs, nor did resting CD4+ T cells (Fig. S3B–J). These findings indicate that the excessive glucose characteristic of T2D is not sufficient to cause glycolysis. CD4+ T cells from T2D subjects, purified prior to stimulation, were modestly more glycolytic than T cells from ND subjects, although the OCR:ECAR ratios were indistinguishable (Fig. S3K–M). Metabolic differences in purified compared to PBMC-associated CD4+ T cells mirror results showing that higher Th17 cytokine production in T2D cannot be recapitulated by purified CD4+ T cells alone (Defuria et al., 2013; Ip et al., 2016; Jagannathan-Bogdan et al., 2011), and suggest that immune cell cross-talk is important for T cell metabolism. Thus, despite similar frequencies of CD4+ T cells, the most highly “glycolytic” immune subset (Caro-Maldonado et al., 2014; Jones et al., 2017; Michalek et al., 2011; Procaccini et al., 2016), a natural cell mixture (PBMCs) was required to uncover the preference for glycolysis that associates with T2D. Taken together, the data show that lower mitochondrial mass when analyzed by techniques that define an overall mitochondrial “signature” of T2D or coupled with chronic AMPK activation fails to fuel metabolic demand in cells from T2D subjects. Instead, our findings suggest lower mitochondrial mass in T2D is associated with a preference for glycolysis and thereby may fuel inflammation in T2D.
Figure 2. PBMCs from subjects with T2D preferentially metabolize by glycolysis compared to PBMCs from ND subjects.
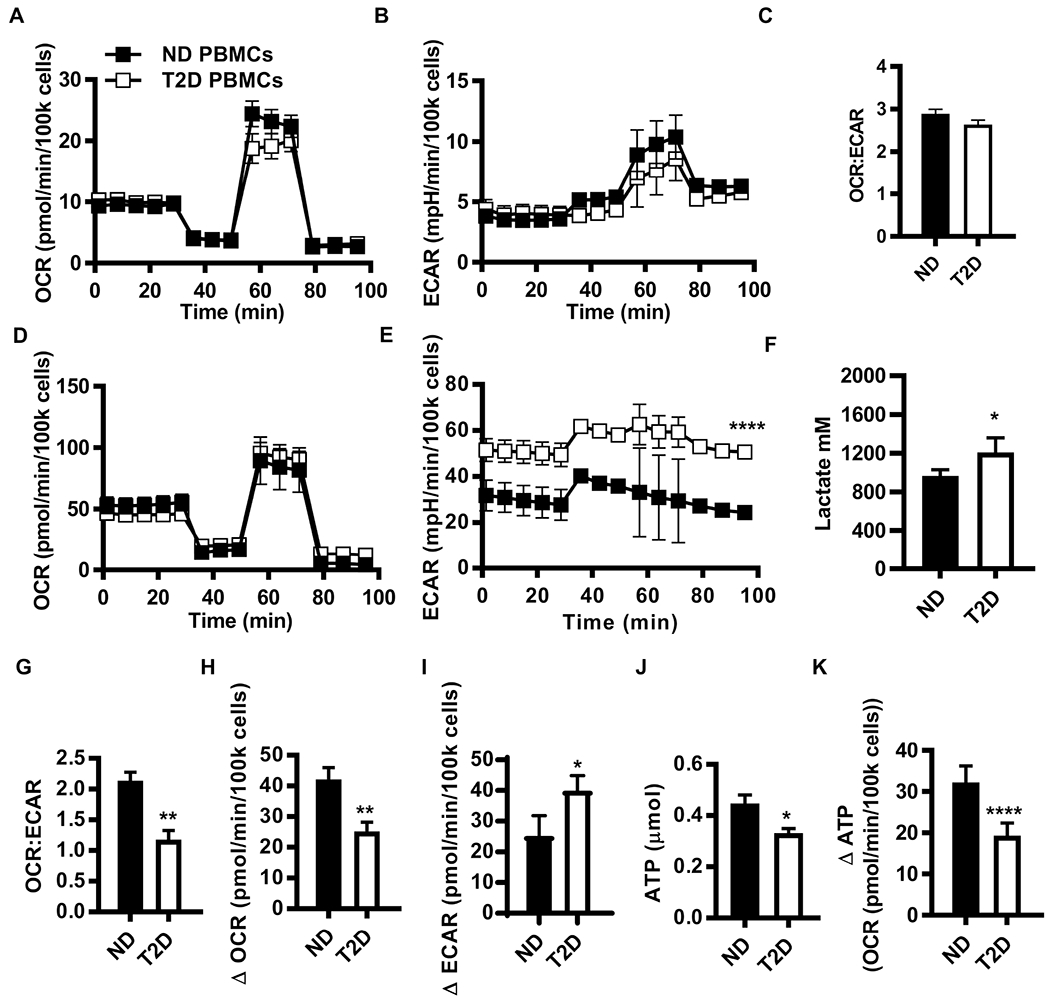
(A) OCR, (B) ECAR, and (C) OCR:ECAR ratio from mito stress test extracellular flux profiles for resting PBMCs from ND (N=17) and T2D (N=12) subjects. (D) OCR and (E) ECAR mito stress test extracellular flux profiles for 40 hr αCD3/αCD28-stimulated PBMCs from ND (N=10) and T2D (N=11) subjects. Differences are determined by repeated measures ANOVA with significance accepted at p < 0.05. (F) Lactate in conditioned media from ND (N=5) and T2D (N=6) PBMCs after 40 hr αCD3/αCD28 stimulation. (G) The OCR:ECAR ratio for 40 hr αCD3/αCD28 stimulated PBMCs. The absolute difference in basal OCR (H) and ECAR (I) between resting PBMCs (A,B) and 40 hr αCD3/αCD28-stimulated PBMCs (ND, N=10; T2D, N=11). (J) Direct measurement of ATP production by bioluminescence in resting ND (N=7) and T2D (N=6) PBMCs. (K) Fold change in ATP production due to 40 hr αCD3/CD28 activation of PBMCs. Differences are determined by two-tailed student’s t test with significance accepted at p < 0.05. See also Fig. S3 and Table S1.
Glucose uniquely decreases anti-inflammatory cytokine production in T2D but does not fuel a Th17 profile
To determine how the T2D-associated increase in glycolysis impacts the T2D-associated Th17 profile, we quantified cytokine production by PBMCs stimulated with αCD3/αCD28 in the presence or absence of glucose and pyruvate. We analyzed outcomes in clustergrams and partial least squares discriminant analyses to identify 1. whether glucose starvation minimizes the difference between T2D and ND cytokine profiles; and 2. whether glucose, and by extension glycolysis, is required for production of the Th17 profile by cells from T2D subjects. Stimulated PBMCs from ND and T2D subjects maintained distinct cytokine profiles in the absence of glucose according to both analytical approaches (Figs. 3A,B), suggesting that glucose is not mandatory for disease-associated differences in T cell function. To directly test the importance of the T2D-associated shift to glycolysis in the Th17 profile, we compared cytokine profiles of stimulated PMBCs (+/− glucose) from ND or T2D subjects in two separate models. Glucose deprivation dramatically changed PBMCs profiles as analyzed within each cohort (Fig. 3C, ND on left, T2D on right; with ~90% confidence that the profiles +/− glucose were different in each model). Loading analyses to rank cytokines based on their importance in the response to glucose deprivation showed cohort-specific outcomes. PBMCs from ND subjects decreased production of most cytokines. Cytokines that the model indicated were most critical for differentiating +/− glucose conditions included 9 cytokines, all of which are generally pro-inflammatory and have decreased production in the absence of glucose (Fig. 3D, left panel, striped bars). In sharp contrast, 5 of 8 cytokines that were most important for differentiating +/− glucose conditions for PBMCs of T2D subjects increased with glucose deprivation (Fig. 3D, striped bars, right panel), and included multiple cytokines with generally anti-inflammatory functions (IL-13, IL-22, IL-9, IL-5), with TNFα as the lone pro-inflammatory cytokine that increased. Changes in cytokine profiles were not due to compromised cell viability, or impaired Glut4 expression in response to glucose deprivation (Fig. S4A,B). We conclude that glycolytic preference by PBMCs from T2D subjects does not activate the T2D-associated Th17 profile, and instead may suppress anti-inflammatory cytokine production that may indirectly regulate the Th17 profile.
Figure 3. Glucose uniquely decreased anti-inflammatory cytokine production in T2D.

PBMCs were stimulated with αCD3/αCD28 in media +/− glucose and pyruvate for 40 hr. The conditioned media was assayed for cytokine concentration by multiplex. (A) Heat map indicated cytokine secretion under glucose deprivation conditions. Control-subtracted cytokine concentrations were mean-centered and variance-scaled. Color bar represents Z-score. (B) Orthogonalized partial least squares discriminant analysis model distinguished cytokine profiles from ND (black) from T2D (red) cells under glucose deprivation conditions with 72% cross-validated prediction accuracy (greater than one standard deviation from the mean of 100 random models, or 71% confidence). (C) Orthogonalized partial least squares discriminant analysis model discriminated cytokine profiles produced by PBMCs from (left) ND subjects stimulated under glucose deprivation (red) or control (black) conditions with 90% cross-validated prediction accuracy (greater than one standard deviation from the mean of 100 random models, or 89% confidence), or (right) PBMCs from T2D with 73% prediction accuracy (greater than one standard deviation from the mean of 100 random models, or 90% confidence). (D) Loadings on latent variable 1 (orthogonalized) for ND (left) and T2D (right) models in panel C. Bars below midline show decreased cytokine production under 0 compared to 11 mM glucose media. Bars above midline show higher cytokine production under 0 compared to 11 mM glucose media. Cytokines with above average contribution to differences between control and glucose deprivation profiles as determined by variable importance in projection (VIP) score > 1 are striped. See also Figure S4 and S5.
One possible explanation for different responses to glucose deprivation by T2D and ND cells was a difference in the ability to utilize other nutrients downstream of AMPK activation (Chaube and Bhat, 2016), which in turn may regulate the Th17 profile. However, glucose/fatty acid/glutamate dependency, capacity and flexibility (Agilent Technologies, 2017) of PBMCs from ND and T2D subjects were similar (Fig. S5A,B). Analysis of basal OCR in the presence of select carbon sources revealed that PBMCs from T2D subjects prefer to oxidize glucose and free fatty acid (oleic acid) over glutamate, and that both oleic acid and glucose increased OCR over glutamate alone. PBMCs from ND subjects show no such preference (Fig. S5C). Finally, glucose deprivation during culture then extended throughout the mito stress test run indicated other fuels more effectively compensated for glucose in PBMCs from ND compared to T2D subjects (Fig. S5D). Taken together, these data indicate that despite an ability to oxidize all three fuels tested, PBMCs from T2D subjects have lowest preference for glutamine, with graded preference for glycolysis over fatty acid oxidation.
Regulators of lipid flux are broadly altered in immune cells from T2D subjects
Our data suggest that fuel inflexibility along with a preference for glycolysis are unlikely to activate the T2D-associated Th17 profile, but instead raise the possibility that fatty acids may fuel T2D inflammation. To begin testing this possibility, we stimulated PBMCs with αCD3/αCD28 and quantified gene expression on an RNA array. Most genes expressed by T2D PBMCs stimulated under standard culture conditions (11mM glucose, similar to hyperglycemia in T2D) were expressed at 0.5-2x the levels expressed by ND PBMCs (Fig. 4A, filled circles), but multiple lipid metabolism genes with seemingly opposite roles in lipolysis and lipogenesis were >10 fold more highly expressed in T2D relative to ND PBMCs under 0mM glucose/0mM pyruvate culture conditions (Fig. 4A open circles, Table S3). A subset of the results were confirmed by qRT-PCR and Western blots (Table S4, Figs. 4B,C). Notably, higher ACC1 in resting PBMCs from T2D subjects (Fig. 4C) is consistent with demonstrations that ACC1 is critical for obesity-associated Th17 differentiation (Endo et al., 2015), but contradicts the role of AMPK as an ACC1 inhibitor established in cells from healthy individuals (Carling et al., 1987). Paradoxical differences in lipolysis/lipogenesis modulators suggest global dysregulation of lipid flux in PBMCs from T2D compared to ND subjects, despite demonstrations that total neutral lipid is similar in PBMCs from T2D and ND subjects (Fig. S5E).
Figure 4. Lipid metabolism distinguished T2D PBMCs from ND PBMCs.
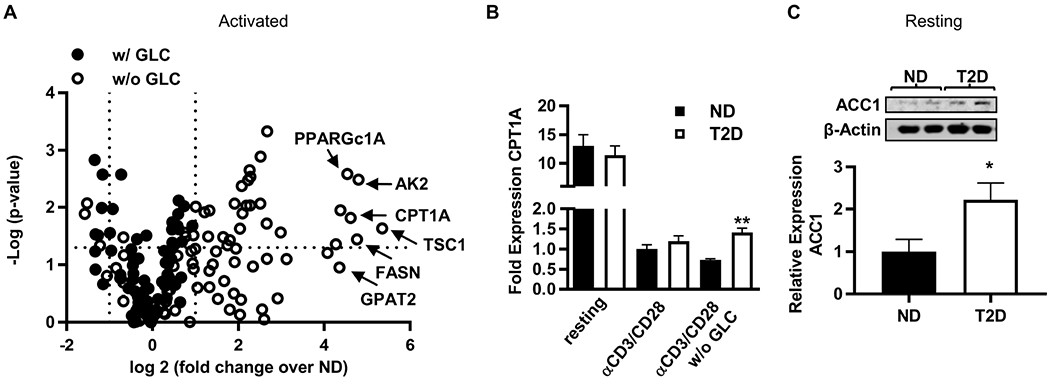
(A) Volcano plot demonstrating the fold change of mRNA expression from T2D PBMCs (N=4) relative to ND PBMCs (N=4) stimulated with αCD3/αCD28 for 40 hr with (filled circles) or without (open circles) glucose/pyruvate (GLC). (B) Fold change in CPT1A mRNA from 40 hr cultured PBMCs (N=4; conditions as indicated) quantified by qRT-PCR. (C) Western blot quantification of ACC1 in resting PBMCs (ND, N=6; T2D, N=5). Differences were determined by two-tailed student’s t test with significance accepted at p < 0.05. Panels B and C show mean +/− SEM. See also Figure S5 and Tables S3,S4.
Experimental mitochondrial perturbation implicates fatty acid metabolism in the T2D-predictive Th17 cytokine profile
To test whether PBMCs from T2D compared to ND subjects have altered lipid flux, we assayed cellular metabolism of PBMCs stimulated with αCD3/αCD28 in 0mM glucose +/− 3-100μM etomoxir. One action of etomoxir is to inhibit CPT1A, an outer mitochondrial membrane protein and a critical regulator of the carnitine-acyl carnitine cycle that is increased in response to AMPK activation (Kemmerer et al., 2015). One hundred μM etomoxir did not differentiate OCR of cells based on disease status (Fig. 5A), indicating that glucose fueled oxidative phosphorylation following blockade of long chain fatty acid import in cells from both types of subjects. In contrast, 100μM etomoxir increased ECAR of PBMCs from ND but not T2D subjects (Fig. 5B,C). These data support the conclusion that CPT1A inactivation shifts metabolism to glycolysis in ND cells, but has no impact on cells from T2D subjects, due at least in part to their preference for glycolysis over β oxidation. To further test the impact of etomoxir on cells from T2D subjects, we assayed cytokine secretion. Initial analysis by clustergram did not group samples based on disease or etomoxir presence/absence (Fig. 5D). In contrast, analysis of cytokine profiles by partial least squares discriminant analysis predicted the presence/absence of 3-100μM etomoxir during stimulation, and the possible importance of etomoxir-sensitive CPT1A-transported CoA derivatives in cytokine production, irrespective of disease status (Fig. 5E shows models with outcomes from both ND and T2D cells). The effect of etomoxir was sufficiently dominant that it masked known cytokine profile differences between ND and T2D cells in a four-group model (ND +/− etomoxir, T2D +/− etomoxir; not shown). Most notably, numerous cytokines decreased by stimulation in the presence of etomoxir at all concentrations associate with Th17 cells, including IL-17F, GM-CSF, and IL-23. MIP3α and IL-17A were modestly decreased only at higher etomoxir concentrations (Fig. 5F, red bars). Cytokines produced or supportive of Th17 cells were among the most important (VIP) cytokines for differentiating etomoxir-treated from non-treated samples, although cytokines characteristic of Th1s (TNFα, IFNγ) and Th2s (IL-4) were VIP in some models (Fig. 5F, striped bars). A blended model that combined cytokine responses to all concentrations of etomoxir (Fig. S6A) confirmed that CPT1A blockade lowered Th17-associated cytokines (Fig. S6B, red bars) and that IL-23 and IFNγ were most important (per VIP calculation) for distinguishing cytokine production by cells stimulated in the presence or absence of etomoxir (Fig. S6B, striped bars). Etomixor did not alter mitochondrial coupling efficiency (Fig. S6C). The ability of a variety of etomoxir concentrations to decrease Th17-associated cytokines recapitulated the ability of etomoxir to reduce IL-17 production in murine CD4+ T cells (Raud et al., 2018) and raise the possibility that CPT1A activity, independent of major shifts in OCR or glycolysis, supports the Th17 profile that dominates T2D inflammation.
Figure 5. CPT1A activity supported Th17-associated cytokines prduction by PBMCs.
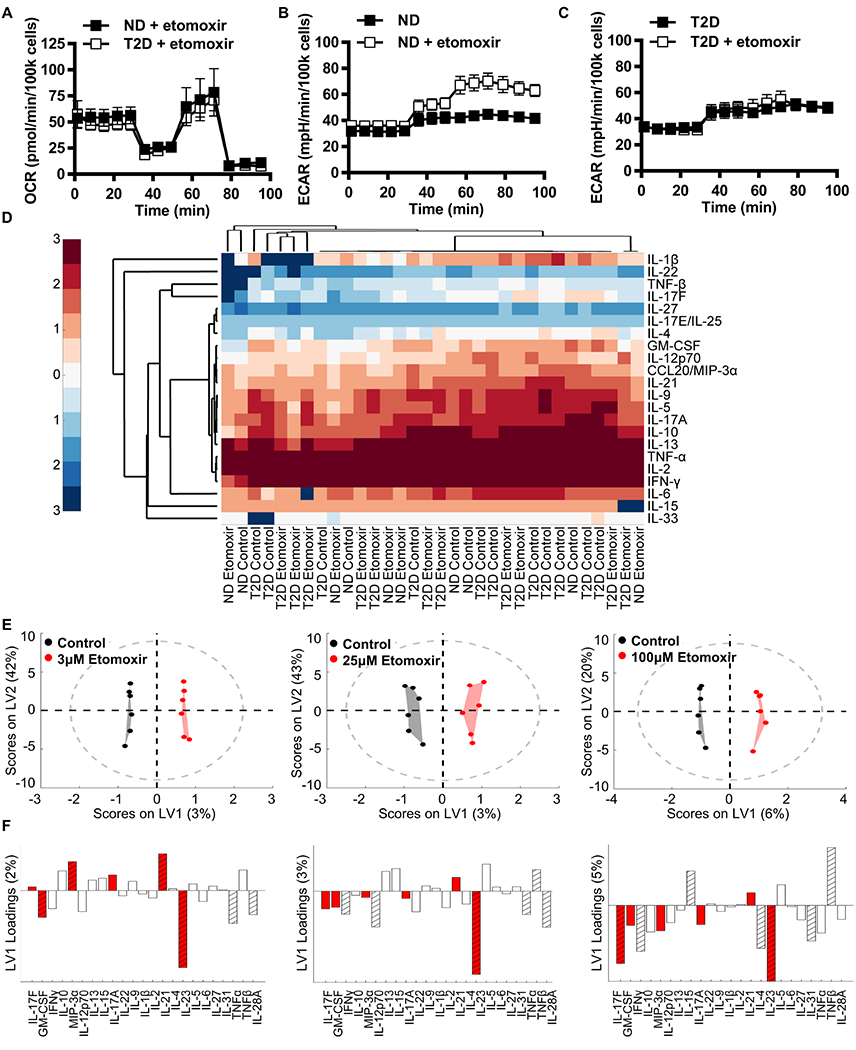
(A) OCR profiles from a mito stress test of ND and T2D PBMCs stimulated with αCD3/αCD28 under glucose deprivation +/− 100μM etomoxir for 40 hr (N=4). (B,C) ECAR profiles from a mito stress test of ND and T2D PBMCs stimulated as in panel A (N=4). (D) Conditioned media from cells in panels A-C were assayed for cytokine concentration by multiplex. Heat map clustergram (univariate analysis) of log10 cytokine concentrations in ND and T2D control or etomoxir-treated PBMCs as listed on the X axis. (E) Orthogonalized PLSDA model distinguishes cytokine secretion in control (black) from 3μM, 25μM, and 100μM etomoxir-treated (red) PBMCs in blended ND and T2D outcomes with 75%, 58.3% and 83.3% cross-validated prediction accuracy respectively (>1 SD from the mean of 100 random models, 80.5%, 68.8%, and 95.1% confidence respectively) (N=6). (F) Partial least squares discriminant analysis loadings on latent variable 1 (orthogonalized) indicated cytokines secreted at higher or lower concentrations (bars above or below the horizontal line, respectively) upon stimulation with etomoxir at the concentration indicated immediately above (panel E). Cytokines with above average contribution to discrimination between control and etomoxir treatment as determined by variable importance in projection (VIP) score > 1 are highlighted with stripes. Th17 cytokines are highlighted by red bars. See also Figure S4 and Figure S6.
Long chain fatty-acyl carnitines promote a Th17 profile only in cells with compromised lipid import machinery
We questioned whether the lower mitochondrial mass in select T cell subsets from T2D subjects highlighted by combinatorial mitochondrial analyses nevertheless functioned similarly to mitochondria in immune cells from ND subjects. Partial least squares regression analysis, used to identify relationships between mitochondrial mass (Fig. S2D) and OCR measurements (Fig. 2A), showed that mitochondrial mass mathematically predicted most extracellular flux-generated aerobic outcomes in PBMCs from ND subjects, and in CD4+ T cells from both ND and T2D subjects (Table S5, blue). In contrast, mitochondrial mass failed to predict OCR measurements in PBMCs from T2D subjects (Table S5, far right), indicating that aerobic metabolism was uniquely uncoupled from mitochondrial mass only in PBMCs from T2D subjects. These findings indicate that immune cells, particularly Th17s and other subsets that account for the T2D-associated decrease in mitochondrial mass (Fig. 1F), have mitochondria that function differently from mitochondria of ND cells. This difference, like the Th17 inflammatory profile, requires T cell-extrinsic input in T2D.
To begin testing the possibility that mitochondrial changes in T2D activate the Th17 profile independent of demonstrated off-target effects of etomoxir (Raud et al., 2018), we quantified CPT1A and CACT, two mitochondrial proteins responsible for β oxidation of the long chain fatty acids known to increase in T2D. PBMCs from T2D compared to ND subjects express a lower CACT:CPT1A protein ratio, and a trend towards a lower mRNA ratio, mainly due to more CPT1A protein (Figs. 6A–D). A lower CACT:CPT1A ratio is consistent with efficient long chain fatty acid transport into the mitochondrial intermembrane space by CPT1A, but limited transport into the matrix by CACT, and thus limited fatty acid oxidation in cells from T2D subjects.
Figure 6. Recapitulating mitochondrial changes characteristic of T2D in PBMCs from lean/normoglycemic subjects increases Th17/IL-17F+ cell frequencies.
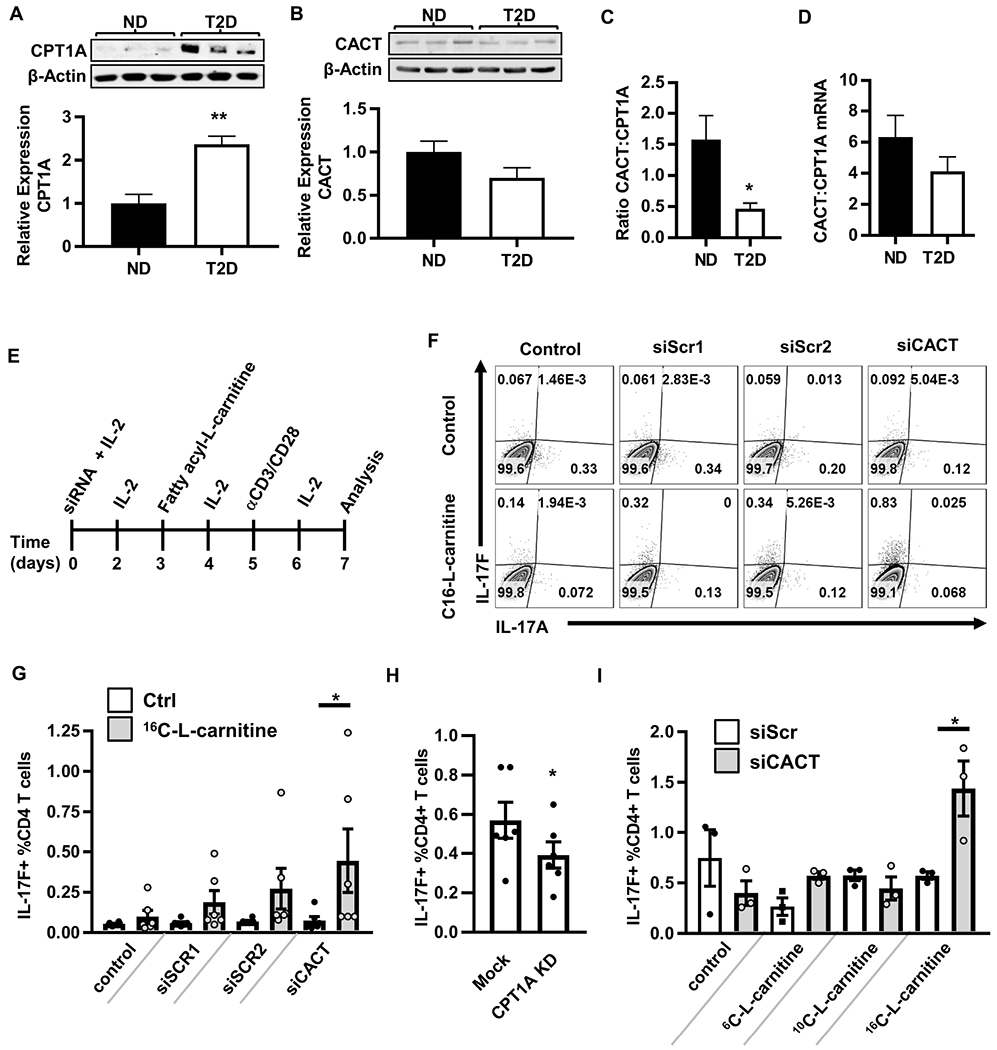
(A,B) Representative Western blots and quantification of CPT1A (ND, N=4; T2D, N=3) and CACT (ND, N=7; T2D, N=5) in resting PBMCs. The average ratio of CACT to CPT1A protein (ND, N=5, T2D, N=3) (C) and mRNA (D) in ND (N=10) and T2D (N=11) PBMCs. (E) Experimental design. IL-2 is added to enhance cell survival. (F) Representative flow plots of cells treated with (left to right) vehicle control alone, each of two scrambled siRNA controls (1&2), or CACT-specific siRNA. Bottom row shows cells treated with 16C-L-carnitine alone (leftmost plot) or in addition to siRNA indicated at top of panel. (G) Percentages of IL-17F+CD4+ T cells +/− siCACT and +/− 16C-L-carnitine. (H) Percentages of IL-17F+CD4+ T cells +/− CPT1A knockdown by RNP-delivered CRISPR or mock CRISPR controls. Each dot shows results from one blood sample, with mean and SEM indicated. (I) Percentages of IL-17F+CD4+ T cells +/− siCACT and +/− 6C, 10C, or 16C-L-carnitine. Differences are determined by unpaired two-tailed student’s t test (A-D), repeated measures two-way ANOVA (G,I), or paired two-tailed student’s t test (H) with significance accepted at p < 0.05. N=3-6 for Panels G-I. See also Figure S7.
To directly test the role that changes in the long chain fatty acid import machinery play in the T2D-associated Th17 profile, we recapitulated the T2D-characteristic CACT:CPT1A ratio in PBMCs from lean normoglycemic subjects using siRNA-mediated CACT knockdown, supplementing with IL-2 to maintain T cell viability (Fig. 6E, S7A). Modest CACT knockdown alone did not impact Th17 indicators, including IL-17A/F and CD161 (Cosmi et al., 2008) (Fig. 6F,G; S7B–C,E). However, addition of 16C-L-carnitine (palmitoyl carnitine) to further mimic excess 16C-acylcarnitine that naturally circulates in T2D (Guasch-Ferre et al., 2018) significantly increased frequency of CD4+/IL-17F+/CD161+ T cells (Fig. 6F,G; S7B,C) and IL-22 secretion (Fig. S7D), but did not change frequency of IL-17A-expressing CD4+ T cells (Fig. 6F, S7E). Complementary analysis of CPT1A knock-down cells by CRISPR-mediated CPT1A gene editing (~67% effective as measured by DNA sequencing) showed that lowering the CPT1A:CACT ratio decreased the frequency of IL-17F+CD4+ cells (Fig. 6H) without affecting the frequency of IFNγ+CD4+ (Th1) cells (Fig. S7F). This combination of gain- and loss-of-function genetic analyses definitively show that disruption of the long chain fatty acid import machinery in mitochondria controls IL-17F production and can combine with excess 16C-acylcarnitine to activate Th17 cytokines.
To determine whether IL-17F activation is specific to the long chain fatty acids that require CPT1A and CACT for mitochondrial import/β oxidation, we repeated siCACT knockdown in PBMCs from lean, normoglycemic subjects and activated cells in the presence of import machinery-independent short (6C) or medium (10C) chain acylcarnitines. Neither short nor medium chain acylcarnitines impacted frequencies of IL-17F+ cells in PBMCs following CACT knockdown (Fig. 6I). Finally, to test whether import-dependent β oxidation plays a role in Th17 activation, we stimulated PBMCs from lean subjects with αCD3/αCD28 plus trimetazidine, an inhibitor of 3 ketoacyl-CoA tholase and thus terminal steps of β oxidation. Trimetazidine alone increased secretion of the Th17 cytokines IL-17A/F, with IL-21 trending towards being increased (Fig. 7A). Cytokines generally produced by other immune cell subsets were not affected by trimetazidine, with the exception of IL-10 (Fig. 7B–D). The effects of trimetazidine on IL-17 secretion were not due to changes in glycolysis (Fig. 7E–G). We conclude that perturbation of β oxidation in cells from lean subjects activates Th17 cytokine production despite unperturbed fatty acid import machinery.
Figure 7. Inhibiting fatty acid oxidation increases secretion of Th17 cytokines.
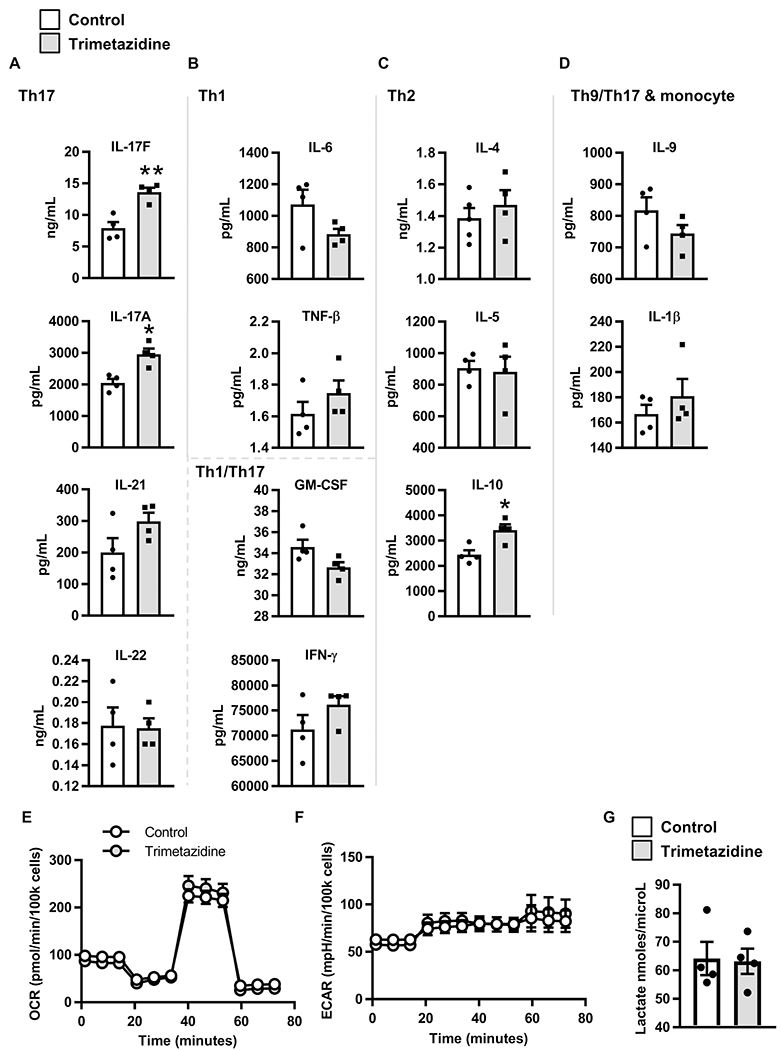
PBMCs from lean subjects (N=4) were stimulated with αCD3/CD28 in media +/− trimetazidine for 40 hr. The conditioned media was assayed for cytokine concentration by multiplex. Concentration of (A) Th17 cytokines, (B) Th1 cytokines and pleiotropic Th1/Th17 cytokines, (C) Th2 cytokines, and (D) additional cytokines are expressed at mean +/− SEM. Data was analyzed by paired student’s t test and significance was accepted at p < 0.05. (E) OCR and (F) ECAR mito stress test extracellular flux profiles for 40 hr αCD3/CD28 stimulated PBMCs from lean subjects (N=4) +/− trimetazidine. (G) Lactate in conditioned media from lean PBMCs (N=4) after 40 hr αCD3/CD28 stimulation +/− trimetazidine.
Overall, our data show that T2D-associated Th17 activation stems from 16C-acylcarnitine generated by either natural or artificial sources combined with non-compensatory/decreased 16C oxidation (due to a naturally low CACT:CPT1A ratio in T2D, or artificial CACT knock-down). Neither change alone is sufficient. Th17 induction in cells from lean/normoglycemic subjects following intra-matrix block of fatty acid oxidation with trimetazidine indicates that even “healthy” amounts of 16C-acylcarnitine (Fig. 7A) must be at least partially disposed of by oxidation to prevent Th17 activation. In addition to changing long chain fatty acid flux, the mitochondrial changes we have highlighted in T2D likely encourage the shift to glycolytic metabolism that is surprisingly dispensable for the development of a Th17 profile. Instead, glycolysis by cells from T2D subjects, at least under extreme deprivation conditions, may generally suppress anti-inflammatory cytokines to indirectly “allow” the Th17 profile that dominates T cell inflammation in T2D.
Discussion
Defining mechanisms that drive inflammatory profiles in T2D may address the lackluster outcomes of clinical trials that test the efficacy of anti-inflammatory medications in T2D (Ferrante, 2013). Our demonstration that excess 16C fatty acid in the carnitine acyl-carnitine cycle combines with inadequate fatty acid oxidation to activate T2D-like Th17 profiles adds complexity to previous data showing murine Th17 function requires fatty acid synthase pathways (Endo et al., 2015; Young et al., 2017). Published work dovetails with our new data to eliminate alternative explanations for pro-inflammatory mechanisms in T2D, which include: (1) pro-inflammatory oxidative stress, which supports Tregs rather than Th17s/IL-17 (Gerriets et al., 2015; Kim et al., 2014; Lee et al., 2011; Won et al., 2013); (2) pro-inflammatory modulators like leptin, which activate multiple T cell subsets (De Rosa et al., 2007; Lord et al., 2002); and (3) AMPK, which appears to play an insignificant role in Th17 inflammation despite anti-inflammatory actions downstream of metformin in other studies (Lee et al., 2013). Our results effectively dismiss the oversimplified notion that glycolysis drives inflammation as in other diseases (Cham and Gajewski, 2005; Peng et al., 2016; Yin et al., 2015) by showing instead that glycolysis, which does not strictly result from hyperglycemia/insulinemia of T2D, parallels rather than promotes T2D inflammation. Because better glycemic control is generally the goal of classical T2D interventions, the demonstration that glucose is not the dominant activator of Th17-mediated inflammation in T2D raises clinical concerns that fatty acid metabolites will continue to drive systemic and/or tissue inflammation even after glycemic control is optimized. The newly appreciated disconnect between glucose as a fuel and T2D inflammation may also explain in part the modest impacts of anti-inflammatory drugs on glycemic control in T2D clinical trials: our data show the two characteristics of T2D are only secondarily linked.
Altered mitochondrial function is characteristic of any number of cell types from T2D subjects, but results from mitochondrial mass/OCR association work, CPT1A knockdown, metformin or etomoxir as mimics of mitochondrial regulators must be interpreted with caution (Tan et al., 2018; Yao et al., 2018). So-called “moonlighting functions” of CPT1A include inactivation of an enolase that catalyzes glycolysis (Kurmi et al., 2018), and interaction with the GTPase rab14, which may mediate subcellular localization of lipid droplets (Tan et al., 2018) that was not assessed in our neutral lipid analysis. Broader effects of etomoxir or metformin are possible, although similar outcomes from drug-independent approaches highlight the importance of changes in long chain fatty acid flux and at least baseline levels of β oxidation in the T2D-associated Th17 profile. Although the general dyslipidemia in T2D gives a virtually endless choice of lipids and other cytosolic intermediates (Acyl CoA esters, mono- or diacylglycerols, etc.) that could drive inflammation while independently challenging mitochondrial metabolism, the demonstration that Th17 cells from non-obese mice have a different fatty acyl-carnitine profile than Th1 or Tregs (Gerriets et al., 2015) is consistent with our demonstration that long chain acylcarnitine uniquely activates IL-17F production in cells from lean subjects. Other roles for acylcarnitines may include altering lipid membrane fluidity to modulate intracellular calcium and downstream pathways (McCoin et al., 2015), and regulation of histone acetylation (Madiraju et al., 2009). Finally, mechanisms that link long chain acylcarnitines to IL-17F production may include MyD88-dependent signaling cascades, recently shown to regulate T cell differentiation (Mandraju et al., 2018; Rutkowsky et al., 2014). All of these possible mechanistic directions deserve significant investigation.
Although in vivo analysis is an obvious next step for establishing the role of lipid flux in T2D inflammation, the lack of a Th17 profile in current mouse models of T2D and our demonstration that physiological cell mixtures are required for most of our outcomes challenge feasibility absent substantial pilot work. The lack of consensus on functions of lipid-like molecules adds further complexity in choosing the most productive next steps for inquiry. For example, although oxysterols promote Th17 cell differentiation (Soroosh et al., 2014) and inhibit the inflammasome (Dang et al., 2017), oxysterols are non-mitochondrial and thus etomoxir-, CPT1A-, and CACT-insensitive (Peyrot et al., 2014). Applicability of our findings to other diseases with a T cell inflammatory component (i.e. multiple sclerosis) will require replication of glucose deprivation/titration studies, in lieu of reliance on 2DG as a measure of glycolysis. Comprehensive lipid/metabolite analyses of immune cells from metabolically well-characterized cohorts of obese people, and/or development of more relevant models of T2D will be important new directions towards establishing clinical impact of our new mechanistic insights.
Limitations of Study
Glycemic control of all subjects was determined by hemoglobin A1c (HbA1c) and random blood glucose. Given the continuous but non-linear nature of metabolic decline, and the goal of T2D medications to lower HbA1c, exclusion of people who do not have a diagnosis of T2D and an HbA1c ≤6.0% from the ND cohort does not guarantee euglycemia. It is possible that more rigorous assessment of glycemic control/metabolic health would exclude some subjects. T2D subjects were also older than ND subjects. Our previous work showed no correlation between IL-17A and the decades of middle age (Jagannathan-Bogdan et al., 2011), although we have not specifically queried cytokine profiles that differentiate cells from subjects who are 40 vs. 50 yrs old. Second, use of the same cell culture media (11mM glucose, “hyperglycemic”) to culture all cells will shift glucose availability compared to in vivo for some cells more than others. The impact of this difference is not known, but matching each sample for blood glucose of the subject would add an extra variable to all analyses that, given the lack of importance of glycolysis for the Th17 profile, was deemed unnecessary. Third, we limited our analyses to fatty acid acylcarnitine derivatives. The ability of other fatty acid metabolites to activate Th17 cytokines cannot be extrapolated from our work, although some specificity was indicated by the importance of chain length for IL-17F activation. Fourth, ideally we would provide quantification of 16C-acylcarnitine accumulation in the inner mitochondrial space. However we are unaware of methods to do so under the cell material limitations downstream of, for example, siRNA-mediated knockdown.
STAR Methods
LEAD CONTACT AND MATERIALS AVAILABILITY
Further information and requests for resources and reagents should be directed to and will be fulfilled by the Lead Contact, Brabara Nikolajczyk (barb.nik@uky.edu). The study did not generate new unique reagents.
EXPERIMENTAL MODEL AND SUBJECT DETAILS
Human Subjects Sample Collection
In accordance with the Declaration of Helsinki, informed consent for all human samples was obtained following a Boston University or University of Kentucky Institutional Review Board-approved protocol. Study design was cross-sectional. Obese subjects without type 2 diabetes (ND N=42 total; N=35 female; Avg. age=41.0 yrs) and obese subjects with type 2 diabetes (T2D; N=50 total; N=34 female; Avg. age=51.6 yrs) as defined by American Diabetes Association criteria were recruited from the Endocrinology clinic and the Center for Endocrinology, Diabetes and Nutrition at the Boston University Medical Center (BUSM). Additional T2D, ND or lean subjects/metabolically healthy subjects were recruited from the BU Clinical Research Center, the BUSM community or the Center for Clinical and Translational Science at the University of Kentucky. Subject characteristics are shown in Table S1. Exclusion criteria were smoking, insulin use, long-term or recent use of antibiotics or anti-inflammatory medications i.e. NSAIDs and allergy medications, serious comorbidities of T2D including dialysis, clinical coronary artery disease, microvascular disease, and blindness. Subjects with a history of other inflammatory or autoimmune diseases such as cancer (<5 yrs ago) or psoriasis were also excluded. Two groups of pre-T2D subjects that did or did not take the glycemic control drug metformin (1000mg/day; N=8 or N=12, Avg. age= 45.0 or 49.5, respectively, and 80-90% female in both groups) provided blood samples: cross-sectional and longitudinal. For the longitudinal cohort, blood was collected before or 3 months after off-label prescription of metformin based on the subjects’ clinical care with the clinical standard of 3 months post-metformin follow-up at Boston Medical Center (N=5; 80% female; Avg. age=49.0). Fifty mLs of peripheral blood was collected into acid/citrate/dextrose containing tubes by venous puncture. PBMCs were purified by Ficoll histopaque 1077 (GE) followed by cell sorting of CD4+ T cells or negative selection with CD4+ cell-excluding magnetic beads (Miltenyi) for experiments on purified T cells as we published (Jagannathan-Bogdan et al., 2011). Sorted cell preparations (CD4+ T cells) for extracellular flux analysis were >95% pure as re-analyzed by flow cytometry. PBMCs and CD4+ T cells isolated by negative selection were frozen in a mixture of 90% FBS and 10% DMSO at −80°C under controlled cooling conditions in a Mr. Frosty apparatus (Nalgene). For multi-week storage, cells were moved to −170°C following 1-7 days at −80°C. For all panels each N=cells from one subject as indicated. Power analyses indicated an N=4-5 will identify statistical differences in cytokine production and Western blot outcomes, although more subjects were generally used to account for genetic differences. Studies were not powered to statistically identify sex-associated differences, and partial least squares discriminant analyses did not differentiate any outcomes (cytokines, mitochondrial mass) based on gender, indicating that gender was a significantly less important source of variability than T2D status, etomoxir treatment, etc.
Cell Culture
Cells were cultured at a density of 700k cells/1.5mL media/ 2 cm2 dish area in RPMI media supplemented with 10% FBS and antibiotics. PBMCs and CD4+ T cells were activated using human T activator αCD3/CD28 Dynabeads per vendor’s instructions unless otherwise noted. Dynabeads were washed in PBS, pH 7.4 + 0.05% BSA + 1.0 mM EDTA then retained on a magnet. After removing wash buffer, Dynabeads were resuspended to the original volume in cell culture media. Cells were activated with ~2μL Dynabeads per 100k cells for 40 hrs. Following activation, supernatants were saved for cytokine analysis as we published (Ip et al., 2016). For western blot and RNA isolation, cells were used immediately after harvest. For flow cytometry and extracellular flux analysis, Dynabeads and any lingering bead-associated cells were removed with a magnet.
METHOD DETAILS
Cell Assays
ATP production.
Cellular ATP was assayed with the ATP Somatic Cell Assay Kit (Sigma-Aldrich) according to manufacturer’s protocol.
Neutral Lipid by Nile Red Staining.
Approximately 200,000 PBMCs were adhered to a poly-D-lysine coated Celigo (Nexelcom)-compatible black-walled 96-well plate. Cells were washed with PBS and incubated with 1μg/mL Nile Red (Sigma-Aldrich) in serum free-RPMI 1640 for 15 min at 37°C. Cells were wash ed again and 200 μL PBS with 0.5μ/mL DAPI (Sigma-Aldrich) was added. The median fluorescence intensity of Nile red staining per cell was measured on a Celigo image cytometer.
Lactate Measurement.
Lactate production was measured in conditioned media after 40 hr stimulation of PBMCs with αCD3/CD28 Dynabeads with the Lactate Colorimetric/Fluorometric Assay Kit from Biovision according to the manufacturer’s protocol.
Extracellular Flux Analysis (Mitostress Test)
After thawing rapidly in a 37°C water bath, cells were isolated and/or activated, then adhered onto wells of a poly-D-lysine coated XF96 plate in extracellular flux assay media (non-buffered DMEM containing 10 mM glucose, 4 mM L-glutamine, and 2 mM sodium pyruvate unless otherwise noted). Oxygen consumption rate (OCR) and extracellular acidification rate (ECAR) were measured using the mitochondrial stress test procedure for basal OCR followed by sequential addition of 3.5 μM oligomycin (Calbiochem), 1 μM or 2 μM (for resting or activated cells, respectively) fluoro-carbonyl cyanide phenylhydrazone (FCCP) (Enzo) and 14μM rotenone + 14 μM antimycin A (Enzo) with the XF96 Extracellular Flux Analyzer (Seahorse Bioscience) as previously described (Nicholas et al., 2017).
For fuel flexibility, dependency, and capacity experiments, cells were washed in XF RPMI base media (Agilent Technologies) + 200μM fatty-acid free BSA (Fisher Scientific). Cells were then adhered onto wells of a poly-D-lysine coated XF96 plate in half volume of extracellular flux RPMI base media + 200μM fatty-acid free BSA. 2x of the indicated metabolites and/or drugs were added to the appropriate wells to dilute to the final concentrations (10 mM glucose, 4 mM L-glutamine, and 2 mM sodium pyruvate, 400μM oleate, and 3-100μM etomoxir (Sigma-Aldrich)). The etomoxir concentration, while not entirely specific at higher concetrations, avoided the reduction of Kreb’s cycle intermediates and oxidative phosphorylation in T cells that occur at 200μM (Raud et al., 2018; Yao et al., 2018), and effects of etomoxir on cytokine profiles were determined to be indistiguishable over the broad range of concentrations tested. All extracellular flux mito stress test data analysis was performed using the Seahorse Explorer (SHORE) Analysis program (Nicholas et al., 2017). Equations to determine flexibility, dependency, and capacity (Fig. S9A) were derived from the Agilent Fuel Flux Kit User Manual(Agilent Technologies, 2017).
qRT-PCR and mRNA Array
Total RNA was isolated with the RNeasy mini-kit with on column DNase treatment (Qiagen) according to the manufacturer’s protocol. Isolated mRNA was converted to cDNA with High Capacity RNA-to-cDNA kit (Thermo Fisher Scientific). AMPK Signaling PCR Array (Qiagen) was performed according to the manufacturer’s protocol with 0.5μg cDNA per plate. Gene expression was assayed with RT2 SYBR Green qPCR Mastermix and 5ng cDNA per reaction on an Applied Biosystems 7900HT Fast Real-Time PCR System. All PCR reactions were performed in triplicate and the real-time data was normalized to β-actin expression.
Western Blot
Whole-cell extracts from 2 million cells were prepared using RIPA buffer (Cell Signaling Technologies) supplemented with HALT protease and phosphatase-inhibitor cocktail (Thermo Fisher Scientific). The proteins were resolved on pre-cast 1.5 mm, 15 well NuPAGE™ 4-12% Bis-Tris Protein Gels (Thermo Fisher Scientific) and transferred to PVDF membrane (EMD Millipore). Membranes were blocked in Odyssey blocking buffer (TBS) (LI-COR Biosciences) and probed with the following antibodies: anti-ACC1 (Cell Signaling Technologies #3662), anti-CPT1A (Cell Signaling Technologies #12252), anti-SLC25A20 (Thermo Fisher Scientific), anti-pAMPK (Cell Signaling Technologies #2535), anti-AMPK (Cell Signaling Technologies #2793), and anti-Actin (Cell Signaling Technologies #3700). Densitometry was performed using Image Studio (LI-COR Biosciences).
Flow Cytometry
All reagents were from Biolegend unless otherwise stated. For phenotyping and mitochondrial mass quantification, cryopreserved PBMCs were thawed into R10 medium and resuspended in 40nM mitotracker green (MTG) FM (Cell Signaling Technologies) and incubated for 30 min at 37°C. The cells were then washed with PBS and immediately stained with Zombie NIR fixable dye for 15 min at room temperature, then washed with PBS/0.5%BSA/2mM EDTA. Cell pellets were resuspended in PBS/0.5%BSA/2mM EDTA supplemented with anti-human FcR-blocking reagent and incubated for 10 min. A mixture of fluorescent antibodies containing CD4 BUV395 (BD Biosciences), CD8 BUV805 (BD Biosciences), CCR6 BV 421, CCR4 BV510, CD25 BV605, CD45RA BV786, CD161 PE, CXCR3 PerCP-Cy5.5, CD127 PE-Cy7, CCR5 APC, CD19 Ax700, and CD14 APC-Cy7 resuspended in Brilliant Buffer (BD Biosciences). Samples were analyzed on a BD FACSARIA II SORP.
Alternatively, anti-CD3/anti-CD28 stimulated PBMCs were cultured with Brefeldin A (5 ug/ml, eBioscience) during the last 4 h of stimulation as previously described (Defuria et al., 2013). Cells were harvested and washed with PBS, then immediately stained. After PBS wash, cells were stained with Zombie NIR fixable dye, then stained with CD19 BV510 (BD Biosciences), CD14 PE-Cy7, CD4 BUV737 (BD Biosciences), and CD161 BB700 (BD Biosciences) in Brilliant Stain Buffer (BD Biosciences). Cells were washed, fixed with IC Fixation Buffer (Thermo Fisher), treated with Permeabilization Buffer (Thermo Fisher), then stained with IL-17F eFluor 660 (Thermo Fisher), and IL-17A BV421. Data were acquired on a BD Biosciences LSR II. For LipidTox deep red (Thermo Fisher) staining to assess neutral lipids, cells were surface stained with CD19 BV510 (BD Biosciences), CD14 PE-Cy7, CD4 BUV737 (BD Biosciences), and CD161 BB700 (BD Biosciences) in Brilliant Stain Buffer (BD Biosciences) containing 1x LipidTox deep red for 30 min at room temperature. After washing with serum free-RPMI 1640, the cells were resuspended at 1x10⁶ cells/mL in serum free-RPMI 1640. The fluorescent glucose analog, 2-NBDG (Thermo Fisher Scientific) was added to the samples at final concentration of 30 μM immediately before acquisition. Data were acquired on a BD Biosciences LSR II, with each sample being run at low flow rate (12-20 μL/min) for 10 min.
Flow cytometry data analysis:
data were recorded with BD FACSDIVA 6 and automatically compensated with compensation matrix recorded within the sample files according to FCS 3.0 standards or associated with each file in post-acquision analysis performed in FlowJo v.10.2-10.3 (FlowJo, Inc). Gating was performed as outlined in Supplemental Fig. 2.
Knockdown of CACT using siRNA
PBMCs (2x10⁵) were cultured in serum-free Accell siRNA delivery media (siRNA technologies; Dharmacon, Lafayette, CO, USA) supplemented with 300 U/mL rIL-2 (Biolegend) with 1 μM scramble siRNA or 1 μM CACT for 36hrs. At 72 hrs, knockdown was quantified by flow cytometry and treated with metabolites as indicated for an additional 48 hrs in Accell siRNA delivery media. At the end of day 5 in culture, αCD3/CD28 Dynabeads and FBS to a final concentration of 10% were added to stimulate the cells for 40hrs. After a total of 7 days in culture, the cells were harvested, Dynabeads removed and the cells were stained for flow cytometry.
Knockdown of CPT1A using ribonuleoprotein (RNP) complex
The protocol was adapted from recently published work (Roth et al., 2018). PBMCs were activated with human T-activator CD3/CD28 Dynabeads (1.0 bead/cell) for 16 hr, then centrifuged at 90g for 10 min, and resuspended in electroporation mix containing RNPs. RNPs were produced on the day of electroporation using reconstituted sgRNA (Synthego, CA) targeted towards CPT1A (C*A*U*CAUCACUGGCGUGUACC + Synthego modified EZ Scaffold), which was re-suspended in 1X TE buffer (10 mM Tris-HCl, 1.0 mM EDTA, pH 8.0) to a final concentration of 100μM. One hundred pmol of sgRNA was mixed with 76.25 pmol cas9 in 16.4 μl P3 nucleofection solution with 3.6 μl supplement 1 (Lonza catalogue no. V4XP-3032) to produce RNPs in an “electroporation mix” that was incubated at room temperature for 10 min before use. 1x10⁶ PBMCs per well were electroporated using P3 Primary Cell Nucleofection kit (Lonza catalogue no. V4XP-3032) and a Lonza 4D electroporation system with pulse code EH115. Cells were rested in warm cell culture medium (supplemented with IL-2, 300 IU) for 15 min then transferred to 96 well plates on what we designated as Day 0. Fresh IL-2 was supplemented every 48 hr, as in Figure 6E. Knockdown was verified on day 5 by DNA sequencing. The average editing efficiency was 66.67% +/− 4.91. Cells were activated post-knockdown with human T-activator CD3/CD28 Dynabeads (1.0 bead/cell) for 40 hr before staining for flow cytometry analysis.
Multiplex measurement of cytokine concentrations
Supernatant samples were centrifuged for 30s to remove debris before being applied to a 384-well plate for analysis by multiplexing bead-based ELISA using the Milliplex human Th17 25-plex kit (Millipore). Antibodies and magnetic beads were diluted 1:1 with assay buffer and utilized at half-volume to adjust the manufacturer’s protocol to our 384-well plate format. Each sample and standard was assayed in technical triplicate, with the average value of these used for analyses. Outcomes from wells with < 35 beads read for each analyte were excluded from analysis. Plates were washed in between incubations using a BioTek 406 Touch plate washer (BioTek) and read using the Luminex FlexMap 3D system (Luminex). We assayed samples at dilutions of 1:1 and 1:7 (sample:assay buffer) to allow abundant cytokines to be measured in the linear range of the instrument.
QUANTIFICATION AND STATISTICAL ANALYSIS
Statistical analyses
Data are means and SEM unless otherwise indicated. Normality of our data sets were tested by the Shapiro-Wilk test; outliers were not considered. Additional assumptions of statistical analyses were not tested but assumed to hold. Student’s t test and two-way ANOVA analysis with Tukey adjustments were performed in GraphPad Prism. P<0.05 defined significant differences. * = p <0.05. ** = p<0.01. *** = p<0.001. **** = p<0.0001. For heat maps, cytokine data were variance scaled, and mean centered (z scored). With the exception of assays requiring storage of samples until batch analysis (e.g. multiplex of cytokines, flow cytometry), all experiments were performed at least two independent times, both of which included multiple N’s.
Mitotracker green normalization
To account for variability in live cell staining of mitotracker green, multiple aliquots of PBMCs isolated from a single blood draw of a control donor was included as a control with each batch of flow cytometry samples. This sample assured quality control of immunophenotyping (no batch effect on cell subset percentages, data not shown) and provided an internal control to calculate a normalization factor to correct for batch effects observed with mitotracker green. A normalization factor for each cell subset analyzed was generated by dividing the MFI of the control sample for each flow cytometry batch by the sum of the MFI for the corresponding subset in all batches. The raw data for mitotracker green MFI was multiplied by this cell subset and batch specific normalization factor to obtain normalized mitotracker green MFI.
Partial least squares modeling
Partial least-squares discriminant analysis and partial least squares regression analysis are supervised analyses that use linear combinations of variables (cell type or experimental set-up herein) to predict the variation in the dependent variables (mitochondrial mass or cytokines herein) (Lau et al., 2011; Simmons et al., 2013; Wold et al., 2001). These analytical tools generate principal components (termed latent variables, or LVs) analogous to those obtained by principal component analysis, but constrained by categorical (i.e., ND, T2D) or quantitative information (i.e., extracellular flux measures). Loading analyses will rank dependent variables (mitochondrial mass or cytokines) into LVs that are most important for fit and data cloud separation in the model. Variable importance in projection (VIP) analysis combines all LVs over infinite dimensions. A VIP score >1 is considered important (above average contribution) for model performance and prediction only if p<0.05 in permutation tests that measure variation explained and predicted by the model.
All partial least squares analyses were conducted in MATLAB using the PLS_Toolbox (Eigenvector Research, Inc.). Data was normalized along each X and Y parameter by Z-score before application of the algorithm. Cross-validation was performed with one-third of the relevant dataset, except in cases where the number of observations was fewer than 15, in which case one-fifth of the relevant dataset was used as the test for the trainer data. The number of latent variables (LVs) was chosen so as to minimize cumulative error over all predictions. Where noted, we orthogonally rotated the models so that maximal separation was achieved across LV1. We calculated model confidence by randomly permuting Y 100 times and rebuilding the model to form a distribution of error for random models, and comparing our model to this distribution with the Mann-Whitney U test. Importance of each parameter to the model prediction was quantified using variable importance in projection (VIP) score. A VIP score greater than 1 (above average contribution) was considered important for model performance and prediction.
Supplementary Material
Table S3. Related to Figure 4. Complete AMPK mRNA array data for ND and T2D PBMCs stimulated for 40 hrs with αCD3/CD28 in the presence or absence of glucose, N=4 per group.
Highlights.
Glycolysis in T cells/PBMCs from T2D subjects fails to stimulate T2D inflammation
T cells from T2D subjects have altered mitochondria
Altered import or oxidation of fatty acids activates inflammation in healthy cells
Mitochondrial changes combine with fatty acid metabolites to activate inflammation
Context and Significant Statement.
Obesity-associated inflammation disrupts metabolism, which in turn promotes type 2 diabetes. Identifying the driving force behind such inflammation is critical for finding new approaches that slow or prevent metabolic disease in people with obesity. Our data unexpectedly show that glucose, which drives inflammation in other contexts, is dispensable for type 2 diabetes-associated inflammation. Instead, partial defects in the cell’s power plant, or mitochondria, fuel inflammation, but only in cells further stressed by the types of lipids that are elevated in obesity and type 2 diabetes. Because glucose control is the primary goal of diabetes treatment, our data raise clinical concerns that lipids will continue to drive inflammation, and thus metabolic dysfunction, even in patients with desirable HbA1c readings.
Acknowledgements
This work was supported by grant R01DK108056 (BN and DL), An Army Research Office Institute for Collaborative Biotechnologies grant W911NF-09-0001 (DL), UL1TR001998 from NCATS (PK), R01 DK DK99618 (BC/MPI), P01 DK46200 (BC). This work was also supported by the University of Kentucky College of Medicine (BN), University of Kentucky Markey Cancer Center and Flow Cytometry Core P30CA177558 (BN), Boston University Flow Cytometry Core Facility T32AI089673, Boston University Inflammatory Disorders Training Grant 5T32AI08967, and Boston University Medical Center, Metabolism, Endocrinology and Obesity Training Grant T32DK007201.
Funding Statement:
This work was supported by grant R01DK108056 (BSN, DAL CAA, and PAK), An Army Research Office Institute for Collaborative Biotechnologies grant W911NF-09-0001 (DL), UL1TR001998 from NCATS (PAK), R01 DK DK99618 (BEC), and P01 DK46200 (BEC). This work was also supported by University of Kentucky College of Medicine, University of Kentucky Markey Cancer Center P30CA177558, Boston University Flow Cytometry Core Facility, Boston University Program in Inflammatory Diseases T32AI089673, Boston University Inflammatory Disorders Training Grant 5T32AI08967, and Boston University Medical Center, Metabolism, Endocrinology and Obesity Training Grant T32DK007201.
Abbreviations:
- T2D
type 2 diabetes
- ND
non-T2D
- OCR
oxygen consumption rate
- ECAR
extracellular acidification rate
- pre-T2D
pre-diabetes
- VIP
variable importance in projection
Footnotes
Publisher's Disclaimer: This is a PDF file of an unedited manuscript that has been accepted for publication. As a service to our customers we are providing this early version of the manuscript. The manuscript will undergo copyediting, typesetting, and review of the resulting proof before it is published in its final form. Please note that during the production process errors may be discovered which could affect the content, and all legal disclaimers that apply to the journal pertain.
Competing Financial Interests: The authors declare they have no competing financial interests.
Competing Interests: The authors have no competing interests relevant to the work.
Data Availability Statement:
All data are available herein or upon request to the corresponding author.
Data availability.
The data sets generated and analyzed during the study are included with the published manuscript (and supplementary information). All other data are available from the corresponding author upon request.
References
- Agilent Technologies, I. (2017). Agilent Seahorse XF Mito Fuel Flex Test Kit User Manual. (Wilmington, DE: ). [Google Scholar]
- Blagih J, Coulombe F, Vincent EE, Dupuy F, Galicia-Vazquez G, Yurchenko E, Raissi TC, van der Windt GJ, Viollet B, Pearce EL, et al. (2015). The energy sensor AMPK regulates T cell metabolic adaptation and effector responses in vivo. Immunity 42, 41–54. [DOI] [PubMed] [Google Scholar]
- Brand K (1985). Glutamine and glucose metabolism during thymocyte proliferation. Pathways of glutamine and glutamate metabolism. Biochem J 228, 353–361. [DOI] [PMC free article] [PubMed] [Google Scholar]
- Brand K, Williams JF, and Weidemann MJ (1984). Glucose and glutamine metabolism in rat thymocytes. Biochem J 221, 471–475. [DOI] [PMC free article] [PubMed] [Google Scholar]
- Cameron AR, Logie L, Patel K, Erhardt S, Bacon S, Middleton P, Harthill J, Forteath C, Coats JT, Kerr C, et al. (2018). Metformin selectively targets redox control of complex I energy transduction. Redox Biol 14, 187–197. [DOI] [PMC free article] [PubMed] [Google Scholar]
- Carling D, Zammit VA, and Hardie DG (1987). A common bicyclic protein kinase cascade inactivates the regulatory enzymes of fatty acid and cholesterol biosynthesis. FEBS Lett 223, 217–222. [DOI] [PubMed] [Google Scholar]
- Caro-Maldonado A, Wang R, Nichols AG, Kuraoka M, Milasta S, Sun LD, Gavin AL, Abel ED, Kelsoe G, Green DR, et al. (2014). Metabolic Reprogramming Is Required for Antibody Production That Is Suppressed in Anergic but Exaggerated in Chronically BAFF-Exposed B Cells. J Immunol. [DOI] [PMC free article] [PubMed] [Google Scholar]
- Cham CM, and Gajewski TF (2005). Glucose availability regulates IFN-gamma production and p70S6 kinase activation in CD8+ effector T cells. J Immunol 174, 4670–4677. [DOI] [PubMed] [Google Scholar]
- Chaube B, and Bhat MK (2016). AMPK, a key regulator of metabolic/energy homeostasis and mitochondrial biogenesis in cancer cells. Cell Death Dis 7, e2044. [DOI] [PMC free article] [PubMed] [Google Scholar]
- Cosmi L, De Palma R, Santarlasci V, Maggi L, Capone M, Frosali F, Rodolico G, Querci V, Abbate G, Angeli R, et al. (2008). Human interleukin 17-producing cells originate from a CD161+CD4+ T cell precursor. J Exp Med 205, 1903–1916. [DOI] [PMC free article] [PubMed] [Google Scholar]
- Dang EV, McDonald JG, Russell DW, and Cyster JG (2017). Oxysterol Restraint of Cholesterol Synthesis Prevents AIM2 Inflammasome Activation. Cell 171, 1057–1071 e1011. [DOI] [PMC free article] [PubMed] [Google Scholar]
- De Rosa V, Procaccini C, Cali G, Pirozzi G, Fontana S, Zappacosta S, La Cava A, and Matarese G (2007). A key role of leptin in the control of regulatory T cell proliferation. Immunity 26, 241–255. [DOI] [PubMed] [Google Scholar]
- Defuria J, Belkina AC, Jagannathan-Bogdan M, Snyder-Cappione J, Carr JD, Nersesova YR, Markham D, Strissel KJ, Watkins AA, Zhu M, et al. (2013). B cells promote inflammation in obesity and type 2 diabetes through regulation of T-cell function and an inflammatory cytokine profile. Proc Natl Acad Sci U S A 110, 5133–5138. [DOI] [PMC free article] [PubMed] [Google Scholar]
- Delgoffe GM, Kole TP, Zheng Y, Zarek PE, Matthews KL, Xiao B, Worley PF, Kozma SC, and Powell JD (2009). The mTOR kinase differentially regulates effector and regulatory T cell lineage commitment. Immunity 30, 832–844. [DOI] [PMC free article] [PubMed] [Google Scholar]
- Delgoffe GM, Pollizzi KN, Waickman AT, Heikamp E, Meyers DJ, Horton MR, Xiao B, Worley PF, and Powell JD (2011). The kinase mTOR regulates the differentiation of helper T cells through the selective activation of signaling by mTORC1 and mTORC2. Nat Immunol 12, 295–303. [DOI] [PMC free article] [PubMed] [Google Scholar]
- Endo Y, Asou HK, Matsugae N, Hirahara K, Shinoda K, Tumes DJ, Tokuyama H, Yokote K, and Nakayama T (2015). Obesity Drives Th17 Cell Differentiation by Inducing the Lipid Metabolic Kinase, ACC1. Cell reports 12, 1042–1055. [DOI] [PubMed] [Google Scholar]
- Fabbrini E, Cella M, McCartney SA, Fuchs A, Abumrad NA, Pietka TA, Chen Z, Finck BN, Han DH, Magkos F, et al. (2013). Association between specific adipose tissue CD4+ T-cell populations and insulin resistance in obese individuals. Gastroenterology 145, 366–374 e361–363. [DOI] [PMC free article] [PubMed] [Google Scholar]
- Feingold KR, and Grunfeld C (1987). Tumor necrosis factor-alpha stimulates hepatic lipogenesis in the rat in vivo. J Clin Invest 80, 184–190. [DOI] [PMC free article] [PubMed] [Google Scholar]
- Ferrante AW Jr. (2013). Macrophages, fat, and the emergence of immunometabolism. J Clin Invest 123, 4992–4993. [DOI] [PMC free article] [PubMed] [Google Scholar]
- Gauthier MS, O’Brien EL, Bigornia S, Mott M, Cacicedo JM, Xu XJ, Gokce N, Apovian C, and Ruderman N (2011). Decreased AMP-activated protein kinase activity is associated with increased inflammation in visceral adipose tissue and with whole-body insulin resistance in morbidly obese humans. Biochem Biophys Res Commun 404, 382–387. [DOI] [PMC free article] [PubMed] [Google Scholar]
- Gerriets VA, Kishton RJ, Nichols AG, Macintyre AN, Inoue M, Ilkayeva O, Winter PS, Liu X, Priyadharshini B, Slawinska ME, et al. (2015). Metabolic programming and PDHK1 control Cd4+ T cell subsets and inflammation. J Clin Invest 125, 194–207. [DOI] [PMC free article] [PubMed] [Google Scholar]
- Grunfeld C, Verdier JA, Neese R, Moser AH, and Feingold KR (1988). Mechanisms by which tumor necrosis factor stimulates hepatic fatty acid synthesis in vivo. J Lipid Res 29, 1327–1335. [PubMed] [Google Scholar]
- Guasch-Ferre M, Ruiz-Canela M, Li J, Zheng Y, Bullo M, Wang DD, Toledo E, Clish C, Corella D, Estruch R, et al. (2018). Plasma acylcarnitines and risk of type 2 diabetes in a Mediterranean population at high cardiovascular risk. J Clin Endocrinol Metab. [DOI] [PMC free article] [PubMed] [Google Scholar]
- Herzig S, and Shaw RJ (2018). AMPK: guardian of metabolism and mitochondrial homeostasis. Nat Rev Mol Cell Biol 19, 121–135. [DOI] [PMC free article] [PubMed] [Google Scholar]
- Hotamisligil GS, Peraldi P, Budavari A, Ellis R, White MF, and Spiegelman BM (1996). IRS-1-mediated inhibition of insulin receptor tyrosine kinase activity in TNF-alpha- and obesity-induced insulin resistance. Science 271, 665–668. [DOI] [PubMed] [Google Scholar]
- Ip B, Cilfone NA, Belkina AC, DeFuria J, Jagannathan-Bogdan M, Zhu M, Kuchibhatla R, McDonnell ME, Xiao Q, Kepler TB, et al. (2016). Th17 cytokines differentiate obesity from obesity-associated type 2 diabetes and promote TNFalpha production. Obesity (Silver Spring) 24, 102–112. [DOI] [PMC free article] [PubMed] [Google Scholar]
- Jagannathan-Bogdan M, McDonnell ME, Shin H, Rehman Q, Hasturk H, Apovian CM, and Nikolajczyk BS (2011). Elevated proinflammatory cytokine production by a skewed T cell compartment requires monocytes and promotes inflammation in type 2 diabetes. J Immunol 186, 1162–1172. [DOI] [PMC free article] [PubMed] [Google Scholar]
- Jones Iv AR, Coleman EL, Husni NR, Deeney JT, Raval F, Steenkamp D, Dooms H, Nikolajczyk BS, and Corkey BE (2017). Type 1 diabetes alters lipid handling and metabolism in human fibroblasts and peripheral blood mononuclear cells. PLoS One 12, e0188474. [DOI] [PMC free article] [PubMed] [Google Scholar]
- Jones N, Cronin JG, Dolton G, Panetti S, Schauenburg AJ, Galloway SAE, Sewell AK, Cole DK, Thornton CA, and Francis NJ (2017). Metabolic Adaptation of Human CD4(+) and CD8(+) T-Cells to T-Cell Receptor-Mediated Stimulation. Frontiers in immunology 8, 1516. [DOI] [PMC free article] [PubMed] [Google Scholar]
- Kemmerer M, Finkernagel F, Cavalcante MF, Abdalla DS, Muller R, Brune B, and Namgaladze D (2015). AMP-Activated Protein Kinase Interacts with the Peroxisome Proliferator-Activated Receptor Delta to Induce Genes Affecting Fatty Acid Oxidation in Human Macrophages. PLoS One 10, e0130893. [DOI] [PMC free article] [PubMed] [Google Scholar]
- Kim HR, Lee A, Choi EJ, Hong MP, Kie JH, Lim W, Lee HK, Moon BI, and Seoh JY (2014). Reactive oxygen species prevent imiquimod-induced psoriatic dermatitis through enhancing regulatory T cell function. PLoS One 9, e91146. [DOI] [PMC free article] [PubMed] [Google Scholar]
- Kim JS, Sklarz T, Banks LB, Gohil M, Waickman AT, Skuli N, Krock BL, Luo CT, Hu W, Pollizzi KN, et al. (2013). Natural and inducible TH17 cells are regulated differently by Akt and mTOR pathways. Nat Immunol 14, 611–618. [DOI] [PMC free article] [PubMed] [Google Scholar] [Retracted]
- Kurmi K, Hitosugi S, Wiese EK, Boakye-Agyeman F, Gonsalves WI, Lou Z, Karnitz LM, Goetz MP, and Hitosugi T (2018). Carnitine Palmitoyltransferase 1A Has a Lysine Succinyltransferase Activity. Cell reports 22, 1365–1373. [DOI] [PMC free article] [PubMed] [Google Scholar]
- Lau KS, Juchheim AM, Cavaliere KR, Philips SR, Lauffenburger DA, and Haigis KM (2011). In vivo systems analysis identifies spatial and temporal aspects of the modulation of TNF-alpha-induced apoptosis and proliferation by MAPKs. Sci Signal 4, ra16. [DOI] [PMC free article] [PubMed] [Google Scholar]
- Lee HM, Kim JJ, Kim HJ, Shong M, Ku BJ, and Jo EK (2013). Upregulated NLRP3 inflammasome activation in patients with type 2 diabetes. Diabetes 62, 194–204. [DOI] [PMC free article] [PubMed] [Google Scholar]
- Lee K, Won HY, Bae MA, Hong JH, and Hwang ES (2011). Spontaneous and aging-dependent development of arthritis in NADPH oxidase 2 deficiency through altered differentiation of CD11b+ and Th/Treg cells. Proc Natl Acad Sci U S A 108, 9548–9553. [DOI] [PMC free article] [PubMed] [Google Scholar]
- Lord GM, Matarese G, Howard JK, Bloom SR, and Lechler RI (2002). Leptin inhibits the anti-CD3-driven proliferation of peripheral blood T cells but enhances the production of proinflammatory cytokines. J Leukoc Biol 72, 330–338. [PubMed] [Google Scholar]
- Lynch L, Michelet X, Zhang S, Brennan PJ, Moseman A, Lester C, Besra G, Vomhof-Dekrey EE, Tighe M, Koay HF, et al. (2015). Regulatory iNKT cells lack expression of the transcription factor PLZF and control the homeostasis of T(reg) cells and macrophages in adipose tissue. Nat Immunol 16, 85–95. [DOI] [PMC free article] [PubMed] [Google Scholar]
- Madiraju P, Pande SV, Prentki M, and Madiraju SR (2009). Mitochondrial acetylcarnitine provides acetyl groups for nuclear histone acetylation. Epigenetics 4, 399–403. [DOI] [PubMed] [Google Scholar]
- Mandraju R, Jain A, Gao Y, Ouyang Z, Norgard MV, and Pasare C (2018). MyD88 Signaling in T Cells Is Critical for Effector CD4 T Cell Differentiation following a Transitional T Follicular Helper Cell Stage. Infect Immun 86. [DOI] [PMC free article] [PubMed] [Google Scholar]
- McCoin CS, Knotts TA, and Adams SH (2015). Acylcarnitines--old actors auditioning for new roles in metabolic physiology. Nat Rev Endocrinol 11, 617–625. [DOI] [PMC free article] [PubMed] [Google Scholar]
- McLaughlin T, Liu LF, Lamendola C, Shen L, Morton J, Rivas H, Winer D, Tolentino L, Choi O, Zhang H, et al. (2014). T-cell profile in adipose tissue is associated with insulin resistance and systemic inflammation in humans. Arterioscler Thromb Vasc Biol 34, 2637–2643. [DOI] [PMC free article] [PubMed] [Google Scholar]
- Michalek RD, Gerriets VA, Jacobs SR, Macintyre AN, MacIver NJ, Mason EF, Sullivan SA, Nichols AG, and Rathmell JC (2011). Cutting edge: distinct glycolytic and lipid oxidative metabolic programs are essential for effector and regulatory CD4+ T cell subsets. J Immunol 186, 3299–3303. [DOI] [PMC free article] [PubMed] [Google Scholar]
- Nicholas D, Proctor EA, Raval FM, Ip BC, Habib C, Ritou E, Grammatopoulos TN, Steenkamp D, Dooms H, Apovian CM, et al. (2017). Advances in the quantification of mitochondrial function in primary human immune cells through extracellular flux analysis. PLoS One 12, e0170975. [DOI] [PMC free article] [PubMed] [Google Scholar]
- Pandolfi JB, Ferraro AA, Sananez I, Gancedo MC, Baz P, Billordo LA, Fainboim L, and Arruvito L (2016). ATP-Induced Inflammation Drives Tissue-Resident Th17 Cells in Metabolically Unhealthy Obesity. J Immunol 196, 3287–3296. [DOI] [PubMed] [Google Scholar]
- Peng M, Yin N, Chhangawala S, Xu K, Leslie CS, and Li MO (2016). Aerobic glycolysis promotes T helper 1 cell differentiation through an epigenetic mechanism. Science 354, 481–484. [DOI] [PMC free article] [PubMed] [Google Scholar]
- Peyrot SM, Nachtergaele S, Luchetti G, Mydock-McGrane LK, Fujiwara H, Scherrer D, Jallouk A, Schlesinger PH, Ory DS, Covey DF, et al. (2014). Tracking the subcellular fate of 20(s)-hydroxycholesterol with click chemistry reveals a transport pathway to the Golgi. J Biol Chem 289, 11095–11110. [DOI] [PMC free article] [PubMed] [Google Scholar]
- Procaccini C, Carbone F, Di Silvestre D, Brambilla F, De Rosa V, Galgani M, Faicchia D, Marone G, Tramontano D, Corona M, et al. (2016). The Proteomic Landscape of Human Ex Vivo Regulatory and Conventional T Cells Reveals Specific Metabolic Requirements. Immunity 44, 406–421. [DOI] [PMC free article] [PubMed] [Google Scholar]
- Rabinovitch RC, Samborska B, Faubert B, Ma EH, Gravel SP, Andrzejewski S, Raissi TC, Pause A, St-Pierre J, and Jones RG (2017). AMPK Maintains Cellular Metabolic Homeostasis through Regulation of Mitochondrial Reactive Oxygen Species. Cell reports 21, 1–9. [DOI] [PubMed] [Google Scholar]
- Raud B, Roy DG, Divakaruni AS, Tarasenko TN, Franke R, Ma EH, Samborska B, Hsieh WY, Wong AH, Stuve P, et al. (2018). Etomoxir Actions on Regulatory and Memory T Cells Are Independent of Cpt1a-Mediated Fatty Acid Oxidation. Cell Metab 28, 504–515 e507. [DOI] [PMC free article] [PubMed] [Google Scholar]
- Roth TL, Puig-Saus C, Yu R, Shifrut E, Carnevale J, Li PJ, Hiatt J, Saco J, Krystofinski P, Li H, et al. (2018). Reprogramming human T cell function and specificity with non-viral genome targeting. Nature 559, 405–409. [DOI] [PMC free article] [PubMed] [Google Scholar]
- Rutkowsky JM, Knotts TA, Ono-Moore KD, McCoin CS, Huang S, Schneider D, Singh S, Adams SH, and Hwang DH (2014). Acylcarnitines activate proinflammatory signaling pathways. Am J Physiol Endocrinol Metab 306, E1378–1387. [DOI] [PMC free article] [PubMed] [Google Scholar]
- Simmons RP, Scully EP, Groden EE, Arnold KB, Chang JJ, Lane K, Lifson J, Rosenberg E, Lauffenburger DA, and Altfeld M (2013). HIV-1 infection induces strong production of IP-10 through TLR7/9-dependent pathways. AIDS 27, 2505–2517. [DOI] [PMC free article] [PubMed] [Google Scholar]
- Soroosh P, Wu J, Xue X, Song J, Sutton SW, Sablad M, Yu J, Nelen MI, Liu X, Castro G, et al. (2014). Oxysterols are agonist ligands of RORgammat and drive Th17 cell differentiation. Proc Natl Acad Sci U S A 111, 12163–12168. [DOI] [PMC free article] [PubMed] [Google Scholar]
- Tan Z, Xiao L, Tang M, Bai F, Li J, Li L, Shi F, Li N, Li Y, Du Q, et al. (2018). Targeting CPT1A-mediated fatty acid oxidation sensitizes nasopharyngeal carcinoma to radiation therapy. Theranostics 8, 2329–2347. [DOI] [PMC free article] [PubMed] [Google Scholar]
- Toyama EQ, Herzig S, Courchet J, Lewis TL Jr., Loson OC, Hellberg K, Young NP, Chen H, Polleux F, Chan DC, et al. (2016). Metabolism. AMP-activated protein kinase mediates mitochondrial fission in response to energy stress. Science 351, 275–281. [DOI] [PMC free article] [PubMed] [Google Scholar]
- Travers RL, Motta AC, Betts JA, Bouloumie A, and Thompson D (2015). The impact of adiposity on adipose tissue-resident lymphocyte activation in humans. Int J Obes (Lond) 39, 762–769. [DOI] [PMC free article] [PubMed] [Google Scholar]
- van Beek L, Lips MA, Visser A, Pijl H, Ioan-Facsinay A, Toes R, Berends FJ, Willems van Dijk K, Koning F, and van Harmelen V (2014). Increased systemic and adipose tissue inflammation differentiates obese women with T2DM from obese women with normal glucose tolerance. Metabolism 63, 492–501. [DOI] [PubMed] [Google Scholar]
- Winer S, Chan Y, Paltser G, Truong D, Tsui H, Bahrami J, Dorfman R, Wang Y, Zielenski J, Mastronardi F, et al. (2009). Normalization of obesity-associated insulin resistance through immunotherapy. Nat Med 15, 921–929. [DOI] [PMC free article] [PubMed] [Google Scholar]
- Wold S, Sjöström M, and Eriksson L (2001). PLS-regression: a basic tool of chemometrics. Chemom Intell Lab Syst 58, 109–130. [Google Scholar]
- Won HY, Jang EJ, Lee K, Oh S, Kim HK, Woo HA, Kang SW, Yu DY, Rhee SG, and Hwang ES (2013). Ablation of peroxiredoxin II attenuates experimental colitis by increasing FoxO1-induced Foxp3+ regulatory T cells. J Immunol 191, 4029–4037. [DOI] [PubMed] [Google Scholar]
- Wouters K, Gaens K, Bijnen M, Verboven K, Jocken J, Wetzels S, Wijnands E, Hansen D, van Greevenbroek M, Duijvestijn A, et al. (2017). Circulating classical monocytes are associated with CD11c(+) macrophages in human visceral adipose tissue. Sci Rep 7, 42665. [DOI] [PMC free article] [PubMed] [Google Scholar]
- Xu T, Stewart KM, Wang X, Liu K, Xie M, Kyu Ryu J, Li K, Ma T, Wang H, Ni L, et al. (2017). Metabolic control of TH17 and induced Treg cell balance by an epigenetic mechanism. Nature 548, 228–233. [DOI] [PMC free article] [PubMed] [Google Scholar]
- Yao CH, Liu GY, Wang R, Moon SH, Gross RW, and Patti GJ (2018). Identifying off-target effects of etomoxir reveals that carnitine palmitoyltransferase I is essential for cancer cell proliferation independent of beta-oxidation. PLoS Biol 16, e2003782. [DOI] [PMC free article] [PubMed] [Google Scholar]
- Yin Y, Choi SC, Xu Z, Perry DJ, Seay H, Croker BP, Sobel ES, Brusko TM, and Morel L (2015). Normalization of CD4+ T cell metabolism reverses lupus. Sci Transl Med 7, 274ra218. [DOI] [PMC free article] [PubMed] [Google Scholar]
- Young KE, Flaherty S, Woodman KM, Sharma-Walia N, and Reynolds JM (2017). Fatty acid synthase regulates the pathogenicity of Th17 cells. J Leukoc Biol 102, 1229–1235. [DOI] [PMC free article] [PubMed] [Google Scholar]
- Zuniga LA, Shen WJ, Joyce-Shaikh B, Pyatnova EA, Richards AG, Thom C, Andrade SM, Cua DJ, Kraemer FB, and Butcher EC (2010). IL-17 regulates adipogenesis, glucose homeostasis, and obesity. J Immunol 185, 6947–6959. [DOI] [PMC free article] [PubMed] [Google Scholar]
Associated Data
This section collects any data citations, data availability statements, or supplementary materials included in this article.
Supplementary Materials
Table S3. Related to Figure 4. Complete AMPK mRNA array data for ND and T2D PBMCs stimulated for 40 hrs with αCD3/CD28 in the presence or absence of glucose, N=4 per group.
Data Availability Statement
All data are available herein or upon request to the corresponding author.
The data sets generated and analyzed during the study are included with the published manuscript (and supplementary information). All other data are available from the corresponding author upon request.