Abstract
A dramatic increase in the accuracy and statistics of space-borne cosmic ray (CR) measurements has yielded several breakthroughs over the last several years. The most puzzling is the rise in the positron fraction above ~10 GeV over the predictions of the propagation models assuming pure secondary production. The accuracy of the antiproton production cross section is critical for astrophysical applications and searches for new physics since antiprotons in CRs seem to hold the keys to many puzzles including the origin of those excess positrons. However, model calculations of antiproton production in CR interactions with interstellar gas are often employing parameterizations that are out of date or are using outdated physical concepts. This may lead to an incorrect interpretation of antiproton data which could have broad consequences for other areas of astrophysics. In this work, we calculate antiproton production in pp-, pA-, and AA-interactions using EPOS-LHC and QGSJET-II-04, two of the most advanced Monte Carlo (MC) generators tuned to numerous accelerator data including those from the Large Hadron Collider (LHC). We show that the antiproton yields obtained with these MC generators differ by up to an order of magnitude from yields of parameterizations commonly used in astrophysics.
Keywords: astroparticle physics, cosmic rays, elementary particles, ISM: general
1. INTRODUCTION
Antiprotons in cosmic rays (CR) are produced in CR interactions with interstellar gas and are, therefore, called secondary. The same interactions produce charged and neutral mesons that decay to secondary electrons and positrons and γ-rays. However, in contrast to CR positrons that can be produced copiously in pulsars, there is no known astrophysical source of primary antiprotons. Since the antiproton “background” is fairly low, this provides an opportunity to search for a new phenomenon or an exotic signal if the CR antiproton flux is measured accurately. An even smaller background is expected for antideuterons, which provide, therefore, another target in searches for new physics (Chardonnet et al. 1997; Donato et al. 2000).
The first detections of antiprotons in CRs were reported 35 yr ago by Bogomolov et al. (1979) and Golden et al. (1979). Both experiments reported a flux that was a factor of ~3 above expectations (Gaisser & Levy 1974) and caused a stir at that time even though the reported excess was only at the ~3σ level. Now it is clear that these measurements and a followup measurement by Buffington et al. (1981) were likely plagued by a background of negatively charged particles. Meanwhile, these measurements stimulated an intensive discussion about the possiblity to observe primary antiprotons produced in exotic processes, such as the annihilation of primordial black holes or dark matter in the Galactic halo (Szabelski et al. 1980; Kiraly et al. 1981; Silk & Srednicki 1984; Carr 1985; Ellis et al. 1988; Rudaz & Stecker 1988; Stecker & Tylka 1989; Jungman & Kamionkowski 1994; Chardonnet et al. 1996; Jungman et al. 1996; Maki et al. 1996).
Subsequent flights by the MASS91 (Hof et al. 1996), CAPRICE98 (Boezio et al. 2001), and most notably the BESS and BESS-Polar (1993–2008) (Orito et al. 2000; Abe et al. 2012) experiments made a set of accurate measurements that motivated also new attempts to make more accurate theoretical evaluations of the flux of secondary antiprotons produced in CR interactions with interstellar gas. As a result, it has become clear that the measured antiproton flux and ratio are generally consistent with the secondary antiproton production (Gaisser & Schaefer 1992; Bottino et al. 1998; Moskalenko et al. 1998; Simon et al. 1998; Bergström et al. 1999; Bieber et al. 1999; Donato et al. 2001; Moskalenko et al. 2002), but do not rule out the possibility of a weak exotic signal.
More realistic calculations involving the fully numerical CR propagation model GALPROP (Strong & Moskalenko 1998; Strong et al. 2007) have shown that the predicted flux depends on the assumed propagation model (Moskalenko et al. 2002), even though the propagation parameters were derived from fits to the B/C and 10Be/9Be ratios and the CR fluxes were tuned to local measurements (Strong et al. 2007). In particular, a standard stochastic reacceleration model was found to under-produce antiprotons by ~40% at 3 GeV, while a semi-empirical plain diffusion model overproduces them by ~20%. A diffusion–convection model was found to be consistent with BESS 95–97 data. The origin of the remarkable discrepancy with the predictions of the physically motivated reacceleration model remained unclear, but it was natural to blame the model deficiency rather than to declare an exotic signal. One of the possibilities to reconcile the model predictions with the data is to assume that some fraction of carbon and other primary nuclei at low energies is local (Moskalenko et al. 2003). In this case the appropriate decrease in the derived diffusion coefficient increases the production of antiprotons, enough to reproduce the data. Another solution is to account for the back reaction of CR protons onto the interstellar turbulence (Ptuskin et al. 2006). The stochastic acceleration of CRs by MHD waves is accompanied by the so-called damping of the waves, since the wave energy is dissipated. This also leads to the effective decrease in the diffusion coefficient at a few GV that increases the antiproton production.
Recent discoveries in astrophysics of CRs, however, have changed the landscape dramatically. The most important was a clear confirmation of the rise4 in the positron fraction by PAMELA (Adriani et al. 2009a, 2013a) that was earlier noticed by the HEAT collaboration (Beatty et al. 2004). This was subsequently confirmed and extended to higher energies by Fermi-LAT (Ackermann et al. 2012), and measured with even greater precision and extended to even higher energies by AMS-02 (Aguilar et al. 2013). Most recently, the measurement of the positron fraction has been extended up to 500 GeV by the AMS-02 collaboration hinting for some flattening of the fraction above 200 GeV (Accardo et al. 2014), but the statistics is still low in this energy range. New accurate antiproton measurements were done by PAMELA (Adriani et al. 2009b, 2010, 2013b) covering the range from 70 MeV to 200 GeV, and more is expected from AMS-02. Above a few GeV, the data are consistent with secondary production, in strong contrast with positron results. Another important milestone is an accurate measurement of the B/C ratio up to 100 GeV/nucleon by PAMELA (Adriani et al. 2014) that is consistent with preliminary AMS-02 measurements5 reaching ~400 GeV/nucleon. Both measurements indicate the index of the diffusion coefficient α ≈ 0.4 or even smaller (Adriani et al. 2014) that supports a Kolmogorov-type power spectrum of interstellar turbulence (Kolmogorov 1941), thus favoring the stochastic reacceleration model for interstellar propagation. Besides providing more accurate data over a wider energy range these new measurements give an important insight into CR acceleration and propagation processes. Also relevant, but controversial are the new measurements of CR proton and He spectra, the most abundant CR species. Combined measurements by PAMELA (Adriani et al. 2011), ATIC (Panov et al. 2009), and CREAM (Ahn et al. 2010) hint on a break in both spectra at about the same rigidity ~230 GV. The flattening of the CR proton spectrum at high energies was also confirmed by the Fermi-LAT through observations of γ-ray emission of the Earth’s limb (Ackermann et al. 2014). However, preliminary results by AMS-02 (see footnote 5) do not show any feature in the CR proton and He spectra up to ~2 TV.
Antiproton data and their correct interpretation hold the key to the resolution of many astrophysical puzzles. If the rise in the positron fraction is due to weakly interacting massive particle (WIMP) annihilations, antiproton data provide important constraints on WIMP models (Cirelli et al. 2009; Donato et al. 2009), for a review, see Porter et al. (2011). If the rise is due to conventional astrophysics, antiproton and B/C measurements extended to higher energies may be able to discriminate between the pulsar (Arons 1981; Harding & Ramaty 1987; Boulares 1989; Hooper et al. 2009; di Mauro et al. 2014a) and the supernova remnant (SNR) hypotheses (Berezhko et al. 2003; Blasi 2009). The latter proposes a secondary component with a hard energy spectrum that is produced in an SNR shock by accelerated protons. It also predicts a rise in all secondaries, such as the and B/C ratios, at high energies (Berezhko et al. 2003; Blasi & Serpico 2009; Cholis & Hooper 2014; Mertsch & Sarkar 2014). However, other authors (Kachelrieß et al. 2011; Kachelrieß & Ostapchenko 2013) pointed out that the results of their time-dependent Monte Carlo (MC) simulations predict a flattening rather than a distinct rise.
The accuracy of the antiproton production cross section is critical for astrophysical applications and searches for new physics. This is especially true in view of many expectations connected with the upcoming data releases by the AMS-02 experiment operating at the International Space Station, and by soon-to-be-launched ISS-CREAM,6 CALET,7 and GAPS8 experiments. This holds even more for new opportunities that would open up with antideuteron detection in CRs. In turn, the calculation of antideuteron production relies on the inclusive antiproton production cross sections and the detailed knowledge of two-particle correlations (Kadastik et al. 2010; Dal & Kachelrieß, 2012).
In this work, we analyze antiproton production in pp-, pA-, and AA-interactions using EPOS-LHC and QGSJET-II-04, two of the most advanced MC generators tuned to numerous accelerator data including those from the Large Hadron Collider (LHC). The antiproton yields obtained with these MC generators differ by a factor of few from yields of parameterizations commonly used in astrophysics. The article is structured as follows: in Section 2, we compare the pros and cons of parameterizations and MC generators developed specifically for CR interactions at low- and high-energies. In Section 3, we present a tune of the fragmentation procedure used in the QGSJET-II-04 model which leads to an improved description of particle production at low energies in the presence of high-energy thresholds, as in the case of antiprotons. Then we compare in Section 4 the results of the modified QGSJET-II-04 and the EPOS-LHC models to experimental data and to the predictions of the parameterizations of Tan & Ng (1983) and Duperray et al. (2003). Finally, we discuss the nuclear enhancement of the yield by nuclear species in Section 5 before we conclude.
2. PRODUCTION: MODELS AND PARAMETERIZATIONS
Calculations of secondary CR fluxes, both for astrophysical applications and searches for new physics, are typically based on empirical parameterizations of accelerator data for the production spectra of secondary particles in proton–proton interactions. Despite the evident convenience of using such parameterizations, this practice has a number of caveats. First of all, one has to rely on empirical scaling laws when these parameterizations are extrapolated outside of the kinematic range of the data they are based on. In particular, the high energy extrapolations of existing parameterizations prove to be unreliable, as we will demonstrate in the following. This failure partly reflects the scarcity of relevant experimental data and the poor theoretical understanding of the high energy behavior of hadronic collisions at the time when the scaling laws used as input were developed. Second, it is problematic to account for the contributions of nuclear species in CRs and/or in the interstellar medium (ISM) using such parameterizations: while particle production in proton–nucleus collisions has been studied by a number of fixed target accelerator experiments, yielding the spectra of secondaries in the forward hemisphere in the center-of-mass system (c.m.s.), there is practically no experimental information on the forward particle spectra in nucleus–proton and nucleus–nucleus collisions. One usually attempts to solve the problem by introducing empirical “nuclear enhancement” factors, which vary, however, substantially between different publications. Moreover, as it has been demonstrated in Kachelriess et al. (2014), properly calculated nuclear enhancement factors depend strongly both on the production spectra of the respective particles and on the spectral slopes of CR species.
These difficulties fully apply to the case of antiproton production by CRs, which motivated us to reconsider the problem employing MC generators of hadronic interactions. Comparing the results of a number of MC models used in low energy nuclear physics to available accelerator data, we observed strong (up to an order of magnitude) deviations from the measured spectra. Hence, we decided to turn to MC generators of high energy interactions, notably, to those used in the high energy CR field (Kalmykov et al. 1997; Ostapchenko 2006; Werner et al. 2006; Ahn et al. 2009). Our choice is motivated by the fact that such models have been calibrated on numerous accelerator data over a wide energy range and survived many consistency tests in high energy CR studies. Moreover, most of those models are in a good agreement with various data from LHC Run I (d’Enterria et al. 2011) and some of them have been recently updated (Ostapchenko 2011, 2013; Pierog et al. 2013), including a re-tuning of model parameters, based on LHC data.
However, the application of such MC generators to low energy hadronic interactions that dominate the production of secondary in the physically important range of kinetic energies ≲ 10 GeV is rather unwarranted. Such low energies imply an extrapolation of the underlying theoretical approach outside of its range of applicability: several reaction mechanisms, like contributions of Reggeon exchanges, intranuclear cascading, etc, which are important at low energies, are irrelevant for high energy interactions and are therefore typically neglected. Comparing the model predictions with experimentally measured antiproton spectra for proton–proton and proton–nucleus collisions for incident momenta plab ≲ 100 GeV c−1, we observed generally a strong disagreement with data.9 In the particular case of the QGSJET-II-04 model (Ostapchenko 2011, 2013), this disagreement was especially large close to the kinematical threshold for production. Only the EPOS-LHC model (Pierog et al. 2013) demonstrated a generally reasonable behavior in the low energy limit, as will be demonstrated in the following.
3. LOW ENERGY EXTENSION OF THE QGSJET-II MODEL
The results of EPOS-LHC and QGSJET-II-04 for production are rather similar in the high energy range where both MC generators are tuned to LHC data, but deviate strongly in the low energy limit. At first sight, this seems surprising because their treatment of hadronic interactions at relatively low collision energies is very similar. The common underlying physics includes multiple scattering processes, which are described within the Reggeon Field Theory framework (Gribov 1968) by multiple exchanges of Pomerons, i.e., composite states with vacuum quantum numbers. Particle production is treated as the formation and break-up of strings of color field, which is performed using string fragmentation. However, the procedures used in the two models to fragment color strings differ, and these differences are responsible for the discussed variations at low energies. Since QGSJET-II-04 reproduces well pion and photon production data down to rather low energies, plab ~ 10 GeV c−1 (Kachelrieß & Ostapchenko 2012), it is natural to suspect that the discrepancies in production are caused by threshold effects related to the relatively high antiproton mass.
These observations motivated us to improve the low energy behavior of QGSJET-II, modifying its string fragmentation procedure. It is worth stressing that we did not aim at the development of a full-scale model for low energy hadronic collisions. Instead, we intended a more reliable extrapolation of the current model toward low energies—in order to reach an acceptable agreement with experimental data in the energy range relevant for calculations of the CR antiproton flux. In particular, the modifications introduce no additional adjustable parameters. They only modify slightly the string fragmentation algorithm, in such a way that the changes have no significant influence on the results in the high energy range.
To describe these modifications in some more detail, let us briefly discuss the hadronization procedure used in QGSJET-II. The standard physics picture for the string break-up is the neutralization of the color field via the creation of quark–antiquark and diquark–antidiquark pairs from the vacuum, followed by their conversion into final-state hadrons (Andersson et al. 1983). In QGSJET-II, this process is modeled using an iterative procedure (Kalmykov & Ostapchenko 1993), whose parameters are determined by the intercepts of the corresponding Regge trajectories (Kaidalov 1987). After creating a new quark–antiquark (diquark–antidiquark) pair, a hadron is formed and the reminder of the string proceeds to the next step: depending on the string mass, either the same procedure is repeated or a two-particle decay is modeled. In the new treatment, we introduced an additional weight into the sampling process of kinematic variables for each subsequent string break-up, which is proportional to the two-particle decay phase volume evaluated for the mass squared of the reminder of the string. While being of minor importance for high mass strings, stretched over long rapidity intervals, which are typically produced in high energy collisions, this modification enhances the production of light hadrons (mostly pions) in the fragmentation of strings of small masses, at the expense of the heavier hadrons. Additionally, the parameters of the hadronization procedure, notably the string mass threshold for proceeding to a two-particle decay and the relative probabilities for creating quark–antiquark and diquark–antidiquark pairs from the vacuum, have been readjusted in order to stay in agreement with high energy data.
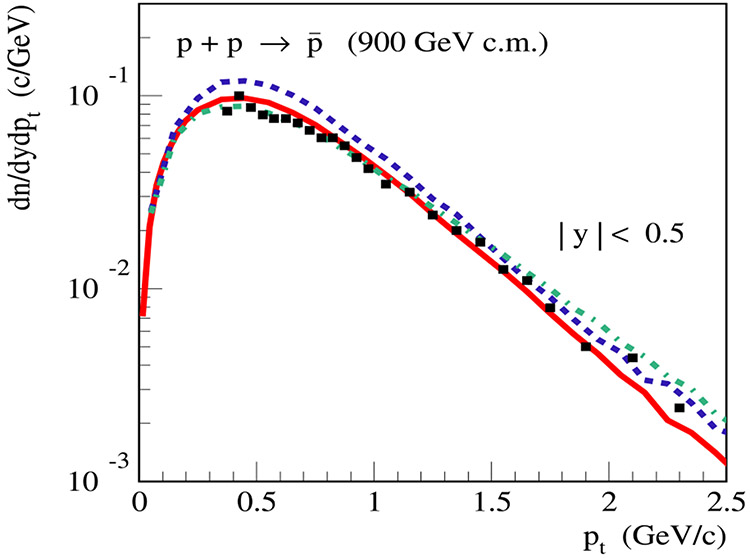
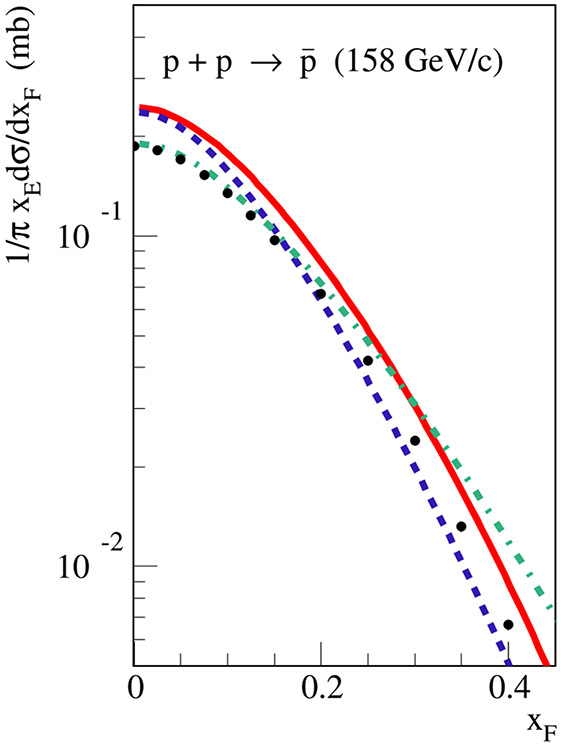
In Figures 1 and 2, we compare the results of the modified QGSJET-II model (hereafter referred to as QGSJET-IIm) and the EPOS-LHC model with selected benchmark accelerator data.10 The data shown in Figure 1 are the momentum spectra of in the laboratory frame in pp-collisions and p Be-collisions at plab = 19.2 GeV c−1 (Allaby et al. 1970; Amaldi et al. 1975) for different angles θ in the laboratory frame. The data shown in Figure 2 are the Feynman x-spectra of antiprotons, 1/πxEdσ/dxF, where , , with E* and being the c.m.s. energy and the z-component of the momentum, in pp- and p C-collisions at plab = 158 GeV c−1 (Anticic et al. 2010; Baatar et al. 2013). In addition, to demonstrate that the introduced modifications have not spoiled the treatment of high energy interactions, we compare in Figure 3 the calculated transverse momentum spectrum of antiprotons in pp-collisions at = 900 GeV with the data of the ALICE experiment (Aamodt et al. 2011). As can be judged from the figures, there is a reasonable overall description of -production over a wide energy range. The differences with the results of the EPOS-LHC model can be used as a measure for model uncertainties in the calculations of secondary antiproton spectrum using QCD MC generators. For comparison, we plot in Figures 2 and 3 also the results obtained using the original QGSJET-II-04 model. At = 900 GeV, the differences between the models QGSJET-IIm and QGSJET-II-04 are pretty small. On the other hand, at lower energies there is a significant reduction of the antiproton yield predicted by QGSJET-IIm, which reaches ≃20% already at 158 GeV c−1.
Figure 1.
Momentum spectra of in the laboratory frame in pp-collisions (left) and p Be-collisions (right) at plab = 19.2 GeV c−1, for different angles θ in the laboratory frame (as indicated in the plots), calculated using QGSJET-IIm (solid, red) and EPOS-LHC (dashed, blue). The experimental data—Allaby et al. (1970) and Amaldi et al. (1975).
Figure 2.
Feynman x-spectra of antiprotons, 1/π xEdσ/dxF (see the text for definition), in pp (left) and p C (right) collisions at plab = 158 GeV c−1. calculated using QGSJET-IIm (solid, red), EPOS-LHC (dashed, blue), and QGSJET-II-04 (dotted–dashed, green), in comparison with NA49 data (Anticic et al. 2010; Baatar et al. 2013).
Figure 3.
Transverse momentum spectra of at central rapidity in c.m.s. (∣y∣ < 0.5) in pp-collisions at = 900 GeV, calculated using QGSJET-IIm (solid, red), EPOS-LHC (dashed, blue), and QGSJET-II-04 (dotted–dashed, green), in comparison with ALICE data (Aamodt et al. 2011).
4. Z—FACTORS FOR PRODUCTION: COMPARISON OF MODEL PREDICTIONS
To compare the impact of different interaction models and parameterizations on the predicted CR antiproton spectrum, it is convenient, similarly to the γ-ray case (Kachelriess et al. 2014), to use the corresponding “Z-factors.” They are defined as the spectrally averaged energy fraction transferred to antiprotons in proton–proton, proton–nucleus, nucleus–proton, or nucleus–nucleus collisions, assuming that the spectra of CR species in the relevant energy range can be approximated by a power-law, Ii(E) = Ki E−αi. Then the contribution to the flux of secondary CRs (here, antiprotons) from interactions of the CR species i with ISM component j (i, j = protons or nuclei) of number density nj,
| (1) |
can be rewritten as (Kachelriess et al. 2014)
| (2) |
Here, we expressed the Z-factor via the inclusive spectra of antiprotons , as
| (3) |
Note that E corresponds to the energy per nucleon for nuclear projectiles.
The Z-factors clearly depend both on the production spectra and on the spectral slopes αi, containing all the dependences on hadronic interaction models. On the other hand, these factors are independent of the CR abundances. Using two different interaction models, M1 and M2, the ratio of the respective contributions to the secondary fluxes equals the ratio of the corresponding Z-factors (see Equation (2)):
| (4) |
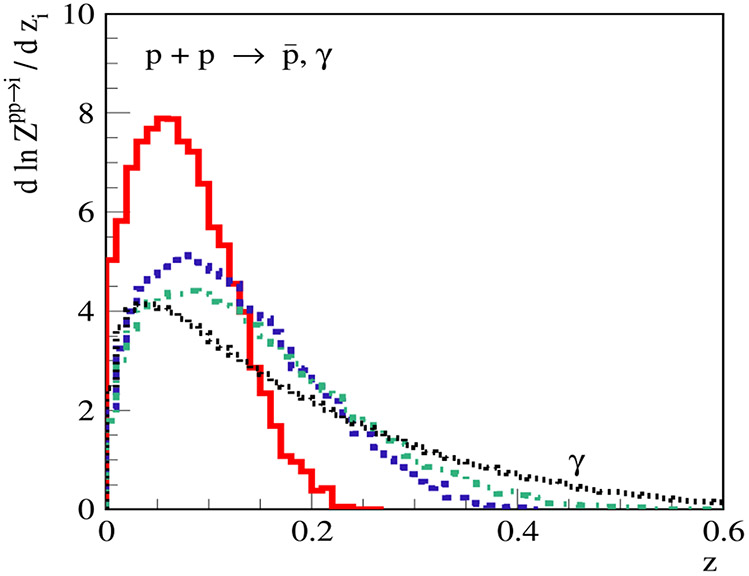
In the following, we are going to compare the factors obtained with the modified QGSJET-IIm model and with EPOS-LHC to the Z-factors calculated using some widely used parameterizations of -spectra for pp-collisions. However, before doing so, let us investigate which projectile energies contribute mainly to . To this end, we plot in Figure 4 the spectrally weighted (for definiteness, we use α = 2.6) distribution of the energy fraction transferred to antiprotons
| (5) |
for different kinetic energies . For comparison, the same distribution for γ-ray production, , is also shown. Clearly, the range of CR proton energies which contributes significantly to antiproton production is substantially narrower compared to the γ-ray case. Since the spectrum is much softer than that of gammas, the region of moderately large z contributes much less to the production of than to the production of γ’s. Additionally, the distribution becomes substantially narrower with decreasing , which is a consequence of both threshold effects and the interaction kinematics: for small , the region of not too small becomes kinematically forbidden, because the corresponding proton energy falls below the production threshold. On the other hand, the contribution of the region is strongly suppressed by the spectral factor , see Equation (5). Moreover, for a given CR proton energy E, antiprotons are produced most copiously in the c.m.s. central region (xF ~ 0), which corresponds to in the lab. frame (where mN is the nucleon mass). Thus, the region corresponds to the target fragmentation region in the c.m.s., while corresponds to the kinematic boundary (xF → −1 in c.m.s.), where the spectrum falls down rapidly. This can be clearly seen in Figure 2(right) for the case of proton–carbon collisions.
Figure 4.
Distribution of spectrum-weighted (α = 2.6) energy fraction zi = (i = , γ). For antiprotons, the distribution of is shown for different energies = 1 GeV (solid, red), 3 GeV (dashed, blue), and 10 GeV (dotted–dashed, green). A similar distribution for zγ = Eγ/E for the case of γ-ray production is shown for Eγ = 10 GeV by the dotted, black line marked “γ.”
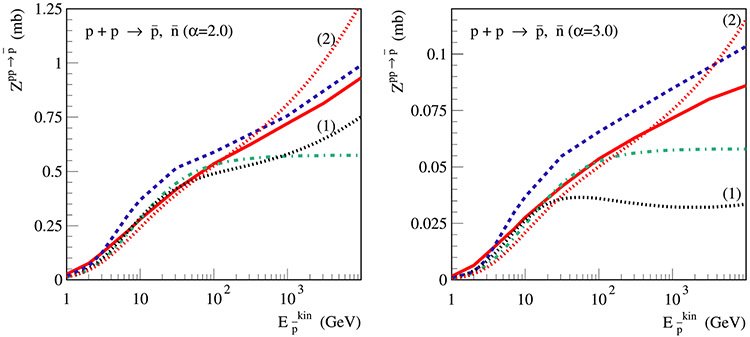
The calculated energy dependence of the Z-factors for production,11 , is compared in Figure 5 for QGSJET-IIm, EPOS-LHC, and the parameterizations from Tan & Ng (1983) and Duperray et al. (2003). We consider two values, α = 2 and α = 3, for the slope of the CR proton spectrum, which bracket the physically most interesting range.
Figure 5.
Energy dependence of Z-factors for and production, (plotted as a function of ), for α = 2 (left) and α = 3 (right), as calculated with QGSJET-IIm (solid, red) and EPOS-LHC (dashed, blue), or using the parameterizations by Tan & Ng (1983; dotted–dashed, green) and Duperray et al. (2003) (dotted; the lines marked “(1)” (black) and “(2)” (red) correspond to the respective parameter sets).
Comparing first the results of QGSJET-IIm and EPOS-LHC, we observe a relatively good agreement between them in the high energy range for α = 2, while somewhat larger differences are obtained for a steeper slope (α = 3) and for ≲ 100 GeV. This is due to the harder production spectra predicted by EPOS-LHC (see Figures 1, 2, and 10). However, the results for the two MC generators show a reasonable overall agreement and, as already stated, the remaining differences can be used as a measure for the model uncertainties.
Next we consider differences between the modified QGSJET-IIm model and the parameterized spectra from Tan & Ng (1983) and Duperray et al. (2003). In the energy range , where the relevant proton–proton interactions are covered by fixed target experiments, the spectra calculated with these parameterizations agree approximately with those obtained using QGSJET-IIm. However, at higher energies the parameterized results of Tan & Ng (1983) and Duperray et al. (2003) are rather unreliable, which is best illustrated by the large difference between the Z-factors calculated using the two parameter sets proposed by Duperray et al. (2003). Not surprisingly, the differences increase for larger α due to the stronger sensitivity to the forward -production spectra which are less constrained by experimental data.
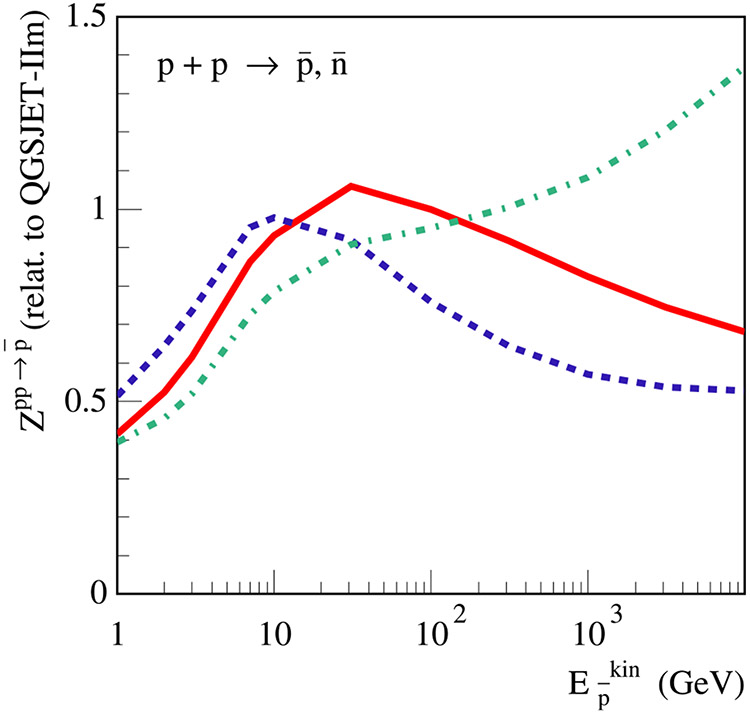
To get a better idea of these differences, we plot in Figure 6 the ratio of Z-factors calculated with QGSJET-IIm and with the three parameterizations considered. One immediately notices a sizeable enhancement of the yield in the former case for ≲ 10 GeV. The differences with the results obtained using the parameterizations of Tan & Ng (1983) and Duperray et al. (2003) reach a factor of two for ≃ 1 GeV and originate from the treatment of production close to the kinematic threshold (see Figure 4), which is rather weakly constrained by available experimental data. Thus, these differences may be regarded as characteristic uncertainties for calculations of the -yield in this low energy range.
Figure 6.
Ratios of Z-factors for and production, , obtained using various parameterizations of -spectra, to the Z-factor calculated with QGSJET-IIm, for α = 2.6: solid red—Tan & Ng (1983), dashed blue—set 1 of Duperray et al. (2003), dotted–dashed green—set 2 of Duperray et al. (2003).
More importantly, for ≳ 100 GeV, the results obtained using the parameterizations of Tan & Ng (1983) and Duperray et al. (2003) start to diverge strongly from the results based on QGSJET-IIm, as can be clearly seen in Figures 5 and 6. For instance, using the -production spectra from Tan & Ng (1983), which is the standard reference for astrophysical applications, one observes that the respective becomes practically energy-independent for ≳ 100 GeV (see Figure 5), which is a consequence of the scaling picture used in their ansatz. However, the assumed scaling behavior for the inclusive particle production spectra is explicitly broken by the energy rise of the inelastic pp cross section , which has been firmly established by numerous accelerator experiments from fixed target experiments to those at the LHC. Moreover, the Z-factors for -production are rather sensitive to the central region in the c.m.s., because the -production spectrum in pp-collisions is soft. In this region, the particle density rises quicker than , namely, as a power law (see, e.g., the discussion in d’Enterria et al. 2011). The resulting enhancement of -production by high-energy CRs, as shown by the ratio of the respective Z-factors, is quite significant and may have an important impact on the interpretations of all sorts of CR data, not only , by the PAMELA and AMS2 experiments in this energy region (see e.g., Berezhko et al. 2003; Blasi 2009; Blasi & Serpico 2009; Hooper et al. 2009; Kachelrieß et al. 2011; Porter et al. 2011; Kachelrieß & Ostapchenko 2013; di Mauro et al. 2014a; Cholis & Hooper 2014; Mertsch & Sarkar 2014).
Both parameterizations proposed by Duperray et al. (2003) are based on the erroneous ansatz of Letaw et al. (1983) for and , i.e., they assume that the inelastic cross section is constant for ≳ 1 GeV. The additional assumptions made by Duperray et al. (2003) about the energy dependence of the very forward part of -production spectra, which are responsible for the huge variations between the two parameterizations (Figure 5), are also questionable as we discuss in more detail in Appendix B.
5. NUCLEAR ENHANCEMENT
Now we proceed with calculating the nuclear enhancement of the -yield due to contributions of nuclear species in CRs and of the helium component in the ISM. As follows from Equation (2) and the more detailed discussion by Kachelriess et al. (2014), the respective partial enhancements compared to the yield from pp-interactions are proportional to the corresponding Z-factors,
| (6) |
In particular, contributions of CR nuclei may be additionally enhanced, if the spectral indices αi < αp, because of the strong α-dependence of the Z-factors (Kachelriess et al. 2014).
As follows from the general analysis (Kachelriess et al. 2014), in the limit of high energies and large α, one expects the following simple relations to hold,
| (7) |
| (8) |
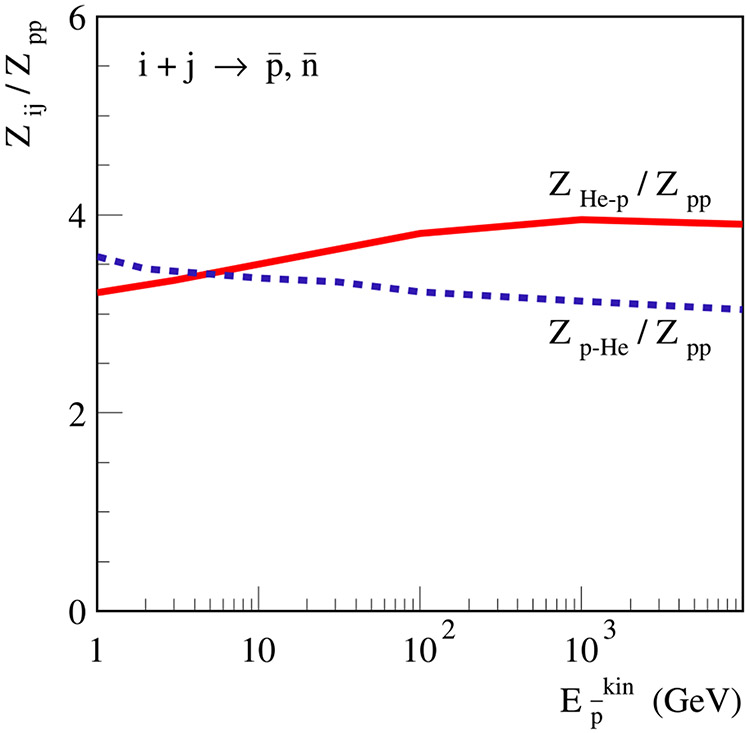
However, as illustrated in Figure 7 for the case of He-p and p-He collisions, at finite energies and for realistic spectral slopes these relations are strongly modified by threshold effects related to the relatively large antiproton mass. Indeed, the ratio approaches the asymptotic value 4 very slowly. Due to the soft -spectrum, up to rather high energies, remains sensitive to -production in the backward c.m.s. region where the discussed “A-enhancement” does not hold. The same effect is partly responsible for the rise of the ratio for decreasing as can be seen in Figure 7. As discussed in the previous section, for small the contribution of the forward c.m.s. region (moderately large ) is substantially reduced by threshold effects. As a consequence, the relative contribution of the backward c.m.s. region is increased, resulting in a “A-enhancement” of the -yield in pA-collisions. As the bottom line, we conclude that the nuclear enhancement of -production is strongly energy dependent in the kinematic range relevant for astrophysical applications. Hence, the use of a constant “nuclear enhancement factor” for calculations of CR antiproton spectra is difficult to justify.
Figure 7.
Energy dependence of the enhancement of the He p (solid, red) and p He (dashed, blue) contributions to the antiproton spectrum, relative to the pp-case, (plotted as a function of ), for α = 2.6.
In Table 1, we collect the calculated Z-factors for different , slopes α, and different combinations of CR and ISM nuclei. These results may be used for the calculation of secondary antiproton spectra when the partial spectra of CR mass groups can be approximated by a power law behavior in the corresponding energy range. As an illustration, we have calculated the energy dependence of the nuclear enhancement factor for production, , with defined in Equation (6), in the energy range =10 GeV–10 TeV, using the high energy limit of the parameterization for the spectra of CR species by Honda et al. (2004); the respective parameters Ki and αi are given in Table 2 for convenience. In contrast to all previous calculations, our results for , presented in Table 3, indicate a strong energy rise of the nuclear enhancement for secondary antiprotons, which reaches a factor of two for ≃ 1 TeV. For this particular parameterization of the spectra of CR species by Honda et al. (2004), the energy dependence of the nuclear enhancement factor can be described by a power-law, ≈ 1.58 × (E/GeV)0.034.
Table 1.
Z-factors for ( + ) Production, , Calculated with QGSJET-IIm
| (mb) | ||||||||
|---|---|---|---|---|---|---|---|---|
| (GeV) | Projectile Nucleus | Target Nucleus | α = 2 | α = 2.2 | α = 2.4 | α = 2.6 | α = 2.8 | α = 3 |
| 1 | p | p | 0.0254 | 0.0138 | 0.00772 | 0.00441 | 0.00258 | 0.00153 |
| 1 | He | p | 0.0808 | 0.0442 | 0.0248 | 0.0143 | 0.00838 | 0.00501 |
| 1 | CNO (A = 14) | p | 0.184 | 0.101 | 0.0567 | 0.0326 | 0.0192 | 0.0115 |
| 1 | Mg–Si (A = 25) | p | 0.273 | 0.150 | 0.0845 | 0.0486 | 0.0286 | 0.0171 |
| 1 | Fe (A = 56) | p | 0.447 | 0.245 | 0.138 | 0.0792 | 0.0465 | 0.0278 |
| 1 | p | He | 0.0919 | 0.0498 | 0.0277 | 0.0158 | 0.00920 | 0.00546 |
| 1 | He | He | 0.271 | 0.147 | 0.0824 | 0.0472 | 0.0276 | 0.0165 |
| 1 | CNO (A = 14) | He | 0.649 | 0.352 | 0.196 | 0.112 | 0.0654 | 0.0389 |
| 1 | Mg–Si (A = 25) | He | 0.933 | 0.506 | 0.282 | 0.161 | 0.0937 | 0.0556 |
| 1 | Fe (A = 56) | He | 1.53 | 0.834 | 0.468 | 0.269 | 0.158 | 0.0944 |
| 10 | p | p | 0.279 | 0.164 | 0.100 | 0.0633 | 0.0413 | 0.0276 |
| 10 | He | p | 0.979 | 0.573 | 0.350 | 0.222 | 0.144 | 0.0964 |
| 10 | CNO (A = 14) | p | 2.67 | 1.58 | 0.978 | 0.624 | 0.410 | 0.276 |
| 10 | Mg–Si (A = 25) | p | 4.22 | 2.50 | 1.54 | 0.977 | 0.639 | 0.428 |
| 10 | Fe (A = 56) | p | 7.78 | 4.63 | 2.87 | 1.84 | 1.21 | 0.815 |
| 10 | p | He | 0.970 | 0.560 | 0.339 | 0.213 | 0.138 | 0.0917 |
| 10 | He | He | 3.16 | 1.83 | 1.11 | 0.695 | 0.449 | 0.298 |
| 10 | CNO (A = 14) | He | 9.16 | 5.33 | 3.24 | 2.04 | 1.32 | 0.875 |
| 10 | Mg–Si (A = 25) | He | 14.5 | 8.45 | 5.16 | 3.26 | 2.12 | 1.41 |
| 10 | Fe (A = 56) | He | 26.0 | 15.2 | 9.31 | 5.90 | 3.85 | 2.57 |
| 100 | p | p | 0.535 | 0.308 | 0.187 | 0.119 | 0.0789 | 0.0536 |
| 100 | He | p | 2.03 | 1.17 | 0.715 | 0.455 | 0.300 | 0.204 |
| 100 | CNO (A = 14) | p | 6.21 | 3.61 | 2.20 | 1.40 | 0.926 | 0.628 |
| 100 | Mg–Si (A = 25) | p | 10.6 | 6.19 | 3.79 | 2.42 | 1.60 | 1.09 |
| 100 | Fe (A = 56) | p | 21.8 | 12.7 | 7.80 | 4.99 | 3.30 | 2.25 |
| 100 | p | He | 1.79 | 1.02 | 0.612 | 0.385 | 0.251 | 0.169 |
| 100 | He | He | 6.41 | 3.66 | 2.21 | 1.39 | 0.914 | 0.619 |
| 100 | CNO (A = 14) | He | 20.8 | 11.9 | 7.15 | 4.50 | 2.94 | 1.98 |
| 100 | Mg–Si (A = 25) | He | 35.2 | 20.2 | 12.2 | 7.69 | 5.04 | 3.40 |
| 100 | Fe (A = 56) | He | 72.0 | 41.3 | 24.9 | 15.7 | 10.2 | 6.87 |
| 1000 | p | p | 0.721 | 0.410 | 0.248 | 0.158 | 0.105 | 0.0715 |
| 1000 | He | p | 2.79 | 1.60 | 0.978 | 0.625 | 0.416 | 0.286 |
| 1000 | CNO (A = 14) | p | 8.87 | 5.12 | 3.12 | 1.99 | 1.32 | 0.903 |
| 1000 | Mg–Si (A = 25) | p | 15.3 | 8.81 | 5.37 | 3.42 | 2.27 | 1.55 |
| 1000 | Fe (A = 56) | p | 31.4 | 18.1 | 11.1 | 7.09 | 4.72 | 3.24 |
| 1000 | p | He | 2.35 | 1.32 | 0.787 | 0.495 | 0.324 | 0.221 |
| 1000 | He | He | 8.62 | 4.85 | 2.90 | 1.82 | 1.19 | 0.805 |
| 1000 | CNO (A = 14) | He | 29.0 | 16.4 | 9.81 | 6.18 | 4.05 | 2.75 |
| 1000 | Mg–Si (A = 25) | He | 48.1 | 27.0 | 16.0 | 10.0 | 6.50 | 4.36 |
| 1000 | Fe (A = 56) | He | 103 | 58.1 | 34.9 | 22.1 | 14.5 | 9.85 |
| 10000 | p | p | 0.931 | 0.516 | 0.307 | 0.193 | 0.127 | 0.0860 |
| 10000 | He | p | 3.60 | 2.02 | 1.20 | 0.754 | 0.493 | 0.334 |
| 10000 | CNO (A = 14) | p | 11.5 | 6.46 | 3.87 | 2.44 | 1.61 | 1.09 |
| 10000 | Mg–Si (A = 25) | p | 19.9 | 11.1 | 6.61 | 4.12 | 2.68 | 1.80 |
| 10000 | Fe (A = 56) | p | 41.6 | 23.4 | 13.9 | 8.72 | 5.69 | 3.84 |
| 10000 | p | He | 3.02 | 1.65 | 0.959 | 0.587 | 0.376 | 0.249 |
| 10000 | He | He | 11.1 | 6.14 | 3.61 | 2.24 | 1.46 | 0.983 |
| 10000 | CNO (A = 14) | He | 37.4 | 20.5 | 12.0 | 7.40 | 4.77 | 3.20 |
| 10000 | Mg–Si (A = 25) | He | 63.7 | 35.0 | 20.5 | 12.7 | 8.18 | 5.48 |
| 10000 | Fe (A = 56) | He | 135 | 74.5 | 43.6 | 27.0 | 17.4 | 11.6 |
Table 2.
Spectral Parameterizations for Groups of CR Nuclei (Honda et al. 2004)
| Groups of Nuclei | |||||
|---|---|---|---|---|---|
| Parameters | H (A = 1) | He (A = 4) | CNO (A = 14) | Mg–Si (A = 25) | Fe (A = 56) |
| K | 14900 | 600 | 33.2 | 34.2 | 4.45 |
| α | 2.74 | 2.64 | 2.60 | 2.79 | 2.68 |
Table 3.
Energy Dependence of the Nuclear Enhancement Factor for CR Composition given in Table 2
| (GeV) | 10 | 100 | 1000 | 10000 |
|---|---|---|---|---|
| 1.71 | 1.85 | 2.00 | 2.16 |
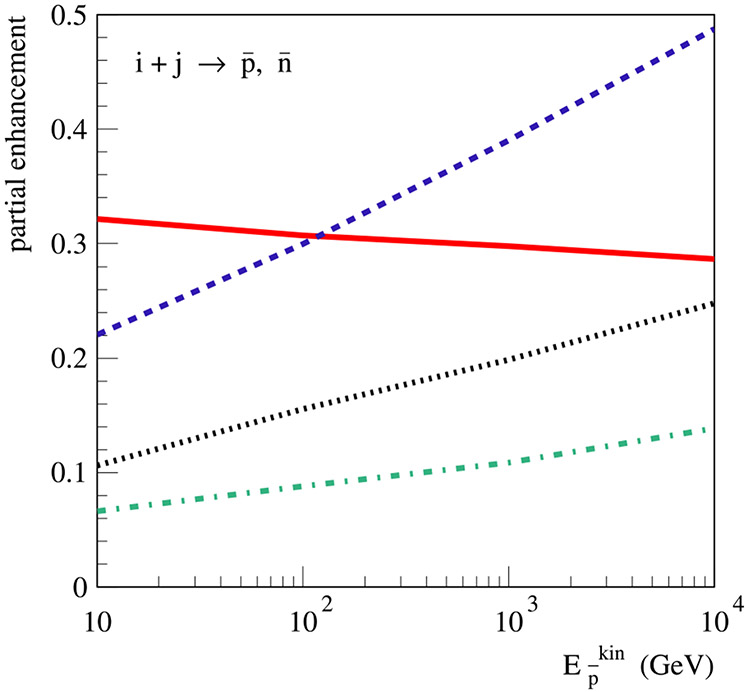
To understand better this result, we plot in Figure 8 the partial contributions to the nuclear enhancement factor from different interaction channels. One immediately notices a steep energy rise of the antiproton yield from interactions of CR helium with ISM protons. For the CR composition considered, the reason for this rise is three-fold. Apart from the trivial increase of the fraction of CR helium, the flatter helium spectrum compared to protons (αHe < αp) enhances the rise of because of the strong α-dependence of the Z-factors , α) (see Equation (6) and Table 3), as noticed previously in Kachelriess et al. (2014) for γ-ray production. Finally, the energy dependence of the Z-factors is affected by threshold effects, as we have already noticed in Figure 7. As a result, the partial contributions of CR nuclei in the region of relatively small are suppressed. This suppression diminishes at higher energies, where one approaches the asymptotic limit of Equation (7). The latter effect dominates the energy rise of the contribution of heavier nuclei (CNO, Mg–Si, and Fe), which is shown in Figure 8 by the dotted line. In contrast to expectations, their contribution is significant in the TeV range: the combined antiproton yield from interactions of the heavier nuclei with ISM protons and helium becomes at high energies comparable in magnitude with the one from the proton–helium channel.
Figure 8.
Energy dependence of partial contributions to the nuclear enhancement factor from different interaction channels: p He (solid, red), He p (dashed, blue), He He (dotted–dashed, green), and all others (dotted, black); the CR composition given in Table 2 is used.
6. CONCLUSIONS
Accurate antiproton production cross sections are a critical pre-requisite for many astrophysical applications and searches for new physics. We have used, therefore, EPOS-LHC and QGSJET-II-04, two of the most advanced MC generators which reproduce numerous accelerator data including the most recent ones from LHC, to calculate the antiproton yield in pp-interactions. In the case of QGSJET-II-04, a tune of its fragmentation procedure was required for an adequate description of particle production at low energies and high thresholds. After that, we have found that the antiproton yields of the two QCD MC generators agree reasonably well with each other and the available experimental data. Therefore, we conclude that the results of these two generators can be used to reliably predict the antiproton yield outside the energy range covered by fixed target accelerator data, ≈ 10–100 GeV. Moreover, using these MC generators it is straightforward to also calculate the antiproton yield in pA- and AA-interactions. In the limiting case, when the spectra of CR species can be approximated by a power-law, we have derived the nuclear enhancement of the -yield due to contributions of nuclear species in CRs and of the helium component in the ISM. In contrast to all previous calculations, our results indicate a strong rise of the nuclear enhancement for secondary antiprotons with energy, which reaches a factor of two for ≃ 1 TeV.
We have also compared our results obtained using EPOS-LHC and QGSJET-II-04 to the commonly used parameterizations of the antiproton yield from Tan & Ng (1983) and Duperray et al. (2003). In the energy range =10–100 GeV, where the relevant proton–proton interactions are covered by fixed target experiments, these parameterizations agree approximately with the results obtained using QGSJET-IIm. At higher energies, when these parameterizations are extrapolated outside the kinematic range constrained by experimental data, the differences increase fast, because the physical concepts used in selecting their fitting functions are incorrect. In particular, the assumed scaling behavior for the inclusive production spectra is broken by the energy rise of , invalidating their ansatz. The resulting increase of the production should be taken into account in the interpretation of CR data, especially those at E > 100 GeV expected from AMS-02, ISS-CREAM, and CALET experiments.
In the low energy domain ≲ 10 GeV, the differences between the results obtained using EPOS-LHC and QGSJET-II-04 and the parameterizations of Tan & Ng (1983) and Duperray et al. (2003) are also significant, reaching a factor of two at ≃ 1 GeV (see Figure 6). The origin of these differences can be traced to the treatment of -production close to the kinematic threshold, which is rather weakly constrained by available experimental data. Since this energy range is the most interesting for dark matter searches, additional experimental data from, e.g., the NA61 experiment are highly desirable. In the absence of these data, the uncertainty of the antiproton yield in the low-energy range should be increased, reaching ~50% at = 1 GeV.
Acknowledgments
The authors are grateful to Tanguy Pierog for useful discussions and for his help in comparing predictions of various Monte Carlo generators to accelerator data on antiproton production. IVM and SSO acknowledge support from NASA through the grants NNX13AC47G and NNX13A092G.
Appendix
APPENDIX A. COMPARISON WITH DIFFERENTIAL SPECTRA
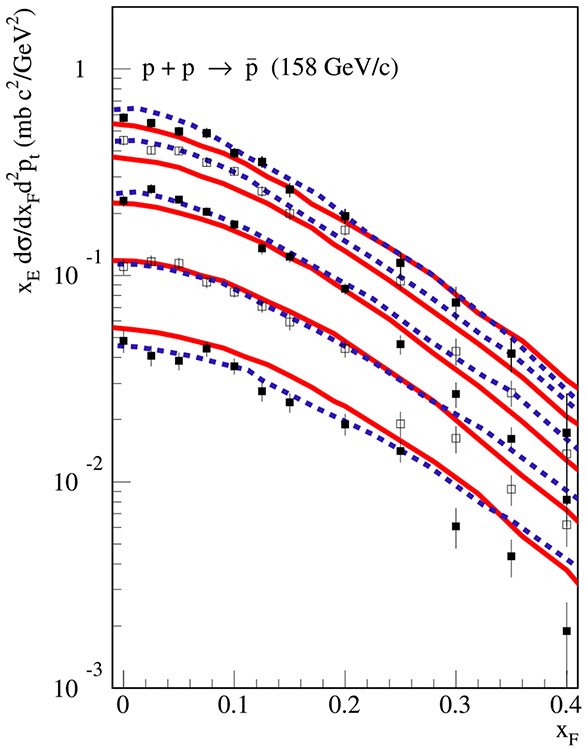
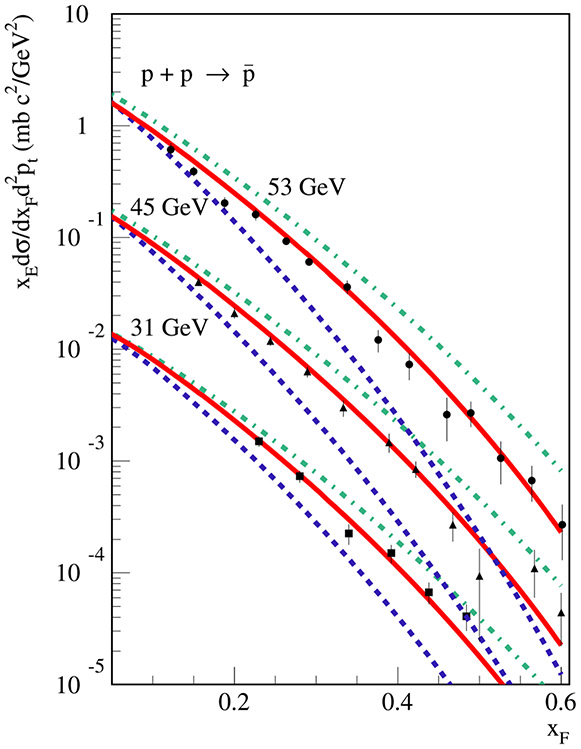
In addition to the pt-integrated spectra of for pp-collisions at 158 GeV c−1, plotted in Figure 2, we present in Figure 9 the results of QGSJET-IIm and EPOS-LHC for the respective differential spectra xE dσ/dxF/d2pt for fixed values of pt. Comparing the calculations to NA49 data (Anticic et al. 2010), we observe again a relatively good agreement, though the calculated spectra are somewhat harder than the measured ones.
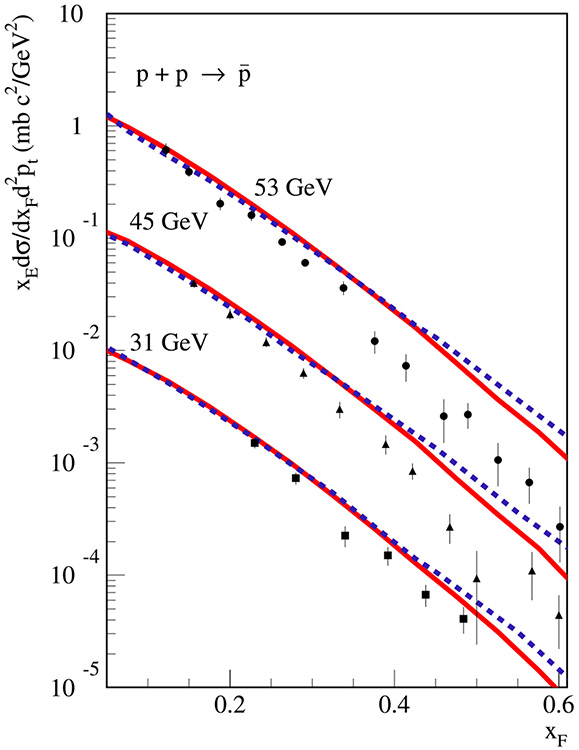
The same tendency is indicated by a comparison with data from the CERN Intersecting Storage Rings (ISR; Albrow et al. 1973) at higher energies, see Figure 10, though any definite conclusions are hampered by both the large systematic errors of the measurements and by the narrow kinematic coverage of the experiment.12
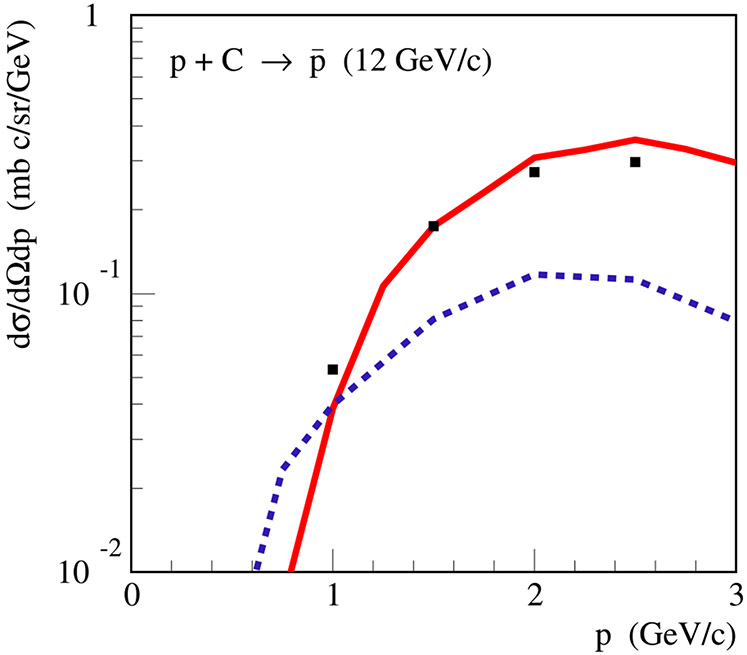
Finally, the results of the two models for the momentum spectrum of in p C-collisions at 12 GeV c−1 are compared in Figure 11 to spectrometer measurements by Sugaya et al. (1998). The good agreement of the spectrum calculated with QGSJET-IIm with the data may be regarded as an indication that the results of the model remain reasonable even when approaching the kinematic threshold for -production. However, again, the narrow kinematic coverage of the experiment does not allow one to make any definite conclusions.
Figure 9.
Feynman x-spectra of (c.m.s.) for fixed pt (from top to bottom: 0.1, 0.3, 0.5, 0.7, and 0.9 GeV) in pp-collisions at plab = 158 GeV c−1, calculated using QGSJET-IIm (solid, red) and EPOS-LHC (dashed, blue), in comparison with NA49 data (Anticic et al. 2010).
Figure 10.
Feynman x-spectra of for fixed c.m.s. angle tan θ = 2.66/ in pp-collisions at = 31 (×10−2), 45 (×10−1), and 53 GeV, calculated using QGSJET-IIm (solid, red) and EPOS-LHC (dashed, blue), in comparison with experimental data (Albrow et al. 1973).
Figure 11.
Momentum spectra of in the laboratory frame for θ = 5.1° in p C-collisions at plab = 12 GeV c−1, calculated using QGSJET-IIm (solid, red) and EPOS-LHC (dashed, blue), in comparison with experimental data (Sugaya et al. 1998).
Figure 12.
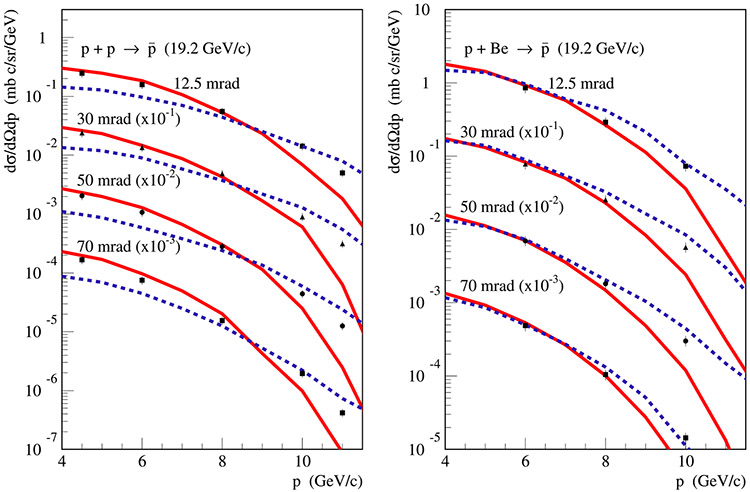
Momentum spectra of in the laboratory frame for different laboratory angles θ (as indicated in the plots) in pp-collisions at plab = 19.2 GeV c−1, calculated using parameterizations by Tan & Ng (1983) (solid, red) or by Duperray et al. (2003) (parameter set 1—dashed, blue, parameter set 2—dotted–dashed, green), in comparison with experimental data (Allaby et al. 1970; Amaldi et al. 1975).
Figure 13.
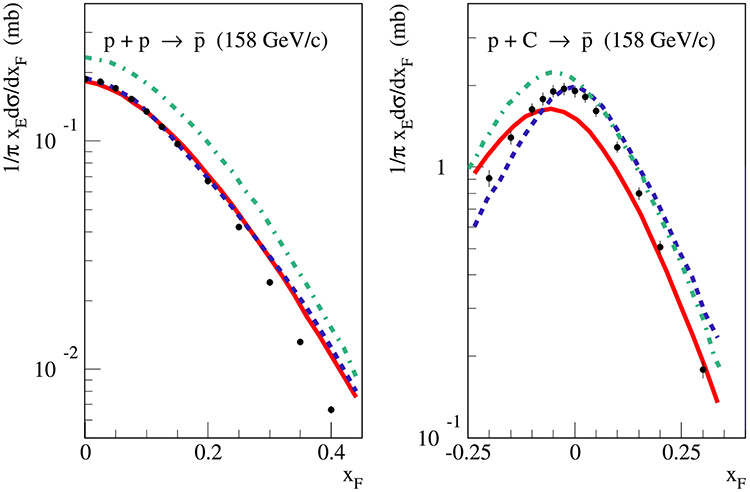
Feynman x-spectra of (c.m.s.) in pp-collisions at plab = 158 GeV c−1, calculated using parameterizations by Tan & Ng (1983) and Duperray et al. (2003), in comparison with NA49 data (Anticic et al. 2010); the lines are labeled as in Figure 12.
Figure 14.
Feynman x-spectra of for fixed c.m.s. angle tan θ = 2.66/ in pp-collisions at = 31 (×10−2), 45 (×10−1), and 53 GeV: parameterizations by Tan & Ng (1983) and Duperray et al. (2003) compared with experimental data (Albrow et al. 1973); the lines are labeled as in Figure 12.
Figure 15.
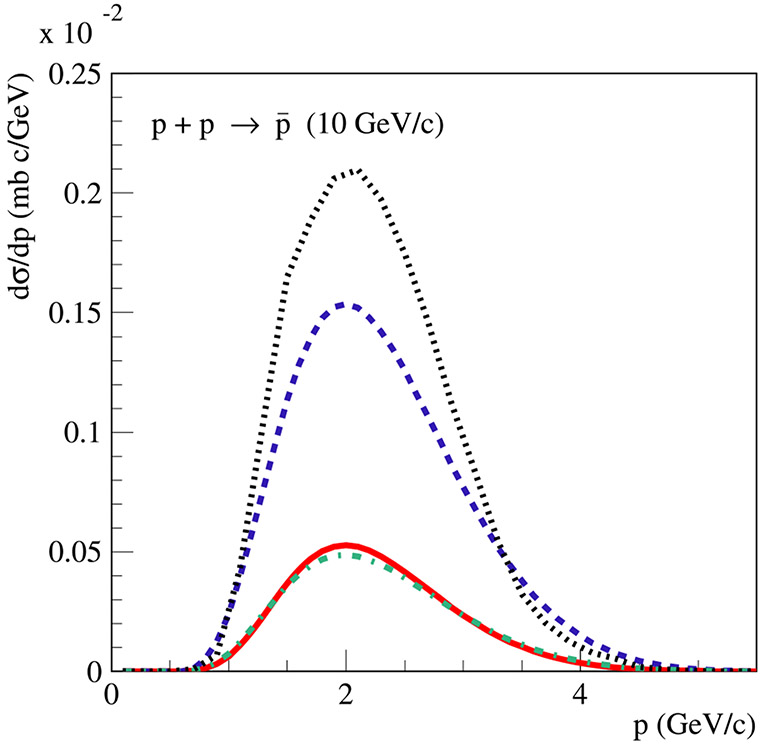
pt-integrated laboratory momentum spectra of in pp-collisions at plab = 10 GeV c−1 calculated using parameterizations by Tan & Ng (1983) (solid, red) and by Duperray et al. (2003) (parameter set 1—dashed blue, parameter set 2—dotted–dashed green) in comparison with QGSJET-IIm results (dotted, black).
APPENDIX B. COMPARISON OF PARAMETERIZATIONS OF SPECTRA WITH ACCELERATOR DATA
To trace the source of the differences between QGSJET-IIm and the parameterizations of Tan & Ng (1983) and Duperray et al. (2003) in the predicted -yields (Figures 5, 6), we compare the latter with selected accelerator data in Figures 12, 13, and 14. Starting with the results by Tan & Ng (1983), we observe a generally reasonable agreement with the measured -spectra in pp-collisions over the wide energy range Ep ~ 20–1500 GeV,13 which dominates the Z-factors for between few GeV and few hundred GeV, i.e., where these factors agree approximately with those calculated using QGSJET-IIm (see Figures 5, 6). However, the decrease of the -yield approaching the production threshold is faster in the parameterization of Tan & Ng (1983) than in QGSJET-IIm. This difference is illustrated in Figure 15, where the respective spectra for pp-collisions at 10 GeV c−1 are compared. On the other hand, in the high energy asymptotics, the scaling-like behavior of the -spectra, implemented by Tan & Ng (1983), is broken both by the rise of and by the increase of the central rapidity density of secondary hadrons, as discussed in Section 4. It is this scaling violation which leads to a steady energy rise of the predicted Z-factors in QGSJET-IIm (see Figure 5). In contrast, one obtains constant values using the parameterization of Tan & Ng (1983) at Ep ≳ 100 GeV.
Let us now turn to the two parameterizations proposed by Duperray et al. (2003). Apart from neglecting the energy rise of the inelastic cross section, Duperray et al. (2003) made questionable assumptions concerning the energy-dependence of the spectral shape for -production. In one case (parameter set 2), they assumed that the normalized (per inelastic event) -production spectrum rises as a power of energy: as sΔ, with14 Δ ≃ 0.25. While a power-law energy rise is indeed expected for hadron production in the central rapidity region (xF ≃ 0) (d’Enterria et al. 2011), the Feynman scaling is known to hold approximately for the forward spectral shape (see, e.g., a discussion in Kachelrieß & Ostapchenko 2012). The outcome of this extreme assumption overcompensates the neglected energy rise of and results in a too steep increase of inclusive -spectra, which is already visible in Figure 14, despite the narrow energy range covered by CERN ISR. In turn, in the other case (parameter set 1), the authors assumed a very strong scaling violation for the forward spectral shape, ∝ (1 – xR)const×ln s (xR ≃ 2E*/ at high energy, with E* being -energy in c.m.s.). In combination with the constant assumed, this leads to a drastic softening of the inclusive -spectra in the forward direction, see Figure 14.
Footnotes
Note added in proof: when this paper was already prepared for a submission, new parameterizations for -production in pp-collisions had been proposed in two recent publications (di Mauro et al. 2014b; Kappl & Winkler 2014). di Mauro et al. (2014b) used essentially the same parameterization as Duperray et al. (2003) and also assumed that the -production spectrum scales as a power of energy (∝sΔ) in the high energy limit. One of their proposed parameterizations cannot be extrapolated beyond the domain of validity which depends both on the energy and the slope of the primary spectra. In particular, the parametrization is not suited for a power-law primary energy spectrum Ip (E) ~ E−αp with αp < 2.7. In turn, Kappl & Winkler (2014) followed the approach of Tan & Ng (1983) by using the outdated concept of radial scaling, which is broken, e.g., by the energy rise of the inelastic cross section, as already discussed above.
Relative to expectations as if all positrons in CRs are secondary (Protheroe 1982; Moskalenko & Strong 1998).
Similar discrepancies have been reported in Ibarra & Wild (2013) for the case of the DPMJET-III model (Roesler et al. 2001) which is employed in the popular FLUKA code (Battistoni et al. 2007).
A comparison with additional experimental data sets is presented in Appendix A.
Here and in the following we take into account both and production when calculating Z-factors; for brevity, we use the same notation instead of . For the parameterizations by Tan & Ng (1983) and Duperray et al. (2003), we simply double the respective yields.
The measurement has been performed with the spectrometer technique for a single fixed c.m.s. angle, thus covering a tiny fraction of the relevant kinematic space.
Comparing the parameterizations of -production to the NA49 data in Figure 13, one has to take into account that the experimental spectrum has been corrected for the contributions of and − decays, which amounts to rescaling the results of Tan & Ng (1983) and Duperray et al. (2003) down by some 10–15% (Anticic et al. 2010).
It is noteworthy that this leads asymptotically to non-conservation of energy, because the energy fraction transferred to antiprotons would also rise as sΔ.
REFERENCES
- Aamodt K, Abel N, Abeysekara U, et al. 2011, EPJC, 71, 1655 [Google Scholar]
- Abe K, Fuke H, Haino S, et al. 2012, PhRvL, 108, 051102. [DOI] [PubMed] [Google Scholar]
- Accardo L, Aguilar M, Aisa D, et al. 2014, PhRvL, 113, 121101. [DOI] [PubMed] [Google Scholar]
- Ackermann M, Ajello M, Allafort A, et al. 2012, PhRvL, 108, 011103 [Google Scholar]
- Ackermann M, Ajello M, Albert A, et al. 2014, PhRvL, 112, 151103. [DOI] [PubMed] [Google Scholar]
- Adriani O, Barbarino GC, Bazilevskaya GA, et al. 2009, Natur, 458, 607. [DOI] [PubMed] [Google Scholar]
- Adriani O, Barbarino GC, Bazilevskaya GA, et al. 2009, PhRvL, 102, 051101. [DOI] [PubMed] [Google Scholar]
- Adriani O, Barbarino GC, Bazilevskaya GA, et al. 2010, PhRvL, 105, 121101. [DOI] [PubMed] [Google Scholar]
- Adriani O, Barbarino GC, Bazilevskaya GA, et al. 2011, Sci, 332, 69. [DOI] [PubMed] [Google Scholar]
- Adriani O, Barbarino GC, Bazilevskaya GA, et al. 2013, PhRvL, 111, 081102 [Google Scholar]
- Adriani O, Bazilevskaya GA, Barbarino GC, et al. 2013, JETPL, 96, 621 [Google Scholar]
- Adriani O, Barbarino GC, Bazilevskaya GA, et al. 2014, ApJ, 791, 93 [Google Scholar]
- Aguilar M, Alberti G, Alpat B, et al. 2013, PhRvL, 110, 141102 [Google Scholar]
- Ahn E-J, Engel R, Gaisser TK, Lipari P, & Stanev T 2009, PhRvD, 80, 094003 [Google Scholar]
- Ahn HS, Allison P, Bagliesi MG, et al. 2010, ApJL, 714, L89 [Google Scholar]
- Albrow MG, Bagchus A, Barber DP, et al. 1973, NuPhB, 56, 333 [Google Scholar]
- Allaby JV, Binon FG, Diddens AN, et al. 1970, Tech. Rep. CERN 70–12 [Google Scholar]
- Amaldi U, Biancastelli R, Bosio C, et al. 1975, NuPhB, 86, 403 [Google Scholar]
- Andersson B, Gustafson G, Ingelman G, & Sjöstrand T 1983, PhR, 97, 31 [Google Scholar]
- Anticic T, Baatar B, Bartke J, et al. 2010, EPJC, 65, 9 [Google Scholar]
- Arons J 1981, in IAU Symp. 94. Origin of Cosmic Rays, ed. Setti G, Spada G, & Wolfendale AW (Dordrecht: Reidel; ), 175 [Google Scholar]
- Baatar B, Barr G, Bartke J, et al. 2013, EPJC, 73, 2364 [Google Scholar]
- Battistoni G, Cerutti F, Fassò A, et al. 2007, in AIP Conf. Ser. 896, Hadronic Shower Simulation Workshop, ed. Albrow M. & Raja R (Melville, NY: AIP Publishing; ), 31 [Google Scholar]
- Beatty JJ, Bhattacharyya A, Bower C, et al. 2004, PhRvL, 93, 241102. [DOI] [PubMed] [Google Scholar]
- Berezhko EG, Ksenofontov LT, Ptuskin VS, Zirakashvili VN, & Völk HJ 2003, A&A, 410, 189 [Google Scholar]
- Bergström L, Edsjö J, & Ullio P 1999, ApJ, 526, 215 [Google Scholar]
- Bieber JW, Burger RA, Engel R, et al. 1999, PhRvL, 83, 674 [Google Scholar]
- Blasi P 2009, PhRvL, 103, 051104. [DOI] [PubMed] [Google Scholar]
- Blasi P, & Serpico PD 2009, PhRvL, 103, 081103. [DOI] [PubMed] [Google Scholar]
- Boezio M, Bonvicini V, Schiavon P, et al. 2001, ApJ, 561, 787 [Google Scholar]
- Bogomolov EA, Lubyanaya ND, Romanov VA, Stepanov SV, & Shulakova MS 1979, ICRC, 1, 330 [Google Scholar]
- Bottino A, Donato F, Fornengo N, & Salati P 1998, PhRvD, 58, 123503 [Google Scholar]
- Boulares A 1989, ApJ, 342, 807 [Google Scholar]
- Buffington A, Schindler SM, & Pennypacker CR 1981, ApJ, 248, 1179 [Google Scholar]
- Carr BJ 1985, in Proc. of the International Course Observational and Theoretical Aspects of Relativistic Astrophysics and Cosmology, ed. Goicoechea LJ, & Sanz JL (Singapore: World Scientific; ), 1 [Google Scholar]
- Chardonnet P, Mignola G, Salati P, & Taillet R 1996, PhLB, 384, 161 [Google Scholar]
- Chardonnet P, Orloff J, & Salati P 1997, PhLB, 409, 313 [Google Scholar]
- Cholis I, & Hooper D 2014, PhRvD, 89, 043013 [Google Scholar]
- Cirelli M, Kadastik M, Raidal M, & Strumia A 2009, NuPhB, 813, 1 [Google Scholar]
- Dal LA, & Kachelrieß M 2012, PhRvD, 86, 103536 [Google Scholar]
- d’Enterria D, Engel R, Pierog T, Ostapchenko S, & Werner K 2011, APh, 35, 98 [Google Scholar]
- Di Mauro M, Donato F, Fornengo N, Lineros R, & Vittino A 2014, JCAP, 4, 6 [Google Scholar]
- Di Mauro M, Donato F, Goudelis A, & Serpico PD 2014, PhRvD, 90, 085017 [Google Scholar]
- Donato F, Fornengo N, & Salati P 2000, PhRvD, 62, 043003 [Google Scholar]
- Donato F, Maurin D, Brun P, Delahaye T, & Salati P 2009, PhRvL, 102, 071301. [DOI] [PubMed] [Google Scholar]
- Donato F, Maurin D, Salati P, et al. 2001, ApJ, 563, 172 [Google Scholar]
- Duperray RP, Huang C-Y, Protasov KV, & Buénerd M 2003, PhRvD, 68, 094017 [Google Scholar]
- Ellis J, Flores RA, Freese K, et al. 1988, PhLB, 214, 403 [Google Scholar]
- Gaisser TK, & Levy EH 1974, PhRvD, 10, 1731 [Google Scholar]
- Gaisser TK, & Schaefer RK 1992, ApJ, 394, 174 [Google Scholar]
- Golden RL, Horan S, Mauger BG, et al. 1979, PhRvL, 43, 1196 [Google Scholar]
- Gribov VN 1968, JETP, 26, 414 [Google Scholar]
- Harding AK, & Ramaty R 1987, ICRC, 2, 92 [Google Scholar]
- Hof M, Menn W, Pfeifer C, et al. 1996, ApJL, 467, L33 [Google Scholar]
- Honda M, Kajita T, Kasahara K, & Midorikawa S 2004, PhRvD, 70, 043008 [Google Scholar]
- Hooper D, Blasi P, & Dario Serpico P 2009, JCAP, 1, 25 [Google Scholar]
- Ibarra A, & Wild S 2013, PhRvD, 88, 023014 [Google Scholar]
- Jungman G, & Kamionkowski M 1994, PhRvD, 49, 2316. [DOI] [PubMed] [Google Scholar]
- Jungman G, Kamionkowski M, & Griest K 1996, PhR, 267, 195 [Google Scholar]
- Kachelriess M, Moskalenko IV, & Ostapchenko SS 2014, ApJ, 789, 136. [DOI] [PMC free article] [PubMed] [Google Scholar]
- Kachelrieß M, & Ostapchenko S 2012, PhRvD, 86, 043004 [Google Scholar]
- Kachelrieß M, & Ostapchenko S 2013, PhRvD, 87, 047301 [Google Scholar]
- Kachelrieß M, Ostapchenko S, & Tomàs R 2011, ApJ, 733, 119 [Google Scholar]
- Kadastik M, Raidal M, & Strumia A 2010, PhLB, 683, 248 [Google Scholar]
- Kaidalov AB 1987, SvJNP, 45, 902 [Google Scholar]
- Kalmykov NN, & Ostapchenko SS 1993, PAN, 56, 346 [Google Scholar]
- Kalmykov NN, Ostapchenko SS, & Pavlov AI 1997, NuPhS, 52, 17 [Google Scholar]
- Kappl R, & Winkler MW 2014, JCAP, 9, 51 [Google Scholar]
- Kiraly P, Szabelski J, Wdowczyk J, & Wolfendale AW 1981, Natur, 293, 120 [Google Scholar]
- Kolmogorov A 1941, DoSSR, 30, 301 [Google Scholar]
- Letaw JR, Silberberg R, & Tsao CH 1983, ApJS, 51, 271 [Google Scholar]
- Maki K, Mitsui T, & Orito S 1996, PhRvL, 76, 3474. [DOI] [PubMed] [Google Scholar]
- Mertsch P, & Sarkar S 2014, PhRvD, 90, 061301 [Google Scholar]
- Moskalenko IV, & Strong AW 1998, ApJ, 493, 694 [Google Scholar]
- Moskalenko IV, Strong AW, Mashnik SG, & Ormes JF 2003, ApJ, 586, 1050 [Google Scholar]
- Moskalenko IV, Strong AW, Ormes JF, & Potgieter MS 2002, ApJ, 565, 280 [Google Scholar]
- Moskalenko IV, Strong AW, & Reimer O 1998, A&A, 338, L75 [Google Scholar]
- Orito S, Maeno T, Matsunaga H, et al. 2000, PhRvL, 84, 1078. [DOI] [PubMed] [Google Scholar]
- Ostapchenko S 2006, PhRvD, 74, 014026 [Google Scholar]
- Ostapchenko S 2011, PhRvD, 83, 014018 [Google Scholar]
- Ostapchenko S 2013, in EPJ Web of Conf., Vol. 52 XVII International Symp. on Very High Energy Cosmic Ray Interactions, ed. Gensch U, & Walter M (Les Ulis: EDP Sciences; ), 02001 [Google Scholar]
- Panov AD, Adams JH, Ahn HS, et al. 2009, BRASP, 73, 564 [Google Scholar]
- Pierog T, Karpenko I, Katzy JM, Yatsenko E, & Werner K 2013, arXiv:1306.0121 [Google Scholar]
- Porter TA, Johnson RP, & Graham PW 2011, ARA&A, 49, 155 [Google Scholar]
- Protheroe RJ 1982, ApJ, 254, 391 [Google Scholar]
- Ptuskin VS, Moskalenko IV, Jones FC, Strong AW, & Zirakashvili VN 2006, ApJ, 642, 902 [Google Scholar]
- Roesler S, Engel R, & Ranft J 2001, in Proc. of the Monte Carlo 2000 Conf., Advanced Monte Carlo for Radiation Physics, Particle Transport Simulation and Applications ed. Kling A, Barão F, Nakagawa M, Távora L, & Vaz P (Verlag: Springer; ), 1033 [Google Scholar]
- Rudaz S, & Stecker FW 1988, ApJ, 325, 16 [Google Scholar]
- Silk J, & Srednicki M 1984, PhRvL, 53, 624 [Google Scholar]
- Simon M, Molnar A, & Roesler S 1998, ApJ, 499, 250 [Google Scholar]
- Stecker FW, & Tylka AJ 1989, ApJL, 336, L51 [Google Scholar]
- Strong AW, & Moskalenko IV 1998, ApJ, 509, 212 [Google Scholar]
- Strong AW, Moskalenko IV, & Ptuskin VS 2007, ARNPS, 57, 285 [Google Scholar]
- Sugaya Y, Ashery D, Chiba J, et al. 1998, NuPhA, 634, 115 [Google Scholar]
- Szabelski J, Wdowczyk J, & Wolfendale AW 1980, Natur, 285, 386 [Google Scholar]
- Tan LC, & Ng LK 1983, JPhG, 9, 1289 [Google Scholar]
- Werner K, Liu F-M, & Pierog T 2006, PhRvC, 74, 044902 [Google Scholar]


