

Abstract
Objective: To determine the effects of levetiracetam in combination with topiramate on immune function, cognitive function, and the neuronal nutritional status of children with intractable epilepsy. Methods: This study enrolled 124 children with intractable epilepsy who were admitted to our hospital. The control group included 58 children treated with topiramate, and the observation group included 66 children treated with levetiracetam and topiramate. Flow cytometry was used to determine CD4+ and CD8+ T cell counts before and after treatment in both groups. Results: After treatment, the observation group exhibited significantly higher CD4+ T cell counts and BDNF and NGF levels and significantly lower CD8+ T cell counts and IL-6, IL-1β, and MMP-9 levels than the control group. The FIQ and VIQ of the observation group were also significantly higher than those of the control group. Additionally, the incidence rates of adverse events were not significantly different between the observation and the control groups. Finally, IL-6, IL-1β, and MMP-9 were negatively correlated with full-scale intelligence quotient (FIQ) and virtual inhibitory quotient (VIQ). Conclusions: Levetiracetam in combination with topiramate is associated with reduced inflammatory response and improved immune function, cognitive function, and neuronal nutritional status in children with intractable epilepsy.
Keywords: Cognitive function, immune function, intractable epilepsy, inflammatory response, levetiracetam, neuronal nutritional status
Introduction
Epilepsy is a common disorder of the central nervous system disease and primarily occurs in infants, with a pediatric epilepsy incidence of about 41-187/100,000; it is intractable in 30% of the patients, and few epilepsy drugs are effective in controlling intractable epilepsy [1-4]. Increasingly, studies have reported that seizures and the development of epilepsy are strongly linked to immune and inflammatory responses in the brain [5,6]. For example, a study by Vezzani et al. suggested that many autoimmune diseases were precipitating factors for epileptic seizures and epilepsy and that inflammation was a major factor for epileptic seizures and status epilepticus, which might worsen inflammation in the brain [7]. A study by Dupuis et al. also concluded that immune and inflammatory responses in epileptic children and adolescents were associated with the severity of epilepsy and that long-term epilepsy and inflammation could lead to neuronal damage in these patients [8]. Several neurotrophic factors have the ability to lower the frequency of generalized epileptic seizures, improve cognitive ability, and aid in addressing the neurodegeneration related to chronic epilepsy [9,10]. Therefore, a more comprehensive understanding of the severity of intractable epilepsy in children can be achieved by assessing the immune function, cognitive function, and neuronal nutritional status of these patients.
Levetiracetam is a pyrrolidine-based drug with high tolerance that can be effective in various epileptic seizures and epileptic syndromes; levetiracetam reduces the release of glutamate and the synaptic vesicle protein SV2a [11,12]. Topiramate is a second generation broad-spectrum antiepileptic drug that is also used for migraines. As a natural monosaccharide dextrose and fructose sulfide, topiramate enhances γ-aminobutyric acid-mediated activity and inhibits kainic acid by inhibiting voltage-sensitive sodium and calcium channels. Topiramate reduced the frequency of epileptic seizures by at least 50% in 35%-50% of the treated subjects [13,14]. However, it remains unknown whether the combined use of levetiracetam and topiramate can alleviate intractable epilepsy and affect immune function, cognitive function, and the neuronal nutritional status in patients with intractable epilepsy. Therefore, we determined the effect of levetiracetam in combination with topiramate on immune function, cognitive function, and neuronal nutritional status of children with intractable epilepsy, with the aim to provide a clinical reference.
Materials and methods
Clinical data
This study enrolled a total of 124 children with intractable epilepsy who were admitted to our hospital. In this study, 58 children were assigned to the control group and treated with topiramate, and the remaining 66 children were assigned to the observation group and treated with levetiracetam and topiramate. The study was approved by the Medical Ethics Committee of the First People’s Hospital of Wenling. All patients and their families agreed to participate in the experiment and signed the informed consent form.
Inclusion and exclusion criteria
The inclusion criteria were as follows: children between 1 and 14 years of age diagnosed with intractable epilepsy, which was confirmed by imaging and pathology [1]; no allergic reaction to the study drugs; detailed clinical data available; and children who could be followed up by phone calls. Children with other degenerative brain disorders or comorbid with severe inflammatory diseases and those with comorbid malignant tumors or severe immunodeficiency were excluded from the study.
Treatment plans
The children in the control group received oral topiramate at a dose of 1 mg/kg/day, administered once in the morning and once in the evening. In addition to the treatment adopted for the children in the control group, those in the observation group additionally received oral levetiracetam, administered once in the morning and once in the evening. Levetiracetam was administered at an initial dose of 10 mg/kg/day, and the dose was increased by 5-10 doses every 2 weeks based on the epilepsy severity, with a maximum levetiracetam dose of 60 mg/kg/day. Both treatment groups were treated for 6 months [15].
Treatment drugs and reagents
Levetiracetam was purchased from Jiangsu Heng Rui Pharmaceutical (State Food and Drug Administration approval number: H32022820), and topiramate was purchased from Guangdong Techpool Bio-Pharma (State Food and Drug Administration approval number: H19990133). The enzyme-linked immunosorbent assay (ELISA) kits for brain-derived neurotrophic factor (BDNF), nerve growth factor (NGF), interleukin (IL)-6, IL-1β, and matrix metalloproteinase-9 (MMP-9; E-EL-H0010c, E-EL-H1205c, E-EL-H0102c, E-EL-H0149c, and E-EL-H1451c, respectively) were purchased from Wuhan Elabscience. The CD4/CD8 flow cytometry detection kit was purchased from ACEA Biosciences (United States; medical device registration certificate number for the People’s Republic of China: 20153402287). The CytoFlex flow cytometry device was also purchased from ACEA Biosciences.
Sample collection
For all children, venous blood (5 ml) was collected in coagulation-promoting tubes under aseptic conditions on the morning of the day of hospital admittance and at 6 months after treatment initiation. Immediately after the collection, the samples were centrifuged at 3000 rpm for 10 min to separate the serum. All serum samples were stored at -80°C until further analyses.
ELISA and flow cytometry
The levels of BDNF, NGF, IL-6, IL-1β, and MMP-9 were determined by ELISA, and blank wells for background reading and wells for standards and patient serum samples were included. For all ELISAs, SO standards with a concentration of 0 were added to the blank wells, 50 µL of the standard at different concentrations were added into the wells for the standards, and 10 µL of the patient serum samples and 40 µL of the sample diluent were added to the wells for the patient samples. A blank well without the sample diluent was also prepared for all ELISAs. Next, 100 µL of the horseradish peroxidase-labeled detection antibody was added to all wells except for the blank well. The plates were covered with a microplate sealer and incubated in a water bath at 37°C for 65 min. Next, the liquid in each well was discarded, and the plates were patted dry with absorbent paper. The plates were washed six times by incubating with the washing solution for 2 min each, and the plates were patted dry with absorbent paper after each wash step. Next, 50 µL substrate A and 50 µL substrate B were added to each well, and the plates were incubated at 37°C in the dark for 10 min. The reactions were stopped by the addition of 50 µL of the stop solution to each well, and the optical density of all wells was measured at a wavelength of 450 nm within 15 min. The serum concentrations of the factors were calculated based on the standard curves. The CD4+ and CD8+ T cell percentages were determined using flow cytometry according to the manufacturer’s recommendations.
Observation indices
Primary observation indices of the two groups included treatment efficacy and changes in indices of immune function (CD4+ and CD8+ T cell percentages), neuronal nutritional status (BDNF and NGF), and inflammatory indices (IL-6, IL-1β, and MMP-9) before and after treatment. Secondary observation indices of the two groups included the incidence of adverse events following treatment as well as full-scale intelligence quotient (FIQ) and virtual inhibitory quotient (VIQ) before and after treatment.
Statistical analysis
The collected data were analyzed using SPSS version 20.0 (SPSS, Chicago, IL, United States) and presented in graphs using GraphPad Prism 7 (GraphPad, San Diego, CA, United States). Categorical variables were presented as percentages and analyzed using the chi-square test. Data distribution was analyzed using the Kolmogorov-Smirnov test. Continuous variables were expressed as means ± standard deviation. Comparisons of the data with normal distribution between the groups were performed using the independent-samples Student’s t test and expressed by t. Pearson’s correlation analysis was performed to analyze the relationship between cognitive and serum inflammatory factors in the observation group. P < 0.05 indicated a significant difference between the two groups.
Results
Clinical characteristics of both groups
The comparison of the clinical characteristics of the two groups (Table 1) revealed that there were no significant differences in age, sex, disease course, onset of epilepsy, body mass index, place of residence, seizure type, family history of epilepsy, perinatal brain damage, and seizure manifestation between the two groups (P > 0.05 for all).
Table 1.
Clinical characteristics of the two groups
| Observation group (n = 66) | Control group (n = 58) | t/x2 | P value | |
|---|---|---|---|---|
| Age (Y) | 7.5 ± 2.2 | 7.2 ± 1.8 | 0.824 | 0.412 |
| Course of disease (Y) | 3.5 ± 1.2 | 3.6 ± 1.3 | 0.445 | 0.657 |
| First onset time of epilepsy (Y) | 2.7 ± 0.8 | 2.4 ± 0.7 | 1.472 | 0.145 |
| Sex | 0.115 | 0.735 | ||
| Male | 39 (59.09) | 36 (62.07) | ||
| Female | 27 (40.91) | 22 (37.93) | ||
| BMI (kg/m2) | 17.14 ± 0.62 | 16.96 ± 0.58 | 1.662 | 0.099 |
| Place of residence | 2.297 | 0.130 | ||
| Urban area | 47 (72.71) | 48 (82.76) | ||
| Rural area | 19 (28.79) | 10 (17.24) | ||
| Seizure type | 0.645 | 0.724 | ||
| Partial seizure | 35 (53.03) | 32 (55.17) | ||
| Generalized seizure | 21 (31.82) | 20 (34.48) | ||
| Unclassified seizure | 10 (15.15) | 6 (10.35) | ||
| Family history of epilepsy | 0.403 | 0.526 | ||
| Yes | 8 (12.12) | 5 (8.62) | ||
| No | 58 (87.88) | 53 (91.38) | ||
| Perinatal brain injury | 0.229 | 0.632 | ||
| Yes | 19 (28.79) | 19 (32.76) | ||
| No | 47 (71.21) | 39 (67.24) | ||
| Seizure manifestation | 0.618 | 0.996 | ||
| Generalized tonic-clonic seizure | 11 (16.67) | 9 (15.52) | ||
| Absence seizure | 9 (13.63) | 10 (17.24) | ||
| Tonic seizure | 12 (18.18) | 9 (15.52) | ||
| Myoclonic seizure | 13 (19.70) | 10 (17.24) | ||
| Infantile spasm | 9 (13.64) | 8 (13.80) | ||
| Atonic seizure | 6 (9.09) | 6 (10.34) | ||
| Secondarily generalized seizure | 6 (9.09) | 6 (10.34) |
Comparison of the treatment effect between the two groups
The analysis of treatment efficacy revealed that there was no difference in the marked effect or effect between the two groups (P > 0.05 for both); however, the overall effect rate was higher in the observation group than in the control group (P < 0.05; Table 2).
Table 2.
Efficacy of the treatments
| Efficacy | Observation group (n = 66) | Control group (n = 58) | t/x2 | P value |
|---|---|---|---|---|
| Marked effect | 19 (28.79) | 14 (24.14) | 0.342 | 0.558 |
| Effect | 37 (56.06) | 26 (44.83) | 1.559 | 0.212 |
| No effect | 10 (15.15) | 18 (31.03) | 4.455 | 0.035 |
| The total effect | 56 (84.85) | 40 (68.97) |
Comparison of changes in immune function after treatment between the two groups
The comparison of the immune function indices between the two groups revealed that the mean CD4+ and CD8+ T cell percentages of the observation group were not significantly different from those of the control group before treatment (32.36% ± 3.60% vs. 31.68% ± 3.42% and 39.37% ± 4.33% vs. 40.64% ± 4.48% for CD4+ and CD8+ T cells, respectively; P > 0.05 for both). In addition, after treatment, both the observation and the control groups exhibited significantly increased mean CD4+ T cell percentages compared with those before treatment (P < 0.05 for both). Furthermore, the mean CD4+ T cell percentage of the observation group was higher than that of the control group after treatment (47.36% ± 4.67% vs. 38.56% ± 4.25%; P < 0.05), whereas the mean CD8+ T cell percentage was reduced in both groups following treatment (P < 0.05 for both). Finally, the mean CD8+ T cell percentage of the observation group was lower than that of the control group after treatment (27.93% ± 3.19% vs. 31.36% ± 3.50%; P < 0.05; Figure 1).
Figure 1.

Immune function of the two groups before and after treatment. A, C: Before treatment, the CD4+ T cell percentages were not significantly different between the two groups (t = 1.074, P = 0.285). After treatment, both the observation group (t = 22.647, P < 0.001) and the control group (t = 11.265, P < 0.001) exhibited significantly increased CD4+ T cell percentages, which were also higher in the observation group than in the control group (t = 10.917, P < 0.001). B, D: Before treatment, the CD8+ T cell percentages were not significantly different between the two groups (t = 1.603, P = 0.111). After treatment, both the observation group (t = 19.426, P < 0.001) and the control group (t = 13.578, P < 0.001) exhibited significantly decreased CD8+ T cell percentages, which were also significantly lower in the observation group than in the control group (t = 5.709, P < 0.001). ***P < 0.001.
Comparison of changes in neuronal nutritional status after treatment between the two groups
The comparison of the indices for neuronal nutritional status revealed that the mean BDNF and NGF levels of the observation group were not different from those of the control group before treatment (108.74 ± 13.42 vs. 112.67 ± 15.37 pg/mL and 484.63 ± 47.58 vs. 477.94 ± 44.62 ng/mL for BDNF and NGF, respectively). Conversely, after treatment, both groups exhibited increased mean BDNF and NGF levels. Furthermore, the mean BDNF and NGF levels of the observation group were higher than those of the control group (185.52 ± 19.67 vs. 148.37 ± 18.56 pg/mL and 568.15 ± 51.63 vs. 526.26 ± 52.37 ng/mL for BDNF and NGF, respectively; P < 0.05 for both; Figure 2).
Figure 2.

Neuronal nutritional status of the two groups before and after treatment. A. Before treatment, the brain-derived neurotrophic factor (BDNF) levels were not significantly different between the two groups (t = 1.520, P = 0.131). After treatment, both the observation group (t = 27.373, P < 0.001) and the control group (t = 15.378, P < 0.001) exhibited significantly increased BDNF levels, which were also significantly higher in the observation group than those in the control group (t = 10.773, P < 0.001). B. Before treatment, the two groups exhibited no difference in the nerve growth factor (NGF) levels (t = 0.804, P = 0.423). After treatment, both the observation group (t = 14.367, P < 0.001) and the control group (t = 7.385, P < 0.001) exhibited significantly increased NGF levels, which were also significantly higher in the observation group than in the control group (t = 4.478, P < 0.001). ***P < 0.001.
Comparison of changes in the inflammatory response after treatment between the two groups
The comparison of changes in the inflammatory indices between the two groups revealed that the levels of IL-6, IL-1β, and MMP-9 of the observation group were not different from those of the control group before treatment (34.76 ± 4.26 vs. 35.22 ± 5.37 pg/mL, 16.30 ± 3.47 vs. 16.12 ± 3.38 pg/mL, and 12.85 ± 2.45 vs. 12.26 ± 2.28 pg/mL for IL-6, IL-1β, and MMP-9, respectively; P > 0.05 for all). Conversely, after treatment, both groups exhibited reduced levels of IL-6, IL-1β, and MMP-9; importantly, the levels of IL-6, IL-1β, and MMP-9 of the observation group were lower than those of the control group (21.25 ± 3.27 vs. 27.56 ± 3.59 pg/mL, 10.25 ± 2.15 vs. 12.48 ± 2.46 pg/mL, and 7.34 ± 1.03 vs. 9.46 ± 1.27 pg/mL for IL-6, IL-1β, and MMP-9, respectively; Figure 3).
Figure 3.

Inflammatory factors of the two groups before and after treatment. A. Before treatment, the interleukin-6 (IL-6) levels were not significantly different between the two groups (t = 0.531, P = 0.596). After treatment, both the observation group (t = 21.759, P < 0.001) and the control group (t = 14.367, P < 0.001) exhibited significantly decreased IL-6 levels, which were also lower in the observation group than in the control group (t = 10.242, P < 0.001). B. Before treatment, the IL-1β levels were not significantly different between the two groups (t = 0.292, P = 0.771). After treatment, both the observation group (t = 15.637, P < 0.001) and the control group (t = 8.735, P < 0.001) exhibited significantly decreased IL-1β levels, which were also lower in the observation group than in the control group (t = 5.387, P < 0.001). C. Before treatment, the levels of matrix metalloproteinase-9 (MMP-9) were not significantly different between the two groups (t = 1.382, P = 0.170). After treatment, both the observation group (t = 17.946, P < 0.001) and the control group (t = 11.463, P < 0.001) exhibited significantly decreased levels of MMP-9, which were also significantly lower in the observation group than in the control group (t = 10.257, P < 0.001). ***P < 0.001.
Comparison of incidence rates of adverse events after treatment between the two groups
The comparison of the incidence rates of adverse events after treatment revealed that there were no significant differences in the incidence rates of appetite loss, dizziness, drowsiness, weight loss, irritability, and hypodynamia between the two groups (P > 0.05 for all; Table 3).
Table 3.
The incidence of adverse events after treatment
| Observation group (n = 66) | Control group (n = 58) | t/x2 | P value | |
|---|---|---|---|---|
| Loss of appetite | 3 (4.55) | 2 (3.45) | 0.096 | 0.757 |
| Dizziness | 2 (3.03) | 1 (1.73) | 0.223 | 0.637 |
| Sleepiness | 3 (4.55) | 3 (5.17) | 0.026 | 0.871 |
| Weight loss | 2 (3.03) | 3 (5.17) | 0.366 | 0.545 |
| Irascibility | 2 (3.03) | 2 (3.45) | 0.017 | 0.895 |
| Hypodynamia | 1 (1.52) | 4 (6.90) | 2.310 | 0.129 |
Comparison of changes in cognitive function after treatment between the two groups
No significant differences were noted in FIQ and VIQ between the observation and the control groups before treatment (91.54 ± 7.48 vs. 92.77 ± 6.93 and 93.05 ± 6.48 vs. 92.25 ± 6.18 for the FIQ and VIQ, respectively; P > 0.05 for both). After treatment, both groups exhibited improved FIQ and VIQ. Additionally, the FIQ and VIQ of the observation group were higher than those of the control group (106.37 ± 8.36 vs. 102.56 ± 7.59 and 108.32 ± 7.93 vs. 104.21 ± 7.25 for FIQ and VIQ, respectively; P < 0.05 for both; Figure 4).
Figure 4.
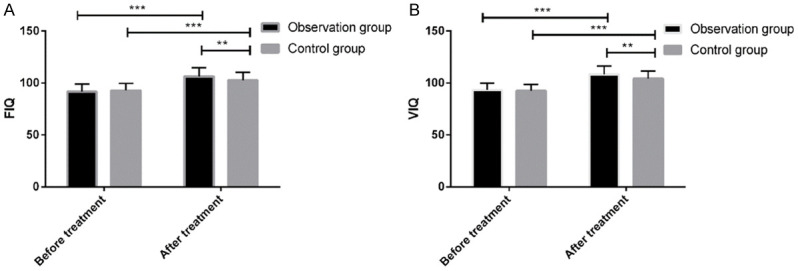
FIQ and VIQ of the two groups before and after treatment. A. Before treatment, there full-scale intelligence quotient (FIQ) was not significantly different between the two groups (t = 0.945, P = 0.346). After treatment, both the observation group (t = 12.736, P < 0.001) and the control group (t = 8.979, P < 0.001) exhibited significantly increased FIQ, which was also significantly higher in the observation group than in the control group (t = 2.643, P < 0.009). B. Before treatment, the virtual inhibitory quotient (VIQ) was not significantly different between the two groups (t = 0.701, P = 0.485). After treatment, both the observation group (t = 14.117, P < 0.001) and the control group (t = 10.562, P < 0.001) exhibited significantly increased VIQ, which was also significantly higher in the observation group than in the control group (t = 2.997, P < 0.003). **P < 0.001, ***P < 0.001.
Relationship between cognitive function and inflammatory factors
Pearson’s correlation analysis to assess the relationship between inflammatory factors and cognitive function in the observation group revealed that IL-6, IL-1β, and MMP-9 were negatively correlated with FIQ and VIQ (Figure 5).
Figure 5.

Correlation between the inflammatory factors and cognitive ability of the children with intractable epilepsy. A. IL-6 is negatively correlated with FIQ (r = -0.528, P < 0.001). B. IL-1β is negatively correlated with FIQ (r = -0.475, P < 0.001). C. MMP-9 is negatively correlated with FIQ (r = -0.467, P < 0.001). D. IL-6 is negatively correlated with VIQ (r = -0.618, P < 0.001). E. IL-1β is negatively correlated with VIQ (r = -0.462, P < 0.001). F. MMP-9 is negatively correlated with VIQ (r = -0.508, P < 0.001).
Discussion
A study by Itoh et al. suggested that levetiracetam could suppress vascular dysfunction due to epilepsy, inhibit the upregulation of pro-inflammatory molecules leading to epilepsy, and protect vessels via anti-inflammatory and antiangiogenic mechanisms [16]. Topiramate also demonstrated an ability to protect neurons and reduce oxidative stress and inflammation in the amygdala of rats [17,18]. Therefore, the present study explored the effects of levetiracetam administered in combination with topiramate on immune function, cognitive function, and neuronal nutritional status of children with intractable epilepsy.
In the present study, the total efficacy rate was better in the observation group than in the control group, which suggested that the combination of levetiracetam and topiramate was more effective than topiramate alone. Second, analyses of the changes in immune function revealed that the CD4+ and CD8+ T cell percentages, which were not significantly different between the two groups before treatment, changed significantly after treatment. Specifically, there was an increase in CD4+ T cells and a decrease in CD8+ T cells with treatment in both groups, indicating better immune function and suggesting that both treatment approaches could improve the immune function of children with intractable epilepsy. However, after treatment, the CD4+ T cells were higher and the CD8+ T cells were significantly lower in the observation group than in the control group, which also indicated that the combination of levetiracetam and topiramate was more effective than topiramate alone in improving immune function.
Subsequently, we compared the neuronal nutritional status of the two groups before and after treatment. We found that although there were no differences in the BDNF and NGF levels between the two groups before treatment, both groups exhibited significantly increased BDNF and NGF levels after treatment. Importantly, the observation group showed higher BDNF and NGF levels than the control group, suggesting that the improvement in the neurological function of the children was better with levetiracetam in combination with topiramate than with topiramate alone. A study by Shin et al. demonstrated that levetiracetam did not increase apoptosis in neurons and raised the possibility of levetiracetam as a neuroprotective agent in animal models [19]. The present study results also provide support for levetiracetam as a treatment option with good safety for the treatment of neonatal epilepsy.
We also evaluated the changes in inflammation-related factors, namely IL-6, IL-1β, and MMP-9, following treatment. Our analyses revealed that the levels of these three factors, which did not differ between the two groups before treatment, were lower after treatment in both groups. Critically, the levels of IL-6, IL-1β, and MMP-9 were lower in the observation group than in the control group after treatment. Repeated epileptic seizures were shown to lead to an inflammatory response in patients [20]. In a study by Kalueff et al., the seizures were more severe in epileptic rats administered with IL-6 compared than in the untreated epileptic rats, suggesting that IL-6 could exacerbate epilepsy [21]. Therefore, lowering the levels of these inflammatory factors may alleviate epilepsy. We predict that the combination treatment with levetiracetam and topiramate might be better at alleviating epilepsy and immune and inflammatory responses than single-drug treatments in children with intractable epilepsy, as both drugs can protect and aid in the restoration of neurological function [22].
Combined use of the two drugs has several advantages. First, in patients who might develop resistance to one of the drugs, the second drug can continue to control epilepsy; different pharmacological mechanisms might also create a synergistic effect [23]. Our comparative analyses of the two groups for the incidence of adverse events also demonstrated that the incidence rates of appetite loss, dizziness, sleepiness, weight loss, irascibility, and hypodynamia were not significantly different between the two groups.
We also compared the two groups for two cognitive ability indices, FIQ and VIQ. Our results demonstrated that the treatment led to increased FIQ and VIQ, indicating improved cognitive ability while alleviating epilepsy, in both groups. In addition, we found that the increases in FIQ and VIQ were significantly higher in the observation group than in the control group. The Pearson’s correlation analysis also found that the inflammatory factors IL-6, IL-1β, and MMP-9 were negatively correlated with FIQ and VIQ.
The present study has several limitations. First, the study included only children with epilepsy and did not enroll healthy children; therefore, the differences between children with epilepsy and healthy children could not be assessed. Second, we did not perform additional analyses to explore the correlations of IL-6, IL-1β, and MMP-9 with FIQ and VIQ. Therefore, future basic research studies are necessary to further explore and provide support by identifying the molecular basis for these correlations. Future studies should also compare levetiracetam in combination with topiramate to the available surgical methods for antiepileptic therapy, such as vagus nerve stimulation [24].
In conclusion, levetiracetam in combination with topiramate is associated with reduced inflammatory response and improved immune function, cognitive function, and neuronal nutritional status in children with intractable epilepsy. Furthermore, cognitive function is negatively correlated with inflammatory response in these patients.
Disclosure of conflict of interest
None.
References
- 1.Moshé SL, Perucca E, Ryvlin P, Tomson T. Epilepsy: new advances. Lancet. 2015;385:884–898. doi: 10.1016/S0140-6736(14)60456-6. [DOI] [PubMed] [Google Scholar]
- 2.Camfield P, Camfield C. Incidence, prevalence and aetiology of seizures and epilepsy in children. Epileptic Disord. 2015;17:117–123. doi: 10.1684/epd.2015.0736. [DOI] [PubMed] [Google Scholar]
- 3.Hansen B, Szaflarski M, Bebin EM, Szaflarski JP. Affiliate stigma and caregiver burden in intractable epilepsy. Epilepsy Behav. 2018;85:1–6. doi: 10.1016/j.yebeh.2018.05.028. [DOI] [PubMed] [Google Scholar]
- 4.Aaberg KM, Gunnes N, Bakken IJ, Søraas CL, Berntsen A, Magnus P, Lossius MI, Stoltenberg C, Chin R, Surén P. Incidence and prevalence of childhood epilepsy: a nationwide cohort study. Pediatrics. 2017;139:e20163908. doi: 10.1542/peds.2016-3908. [DOI] [PubMed] [Google Scholar]
- 5.Uludag IF, Duksal T, Tiftikcioglu BI, Zorlu Y, Ozkaya F, Kirkali G. IL-1β, IL-6 and IL1Ra levels in temporal lobe epilepsy. Seizure. 2015;26:22–25. doi: 10.1016/j.seizure.2015.01.009. [DOI] [PubMed] [Google Scholar]
- 6.Vezzani A, Fujinami RS, White HS, Preux PM, Blümcke I, Sander JW, Löscher W. Infections, inflammation and epilepsy. Acta Neuropathol. 2016;131:211–234. doi: 10.1007/s00401-015-1481-5. [DOI] [PMC free article] [PubMed] [Google Scholar]
- 7.Vezzani A, French J, Bartfai T, Baram TZ. The role of inflammation in epilepsy. Nat Rev Neurol. 2011;7:31–40. doi: 10.1038/nrneurol.2010.178. [DOI] [PMC free article] [PubMed] [Google Scholar]
- 8.Dupuis N, Auvin S. Inflammation and epilepsy in the developing brain: clinical and experimental evidence. CNS Neurosci Ther. 2015;21:141–151. doi: 10.1111/cns.12371. [DOI] [PMC free article] [PubMed] [Google Scholar]
- 9.Falcicchia C, Paolone G, Emerich DF, Lovisari F, Bell WJ, Fradet T, Wahlberg LU, Simonato M. Seizure-suppressant and neuroprotective effects of encapsulated BDNF-producing cells in a rat model of temporal lobe epilepsy. Mol Ther Methods Clin Dev. 2018;9:211–224. doi: 10.1016/j.omtm.2018.03.001. [DOI] [PMC free article] [PubMed] [Google Scholar]
- 10.Wang F, Lin Y, Kang D, Chen F, Lin K, Su X. Distribution and expression of brain-derived neurotrophic factor, nerve growth factor, and neurotrophic factor-3 in refractory epilepsy-associated focal cortical dysplasia. Clin Neuropathol. 2017;36:233–239. doi: 10.5414/NP301026. [DOI] [PubMed] [Google Scholar]
- 11.Blatt ER, Seeley KE, Lovett MC, Junge RE. Management of a reeve’s muntjac (muntiacus reevesi) with seizures using levetiracetam. J Zoo Wildl Med. 2017;48:1197–1199. doi: 10.1638/2016-0282.1. [DOI] [PubMed] [Google Scholar]
- 12.Swami M, Kaushik JS. Levetiracetam in neonatal seizures. Indian Pediatr. 2019;56:116–118. [PubMed] [Google Scholar]
- 13.Spritzer SD, Bravo TP, Drazkowski JF. Topiramate for treatment in patients with migraine and epilepsy. Headache. 2016;56:1081–1085. doi: 10.1111/head.12826. [DOI] [PubMed] [Google Scholar]
- 14.Cross JH, Riney CJ. Topiramate. 2015:642–651. [Google Scholar]
- 15.Muramatsu K, Sawaura N, Ogata T, Makioka N, Tomita K, Motojima T, Ida K, Hazama K, Arakawa H. Efficacy and tolerability of levetiracetam for pediatric refractory epilepsy. Brain Dev. 2017;39:231–235. doi: 10.1016/j.braindev.2016.09.008. [DOI] [PubMed] [Google Scholar]
- 16.Itoh K, Ishihara Y, Komori R, Nochi H, Taniguchi R, Chiba Y, Ueno M, Takata-Tsuji F, Dohgu S, Kataoka Y. Levetiracetam treatment influences blood-brain barrier failure associated with angiogenesis and inflammatory responses in the acute phase of epileptogenesis in post-status epilepticus mice. Brain Res. 2016;1652:1–13. doi: 10.1016/j.brainres.2016.09.038. [DOI] [PubMed] [Google Scholar]
- 17.Motaghinejad M, Motevalian M, Falak R, Heidari M, Sharzad M, Kalantari E. Neuroprotective effects of various doses of topiramate against methylphenidate-induced oxidative stress and inflammation in isolated rat amygdala: the possible role of CREB/BDNF signaling pathway. J Neural Transm (Vienna) 2016;123:1463–1477. doi: 10.1007/s00702-016-1619-1. [DOI] [PubMed] [Google Scholar]
- 18.Price TO, Farr SA, Niehoff ML, Ercal N, Morley JE, Shah GN. Protective effect of topiramate on hyperglycemia-induced cerebral oxidative stress, pericyte loss and learning behavior in diabetic mice. Int Libr Diabetes Metab. 2015;1:6–12. [PMC free article] [PubMed] [Google Scholar]
- 19.Shin JW, Jung YS, Park K, Lee SM, Eun HS, Park MS, Park KI, Namgung R. Experience and pharmacokinetics of Levetiracetam in Korean neonates with neonatal seizures. Korean J Pediatr. 2017;60:50–54. doi: 10.3345/kjp.2017.60.2.50. [DOI] [PMC free article] [PubMed] [Google Scholar]
- 20.Crespel A, Coubes P, Rousset MC, Brana C, Rougier A, Rondouin G, Bockaert J, Baldy-Moulinier M, Lerner-Natoli M. Inflammatory reactions in human medial temporal lobe epilepsy with hippocampal sclerosis. Brain Res. 2002;952:159–169. doi: 10.1016/s0006-8993(02)03050-0. [DOI] [PubMed] [Google Scholar]
- 21.Kalueff AV, Lehtimaki KA, Ylinen A, Honkaniemi J, Peltola J. Intranasal administration of human IL-6 increases the severity of chemically induced seizures in rats. Neurosci Lett. 2004;365:106–110. doi: 10.1016/j.neulet.2004.04.061. [DOI] [PubMed] [Google Scholar]
- 22.Tian Y, Guo SX, Li JR, Du HG, Wang CH, Zhang JM, Wu Q. Topiramate attenuates early brain injury following subarachnoid haemorrhage in rats via duplex protection against inflammation and neuronal cell death. Brain Res. 2015;1622:174–185. doi: 10.1016/j.brainres.2015.06.007. [DOI] [PubMed] [Google Scholar]
- 23.Wang X, Jin J, Chen R. Combination drug therapy for the treatment of status epilepticus. Expert Rev Neurother. 2015;15:639–654. doi: 10.1586/14737175.2015.1045881. [DOI] [PubMed] [Google Scholar]
- 24.Englot DJ, Rolston JD, Wright CW, Hassnain KH, Chang EF. Rates and predictors of seizure freedom with vagus nerve stimulation for intractable epilepsy. Neurosurgery. 2015;79:345–353. doi: 10.1227/NEU.0000000000001165. [DOI] [PMC free article] [PubMed] [Google Scholar]