Abstract
Acute myeloid leukemia (AML) is a heterogenous hematologic disease that has a poor prognosis. This study aimed to identify new targets for the diagnosis and treatment of AML. The GSE65409 and GSE90062 were selected from the AML database of the Gene Expression Omnibus and compared using the GEO2R tool to identify differentially expressed genes (DEGs). The Database for Annotation, Visualization, and Integrated Discovery was used to perform gene ontology and Kyoto Encyclopedia of Genes and Genomes analyses of the DEGs. Protein-protein interactions were visualized using the Search Tool for the Retrieval of Interacting Genes, which identified two potential hub genes that encode CDC45 and MCM7. Relative to AML specimens, normal specimens had higher expression levels of CDC45 and MCM7 based on the Gene Expression Omnibus and The Cancer Genome Atlas databases. Furthermore, Pearson’s correlation analysis revealed a significant relationship between CDC45 and MCM7. High expression of CDC45 was positively correlated with complete remission and negatively correlated with white blood cell count, hemoglobin concentration, platelet count, and bone marrow blasts. Moreover, high expression of MCM7 was negatively correlated with white blood cell count, hemoglobin concentration, platelet count, bone marrow blasts, and unfavorable cytogenetics. Overexpression of CDC45 increased the expressions of CDC45 and MCM7, while overexpression of MCM7 increased the expression of MCM7 but not CDC45. Overexpression of CDC45 or MCM7 led to impaired AML cell proliferation and blockage at the G1/S phase transition. Overexpression of CDC45 or MCM7 also attenuated the phosphorylation of PI3K, AKT, and mTOR, while simultaneous down-regulation of MCM7 expression abolished the effects of CDC45 overexpression. These findings suggest a functional relationship between CDC45 and MCM7, which might have use in the diagnosis and treatment of AML.
Keywords: Acute myeloid leukemia, CDC45, MCM7, cell proliferation, cell cycle
Introduction
Acute myeloid leukemia (AML) involves the unusual production of immature myeloid cells [1]. It is the most common form of acute leukemia in adults and its invasiveness is associated with a poor prognosis. Standard treatment regimens are based on patient stratification and involve induction chemotherapy and hematopoietic stem cell transplantation [2]. However, heterogeneity in the long-term clinical outcomes of AML is an ongoing issue, and there is a need for biomarkers that can facilitate early diagnosis and accurate prognostication.
Cell division cycle 45 (CDC45) is an important DNA replication factor in yeast cells [3], where it contributes to the process of DNA replication and is considered a marker for active replication forks [4]. Furthermore, CDC45 is considered a proliferation-associated antigen and its expression can be evaluated using a specific monoclonal antibody with good immunoreactivity [5]. Other reports have indicated that CDC45 is overexpressed in some malignant tumors, which led to a speculation that it is an oncogenic gene [6-8]. In addition, CDC45 is part of the CMG complex (CDC45-MCM-GINS) that is responsible for DNA unwinding [9], and CDC45 is recruited to the MCM2-7 complex to activate helicase [10]. Given the importance of the MCM complex, MCM7 has also been considered as a candidate biomarker for cancer progression, as MCM7 can control DNA synthesis and cell entry into the S phase [11]. There is also a close relationship between MCM7 polymorphisms and AML relapse [12].
Gene expression and bioinformatics analysis have been extensively used to clarify molecular mechanisms underlying various diseases [13-15]. Thus, we attempted to identify genes that might contribute to the diagnosis and treatment of AML by using bioinformatic tools. Two gene expression profiles (GSE65409 and GSE90062) were downloaded from the Gene Expression Omnibus database and used to identify differentially expressed genes (DEGs). Online tools were used to analyze the DEGs and ultimately identified two hub genes that encoded CDC45 and MCM7. We performed a series of experiments to evaluate the roles of CDC45 and MCM7 in AML cells, and evaluated whether their expressions were related to clinicopathologic features. Furthermore, in vitro experiments were performed to verify their effects on cell function and possibly related pathways.
Materials and methods
Data extraction
The GSE65409 and GSE90062 gene expression profiles were obtained from the Gene Expression Omnibus database (http://www.ncbi.nlm.nih.gov/geo/) [16]. The eligibility criteria for the gene expression profiles were: (1) all specimens were diagnosed as AML mononuclear cells or normal peripheral blood mononuclear cells from healthy donors, (2) all mRNA gene expression profiles were available, and (3) complete clinicopathologic data were available for analysis. The GSE65409 microarray contains 13 AML specimens and 8 normal specimens, while the GSE90062 microarray contains 3 AML specimens and 3 normal specimens.
Data preprocessing to identify DEGs
The online GEO2R tool was used to identify DEGs between the normal and AML specimens, using a |log2FC| value of >2 and an adjusted P-value of <0.05. An online tool was then used to create Venn diagrams showing the common DEGs.
Gene ontology and pathway enrichment analysis of DEGs in AML
Gene ontology (GO) and Kyoto Encyclopedia of Genes and Genomes (KEGG) enrichment analyses were performed for the DEGs using the Database for Annotation, Visualization and Integrated Discovery (DAVID, https://david.ncifcrf.gov/), which is an online biologic information database [17,18]. The GO enrichment analysis is used to generally compare and classify the biologic characteristics of the DEGs. The KEGG analysis allowed us to functionally interpret the genes. The enriched functional pathways were identified based on a P-value <0.05. We also performed Search Tool for the Retrieval of Interacting Genes (STRING) analysis to identify and visualize the functional interactions between the DEG-encoded proteins [19].
Gene expression profiling
The gene expressions were compared between normal and AML specimens using a web-based gene expression profiling interactive analysis tool (http://gepia.cancer-pku.cn/) [20]. We also performed Pearson’s correlation analysis to evaluate relationships between pairs of genes.
Clinical specimens
Bone marrow specimens were collected from 120 AML patients who received standard chemotherapy at the Shengjing Hospital of China Medical University between 2017 and 2019. The diagnosis and subtype classification of AML were based on the 2016 World Health Organization criteria [21]. The patients’ clinical characteristics are presented in Table 1. The study protocol complied with the Declaration of Helsinki and was approved (NO. 2015PS116K) by the ethics committee of Shengjing Hospital of China Medical University. The patients had provided written informed consent for the research use of their specimens.
Table 1.
Identification of co-differentially expressed genes, including 6 upregulated and 13 downregulated genes, in the GSE65409 and GSE90062 datasets
| Regulation | DEGs |
|---|---|
| Upregulated (n=56) | C10orf54, CD3D, CDKN1A, ITGAM, MAFB, CFP, CEBPB, LGALS3, MCEMP1, GAS7, OSCAR, ACTA2, HIST1H2BD, PIM1, GBP2, DNASE2, GABARAPL1, IL13RA1, DPEP2, CD300A, TNFRSF4, TXNIP, CDKN2D, KLF2, PILRA, CRISPLD2, PRF1, GANAB, STAB1, P2RX4, TRAF3IP3, AHNAK, NABP1, NLRP12, IL27RA, EVI2A, SQSTM1, C5AR1, ASGR2, GPAT3, TMEM71, MOB3C, ITGAL, FAM20C, ITPRIPL2, TNFRSF10B, WARS, NFIL3, PLP2, KLF10, CACNA2D4, PLEKHO1, IL3RA, IRF2BPL, TIGAR, TMEM154 |
| Downregulated (n=53) | FANCI, PUM3, DLEU1, CENPM, NME4, METAP2, TRIP13, TPGS2, CDCA3, RFC3, HNRNPDL, S4A3, PROS1, RRM2, SLC16A10, HMGN2, HSPE1, CDCA8, TUBB, UHRF1, PFAS, BOLA3, CENPA, BIRC5, MCM7, CENPW, TMEM97, PRPS1, CCP110, FABP5, MCM2, MPP6, ILF3, CCNA2, FAM83D, CENPN, CDKN3, KIF20A, BUB1, TROAP, AZU1, CXCR4, AURKB, PAXBP1, RNASE2, MCM10, CDC45, DLGAP5, CDC20, HMGN5, RNASE3, PRTN3, PRG2 |
Cell culture and cell transfection
Human leukemia cell lines (HL-60 and THP-1) were obtained from the National Collection of Authenticated Cell Cultures (Shanghai, China). The HL-60 cells were cultured in IMDM medium (GIBCO, MA, USA) containing 20% fetal bovine serum (Invitrogen, MA, USA). The THP-1 cells were cultured in RPMI 1640 medium (Invitrogen, MA, USA) containing 10% fetal bovine serum. All cells were cultured at 37°C in a humidified atmosphere containing 5% CO2.
The pDONR223_CDC45_WT_V5 plasmid was a gift from Jesse Boehm, Matthew Meyerson, and David Root (http://n2t.net/addgene:82990; RRID: Addgene_82990). The mEmerald-MCM7-C-19 plasmid was a gift from Michael Davidson (http://n2t.net/addgene:54173; RRID: Addgene_54173). The pDONR223 and mEmerald vectors were obtained from the Biovector Vector Strain Cell Gene Preservation Center (Beijing, China). The plasmids were transfected into AML cells using Lipofectamine 3000 (Invitrogen, MD, USA) according to the manufacturer’s instructions. The cells were then selected using G418 or spectinomycin (Invitrogen, NY, USA) and expressions were confirmed by Western blotting. Short interfering RNA (siRNA) specific to MCM7 and a scrambled control siRNA were purchased from JTS Scientific Company (Wuhan, China), which were also transiently transfected into cells using Lipofectamine 3000.
5-ethynyl-2’-deoxyuridine (EdU) incorporation assay
The EdU incorporation assay was performed using an EdU Kit (Beyotime Biotechnology Company, Shanghai, China). Cells were harvested at the logarithmic phase and seeded onto 24-well plates at a density of 20,000 cells/well. Before the assay, the cells were switched into new medium supplemented with EdU (1:1,000 dilution) and incubated for 2 h. The cells were then fixed using 4% formaldehyde for 30 min at room temperature, permeabilized for 10 min using 0.5% Triton X-100 (Sangon Biotech, Shanghai, China) in phosphate-buffered saline for 10 minutes, and subjected to Hoechst staining (1:100 dilution) for 10 min. The proportion of EdU-positive cells was then evaluated using fluorescence microscopy (Olympus, Japan).
Cell cycle analysis
Cell cycle analysis was performed using flow cytometry and a propidium iodide/RNase cell cycle analysis kit (BD Biosciences, CA, USA). Cells were fixed overnight at -20°C with 70% pre-cooled ethanol, washed with phosphate-buffered saline, and then stained using propidium iodide for 30 min in the dark. Flow cytometry was performed using a FACS can flow cytometer (Becton Dickinson, CA, USA) and the results were interpreted using ModFit software (Verity Software House, ME, USA).
Western blotting
Cells were lysed on ice using RIPA buffer for 30 min and the protein content was evaluated using the BCA Protein Assay (Beyotime Biotechnology, Shanghai, China). Total protein (50 µg/lane) was separated by 10% SDS-PAGE gel and transferred to a polyvinylidene fluoride membrane (Millipore, MA, USA). The membranes were incubated overnight at 4°C with primary antibodies (Cell Signaling Technology, Inc., MA, USA) to CDC45 (#3673, 1:2,000), MCM7 (#4018, 1:2,000), phosphorylated (p)-PI3K (#17366, 1:2,000), PI3K (#4255, 1:2,000), p-AKT (#4060, 1:2,000), AKT (#9272, 1:2,000), p-mTOR (#5536, 1:2,000), mTOR (#2972, 1:2,000), and GAPDH (#5174, 1:2,000). Tris-buffered saline with 0.1% Tween 20 detergent was used to wash the membranes, which were then incubated with horseradish peroxidase-conjugated anti-rabbit secondary antibodies (#7071, 1:5,000). Protein bands were visualized using an enhanced chemiluminescence kit (Promega, WI, USA) and analyzed using a gel imaging system with Image-Pro Plus software (National Institutes of Health, USA).
Statistical analysis
All analyses were performed using SPSS software (version 22.0; IBM Corp., Armonk, NY). Groups were compared using the t-test or using one-way analysis of variance followed by Tukey’s multiple comparisons test. Pearson’s correlation analysis was used to evaluate relationships between hub genes. The χ2 test was used to evaluate the relationships between the patients’ clinicopathologic characteristics and categorical expressions of CDC45 or MCM7 (high or low). Results were considered significant at P-values of <0.05.
Results
Identification of DEGs
The GSE65409 dataset (13 AML specimens and 8 normal specimens) and GSE90062 dataset (3 AML specimens and 3 normal specimens) were chosen for this study (Figure 1A). The GEO2R online tool was used to screen the datasets using an adjusted P-value of <0.05 and a |log2FC| value of >2, and identified 415 up-regulated DEGs and 533 down-regulated DEGs in the GSE65409 dataset, as well as 1,173 up-regulated DEGs and 699 down-regulated DEGs in the GSE90062 dataset, with totals of 1532 up-regulated DEGs and 1179 down-regulated DEGs (Figure 1B). A comparison of the two datasets revealed 109 common DEGs (Table 1).
Figure 1.
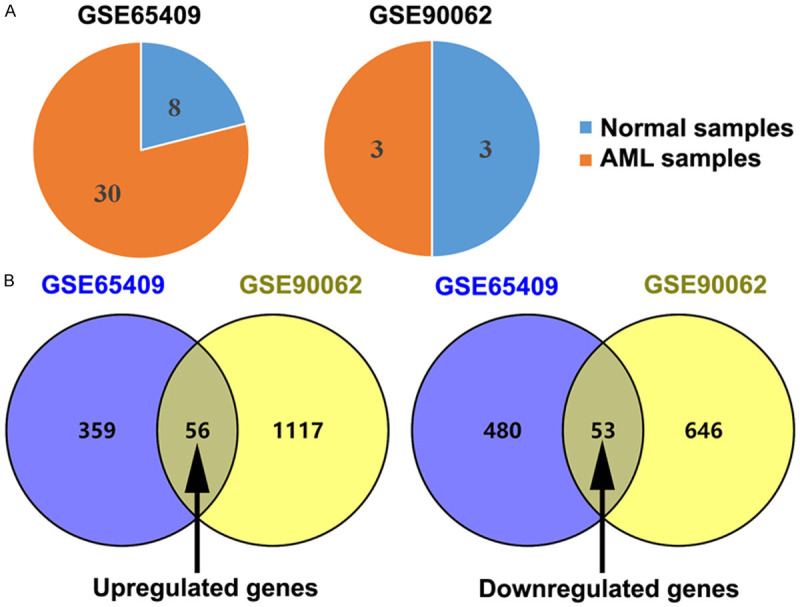
Identifying differentially expressed genes (DEGs) between normal and acute myeloid leukemia (AML) specimens using two mRNA expression profiles (GSE65409 and GSE90062). A. The two microarray datasets were analyzed and the numbers of normal and AML specimens are shown. B. Venn diagrams of common DEGs in the two datasets.
Enrichment analysis and identification of hub DEGs
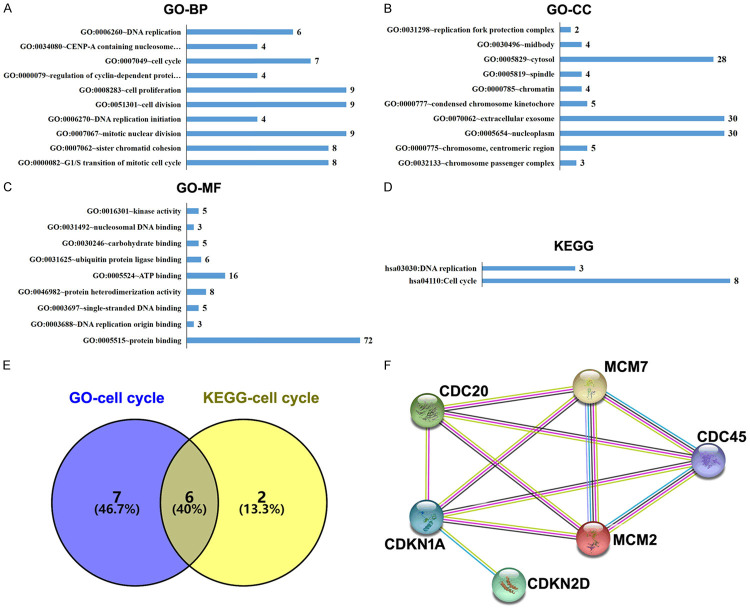
The DAVID database was used for gene ontology and KEGG pathway enrichment analysis to identify the biological functions of the DEGs. The top ten enriched terms for biological processes and cellular components are shown in Figure 2A and 2B. The enriched terms for molecular function are shown in Figure 2C and 2D. The enriched biological processes were DNA replication and regulation of mitotic cell cycle. The enriched cellular components were related to the replication fork protection complex, midbody interactome, spindle, and chromatin. The enriched molecular functions were kinase activity, nucleasomal DNA binding, and DNA replication origin binding. The KEGG pathway enrichment analysis revealed enrichment in terms of DNA replication and cell cycle pathways.
Figure 2.
The gene ontology (GO) and Kyoto Encyclopedia of Genes and Genomes (KEGG) pathway enrichment analyses of the DEGs. (A-D) The numbers of enriched genes according to (A) biologic process, (B) molecular function, (C) cellular component category, and (D) KEGG pathway analysis. (E) Venn diagrams of common cell cycle-related DEGs from the GO and KEGG analyses. (F) A protein-protein interaction network was constructed for the DEGs using the STRING database.
Figure 2C shows that six common cell cycle-related DEGs were identified by the gene ontology and KEGG pathway analysis (encoding CDC20, CDC45, CDKN1A, CDKN2D, MCM2 and MCM7). Furthermore, the network of the six hub genes was evaluated using the online STRING platform (Figure 2D).
Expression of hub genes in normal and AML specimens
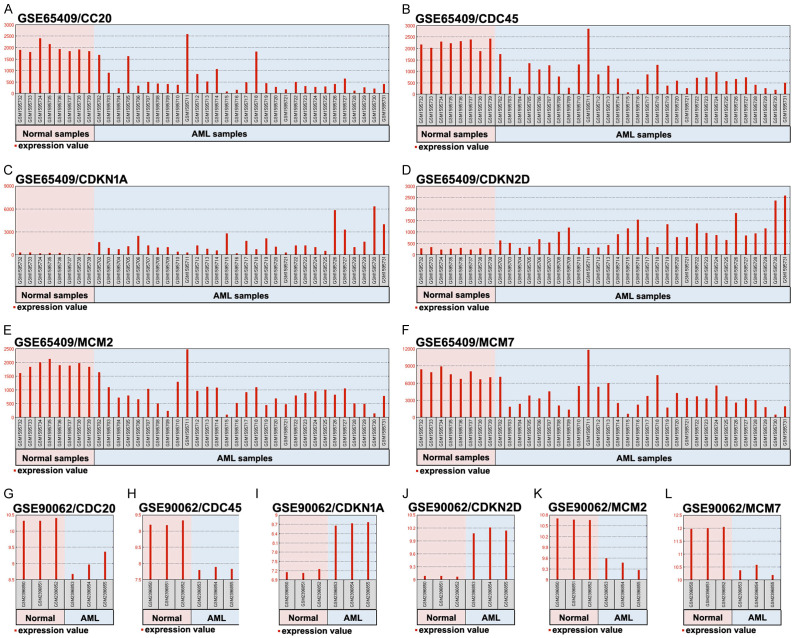
The expression profiles of the six hub genes were evaluated in the two Gene Expression Omnibus datasets (Figure 3A-L). The results revealed that, relative to normal specimens, AML specimens had clearly higher mRNA expressions of CDKN1A and CDKN2D and significantly lower mRNA expressions of CDC20, CDC45, MCM2, and MCM7. The Gene Expression Profiling Interactive Analysis tool was used to evaluate these expressions using The Cancer Genome Atlas datasets, which confirmed that AML specimens had higher expression of CDKN2D mRNA and lower expressions of CDC20, CDC45, and MCM7 mRNA (Figure 4A-F). Pearson’s correlation analysis was also used to evaluate the relationship between the six hub genes (Figure 4G-L), which revealed significant relationships between CDC45 and CDC20 (R=0.27) as well as between CDC45 and MCM7 (R=0.63). These results confirmed a functional link between CDC45 and MCM7.
Figure 3.
The expression levels of six overlapping DEGs in the normal and AML specimens from the GSE65409 and GSE90062 datasets. A, G. The expression levels of CDC20. B, H. The expression levels of CDC45. C, I. The expression levels of CDKN1A. D, J. The expression levels of CDKN2D. E, K. The expression levels of MCM2. F, L. The expression levels of MCM7.
Figure 4.
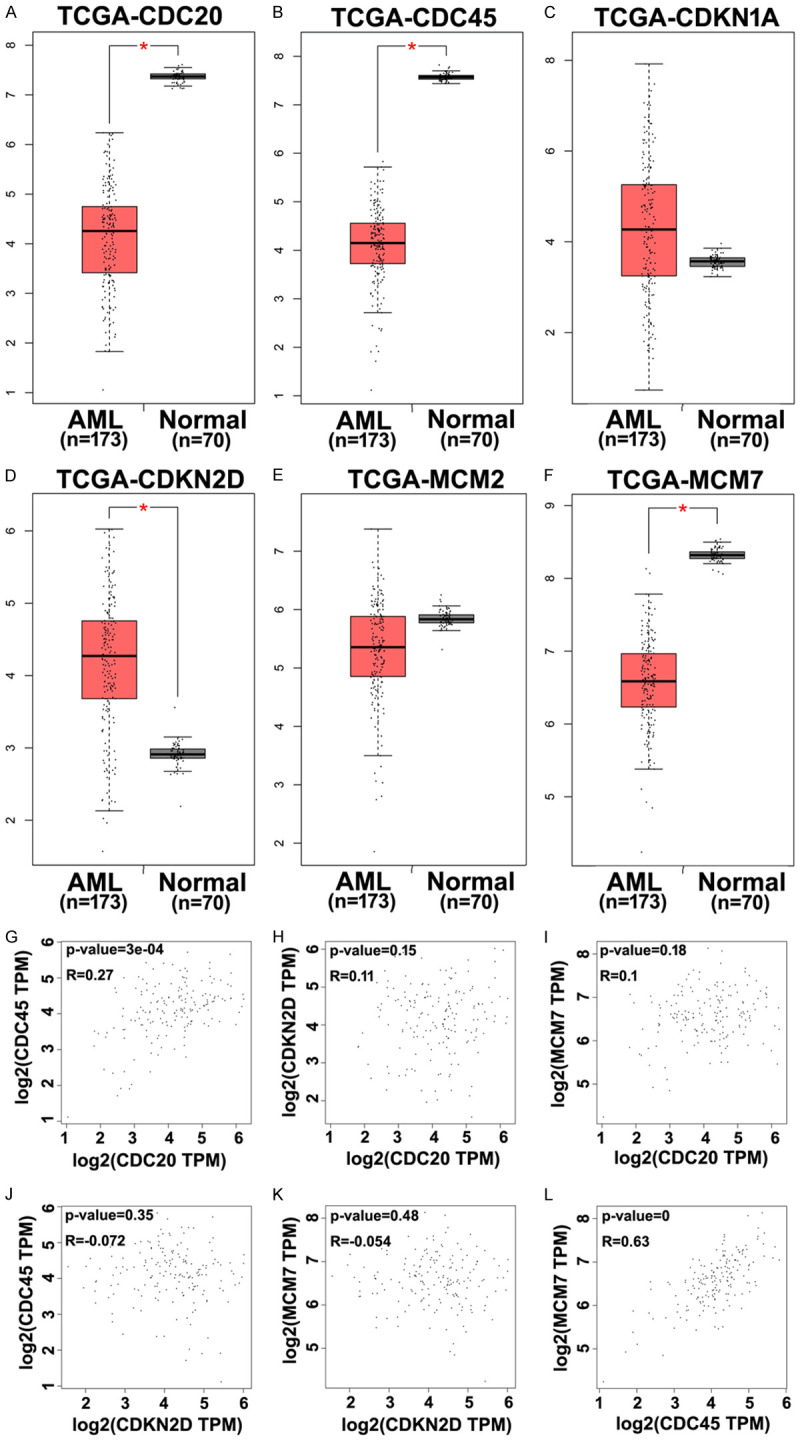
Confirmation of the six hub DEGs in normal and AML specimens using gene expression profiling interactive analysis. A-F. Expressions of CDC20, CDC45, CDKN1A, CDKN2D, MCM2, and MCM7 were evaluated using The Cancer Genome Atlas database. G-L. Pearson’s correlation analysis of the relationships between these six hub genes. *P<0.05.
The associations of patients’ clinicopathologic characteristics with expression of CDC45 and MCM7
The clinicopathologic characteristics of patients with AML were evaluated to explore their associations with the high (≥ median value) or low (< median value) expressions of CDC45 and MCM7 in AML specimens (Table 2). High expression of CDC45 was positively correlated with complete remission status (χ2=7.122, P=0.008) and negatively correlated with white blood cell count (χ2=8.319, P=0.004), hemoglobin concentration (χ2=5.968, P=0.015), platelet count (χ2=4.115, P=0.042), and bone marrow blasts (χ2=6.674, P=0.009). Moreover, high expression of MCM7 was negatively correlated with white blood cell count (χ2=6.163, P=0.013), hemoglobin concentration (χ2=6.354, P=0.012), platelet count (χ2=8.952, P=0.003), bone marrow blasts (χ2=5.403, P=0.021), and unfavorable cytogenetics (χ2=5.248, P=0.022). Thus, low expression of CDC45 and MCM7 may be correlated with the malignant potential of AML.
Table 2.
Clinicopathologic characteristics of patients with AML based on the protein expression levels of CDC45 and MCM7
| Clinicopathologic characteristic | Total | CDC45 | MCM7 | ||||||
|---|---|---|---|---|---|---|---|---|---|
|
|
|
||||||||
| high expression | low expression | χ2 | P-value | high expression | low expression | χ2 | P-value | ||
| Age (year) | |||||||||
| <50 | 86 | 20 | 66 | 27 | 59 | ||||
| ≥50 | 34 | 6 | 28 | 0.182 | 0.669 | 10 | 24 | 0.045 | 0.994 |
| Gender | |||||||||
| Male | 76 | 17 | 59 | 21 | 55 | ||||
| Female | 44 | 9 | 35 | 0.061 | 0.806 | 16 | 28 | 0.629 | 0.428 |
| WBC counts (×109/L), n (%) | |||||||||
| <10 | 35 | 14 | 21 | 17 | 18 | ||||
| ≥10 | 85 | 12 | 73 | 8.319 | 0.004** | 20 | 65 | 6.163 | 0.013* |
| Hemoglobin (g/dL), n (%) | |||||||||
| <80 | 69 | 9 | 60 | 15 | 54 | ||||
| ≥80 | 51 | 17 | 34 | 5.968 | 0.015* | 23 | 28 | 6.354 | 0.012* |
| Platelet count (×1012/L), n (%) | |||||||||
| <50 | 65 | 9 | 56 | 12 | 53 | ||||
| ≥50 | 55 | 17 | 38 | 4.155 | 0.042* | 25 | 30 | 8.952 | 0.003** |
| BM blasts, n (%) | |||||||||
| <50 | 54 | 18 | 36 | 23 | 31 | ||||
| ≥50 | 66 | 8 | 58 | 6.674 | 0.009** | 14 | 52 | 5.403 | 0.021* |
| FAB subtype | |||||||||
| M1/M2 | 51 | 11 | 40 | 17 | 34 | ||||
| M4/M5 | 69 | 15 | 54 | 0.041 | 0.841 | 20 | 49 | 0.096 | 0.757 |
| Cytogenetics | |||||||||
| Favorable | 35 | 7 | 28 | 19 | 16 | ||||
| Intermediate | 58 | 14 | 44 | 12 | 46 | ||||
| Unfavorable | 27 | 5 | 22 | 0.032 | 0.859 | 6 | 21 | 5.248 | 0.022* |
| Extranmedullary disease | |||||||||
| Absent | 69 | 14 | 55 | 21 | 48 | ||||
| Present | 51 | 12 | 39 | 0.041 | 0.839 | 16 | 35 | 0.0081 | 0.928 |
| Complete Remission | |||||||||
| Yes | 72 | 22 | 50 | 25 | 47 | ||||
| No | 48 | 4 | 44 | 7.122 | 0.008** | 22 | 26 | 1.062 | 0.303 |
presents P<0.05;
presents P<0.01.
Overexpression of CDC45 increased MCM7 expression, hindered AML cell proliferation, and blocked the G1/S phase transition
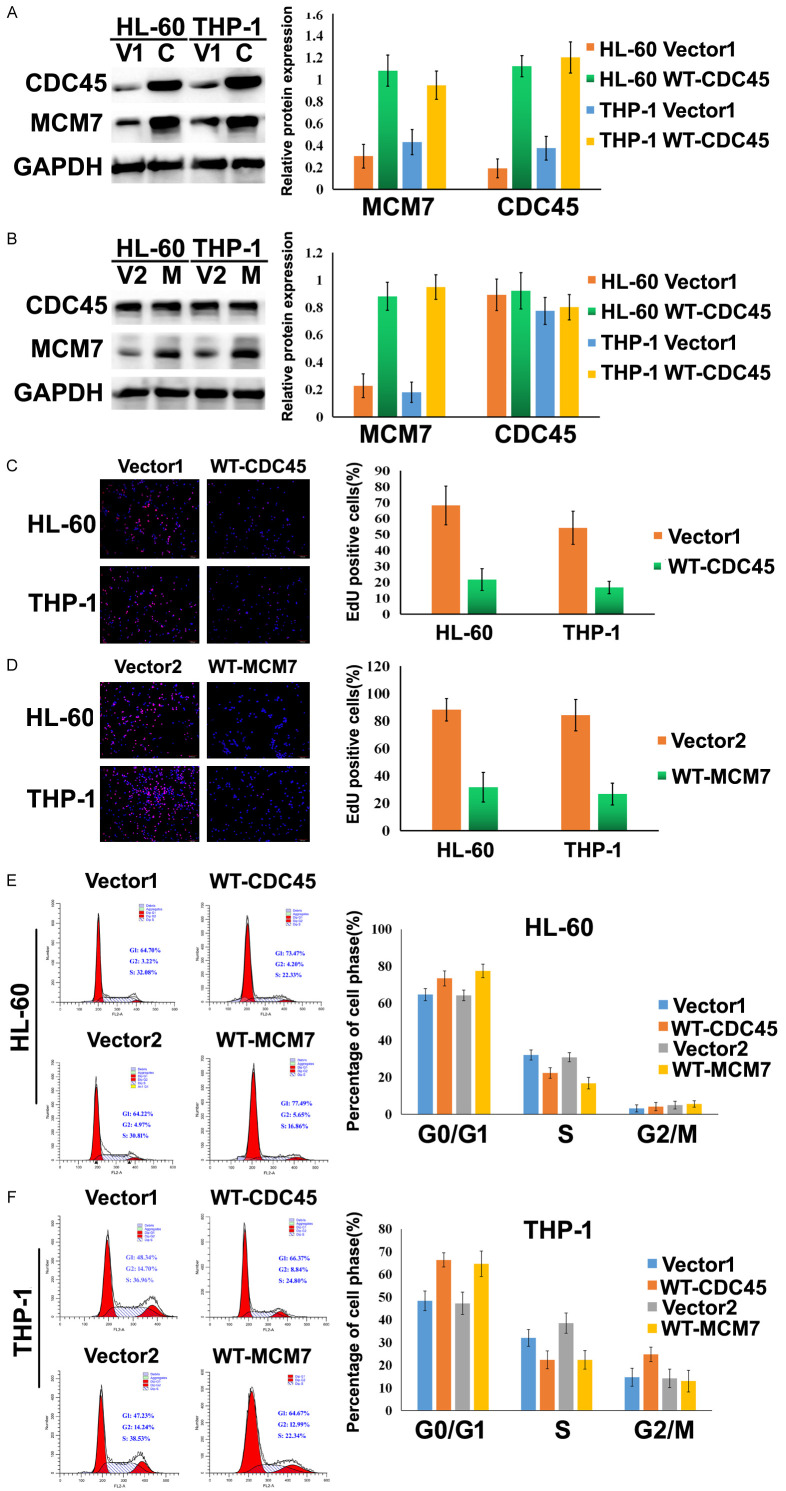
After transfection with pDONR223-CDC45, the AML cell lines (HL-60 and THP-1) both exhibited increased protein expressions of CDC45 and MCM7 (Figure 5A, 5B). However, after transfection with mEmerald-MCM7, the HL-60 and THP-1 cells exhibited increased expression of MCM7 but not CDC45. The EdU assay also revealed that HL-60 and THP-1 cells had decreased proliferation in the presence of CDC45 overexpression (Figure 5C, 5D), and similar results were observed in the presence of MCM7 overexpression. Moreover, transfection with pDONR223-CDC45 or mEmerald-MCM7 was associated with an increased proportion of AML cells in the G0/G1 phase and a decreased proportion of cells in the S phase (Figure 5E, 5F). These results imply that CDC45 overexpression upregulated the expression of MCM7, which was associated with impaired AML cell proliferation and blocking the G1/S phase transition.
Figure 5.
Overexpression of CDC45 increased MCM7 expression, hindered AML cell proliferation, and blocked the G1/S phase transition. A. The protein expression levels of CDC45 and MCM7 in pDONR223-CDC45-transfected HL-60 and THP-1 cells. B. The protein expression levels of CDC45 and MCM7 in mEmerald-MCM7-transfected HL-60 and THP-1 cells. C. Representative images from the EdU assay using HL-60 and THP-1 cells after transfection with vector 1 and WT-CDC45. D. Representative images from the EdU assay using HL-60 and THP-1 cells after transfection with vector 2 and WT-MCM7. The ratio of EdU-positive cells was calculated as (EdU-positive cells/Hoechst-stained cells) ×100%. E. Representative images from the cell cycle assay using HL-60 and THP-1 cells after transfection with vector 1 and WT-CDC45. F. Representative images from the cell cycle assay using HL-60 and THP-1 cells after transfection with vector 2 and WT-MCM7. The percentages of cells in each cell cycle phase were expressed using a histogram. V1 and vector 1: pDONR223-vector; C and WT-CDC45: pDONR223-CDC45; V2 and vector 2: mEmerald-vector; M and WT-MCM7: mEmerald-MCM7; *P<0.05.
Overexpression of CDC45/MCM7 suppressed the proliferation of AML cells by inhibition of the PI3K/AKT/mTOR signaling pathway
The PI3K/AKT/mTOR pathway can promote cell transformation, tumor initiation, and resistance to apoptosis [22]. In this pathway, PI3K is activated by phosphorylation at Tyr458 and phosphorylates AKT at Thr308, which activates a variety of downstream signaling factors, including mTOR [23]. Therefore, we evaluated the protein expression levels of PI3K, p-PI3K, AKT, p-AKT, mTOR, and p-mTOR by western blotting. Overexpression of CDC45 or MCM7 in HL-60 and THP-1 cells resulted in decreased phosphorylation of PI3K, AKT, and mTOR. Furthermore, down-regulation of MCM7 using siRNA abolished the effects of CDC45 overexpression on those proteins (Figure 6A, 6B).
Figure 6.
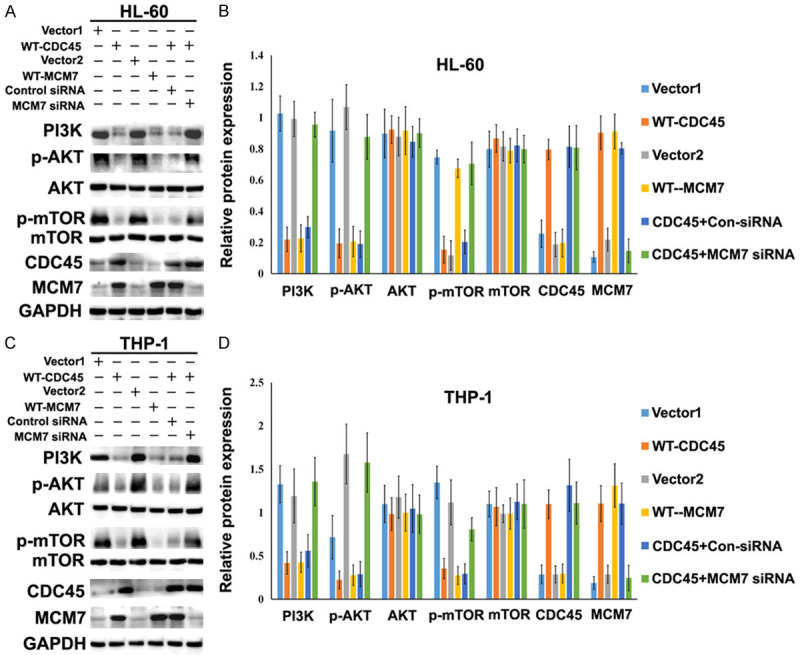
Overexpression of CDC45/MCM7 suppressed the proliferation of AML cells by inhibiting the PI3K/AKT/mTOR signal pathway. Western blotting was performed to detect the protein expressions of PI3K, p-AKT, AKT, p-mTOR, mTOR, CDC45, and MCM7 in HL-60 cells (A) and THP-1 cells (C). Overexpression of either CDC45 or MCM7 in HL-60 and THP-1 cells changed the expression levels of PI3K, p-AKT, AKT, p-mTOR, and mTOR. Changes in the expression levels of these proteins were also examined in cells overexpressing CDC45 and treated with MCM7 siRNA. (B and D) Column graphs showing the results from the experiments shown in panels (A) and (C). vector 1: pDONR223-vector; WT-CDC45: pDONR223-CDC45; vector 2: mEmerald-vector; WT-MCM7: mEmerald-MCM7; CDC45+Con siRNA: pDONR223-CDC45 and control siRNA co-transfected; CDC45+MCM7: pDONR223-CDC45 and MCM7 siRNA co-transfected.
Discussion
The development of microarray technology has rapidly increased the amount of available genetic data [24]. This study used bioinformatic tools to identify DEGs in two AML datasets (GSE65409 and GSE90062), which revealed a total of 1,173 up-regulated genes and 699 down-regulated genes. These DEGs were then subjected to GO and KEGG pathway analysis, which revealed enrichment of DNA replication and cell cycle functions. Ultimately, two hub genes (encoding CDC45 and MCM7) were identified.
As a member of the CMG complex, CDC45 plays an important role in DNA replication in eukaryotic cells [25]. In normal cells, the MCM2-7 complex is recruited to prepare for DNA replication during the G1 phase of the cell cycle, and CDC45 combines with the MCM2-7 complex during the S phase to form the replication CMG helicase complex under the promotion of cyclin dependent kinase [26]. In this context, activation of oncogenes can induce replication stress and ultimately cause collapse of the replication fork [27]. We analyzed the Gene Expression Omnibus and The Cancer Genome Atlas databases, which revealed that, relative to AML specimens, normal specimens had clearly higher mRNA expressions of CDC45 and MCM7, and the mRNA levels of CDC45 and MCM7 were positively correlated. Moreover, we found that low expressions of CDC45 and MCM7 were correlated with markers of malignant potential. However, previous studies of solid tumors have revealed different results in solid tumors, as colorectal, breast, and lung cancers had up-regulated expressions of CDC45, which promoted cell proliferation [5,7,28]. In addition, MCM7 overexpression is reportedly associated with poor outcomes for some cancer types [29]. Nevertheless, down-regulation of MCM7 protein expression has been observed in TRAIL-resistant P1 leukemia cells [30], and MCM7 variant genotypes and somatic mutations are associated with clinical and biologic features, as well as poor OS, in AML cases [31]. Furthermore, dramatic reductions in MCM7-positive cells are observed in the thymus and spleen, which should normally have the greatest cellular replication rate [32]. Thus, as the CDC45 and MCM7 proteins are crucial for cell proliferation and maintenance of genome stability, we suspect that their downregulated expression in AML cells might suggest impairment of their DNA-related functions.
To test this hypothesis, we induced overexpression of CDC45 and MCM7 in AML cells, and observed that CDC45 overexpression increased the expression of MCM7. Furthermore, overexpression of both proteins decreased cell proliferation and impaired the G1/S phase transition. Thus, proliferation of AML cells does not appear to be dependent on CDC45 and MCM7, and their overexpression may in fact down-regulate proliferation of AML cells. A previous report indicated that decreased MCM loading onto DNA resulted in abnormal cell cycle regulation, which might create genome instability [33]. We investigated how expression of CDC45/MCM7 regulated AML cell proliferation and observed that this effect might involve regulation of the PI3K/AKT signaling pathway. Moreover, PI3K/AKT/mTOR activation is observed in >60% of AML patients and is associated with overall survival [34]. Thus, activation of this pathway might be important in the development of leukemia. We also down-regulated MCM7 expression using siRNA, which abolished the effects of CDC45 overexpression on the PI3K/AKT/mTOR pathway. These results confirm that expression of CDC45/MCM7 suppressed the proliferation of AML cells by inhibiting the PI3K/AKT/mTOR signaling pathway. It is worth mentioning that many studies have suggested the CDC45/MCM7 complex plays a vital role in cell proliferation and cell cycle, but our results showed a new aspect of their function in cell proliferation in AML. This result needs to be verified by more clinical specimens and animal experiments in vivo, and the molecular mechanism needs to be further explored. Furthermore, in other tumors, especially in blood tumors, the role of CDC45/MCM7 needs more research. In conclusion, we used bioinformatic tools to identify two key proteins (CD45 and MCM7) that were downregulated in AML specimens. Low expressions of CDC45 and MCM7 were correlated with markers of malignant potential, which suggests that they might be useful prognostic factors or therapeutic targets. Moreover, overexpression of CDC45/MCM7 suppressed the proliferation of AML cells by inhibition of the PI3K/AKT/mTOR signaling pathway. Therefore, further studies are needed to clarify the relationship between CD45 and MCM7, as well as their applications in the diagnosis and treatment of AML.
Acknowledgements
This work was supported by the Shenyang Plan Project of Science and Technology [18-014-4-20] and the Joint Key R & D Program Project of Liaoning Province [2020JH 2/10300134]. The authors declare no competing financial interests. Funding agency did not participate in the design of the study, collection, analysis, interpretation of data and in writing the manuscript.
Disclosure of conflict of interest
None.
References
- 1.Sterling C, Webster J. Harnessing the immune system after allogeneic stem cell transplant in acute myeloid leukemia. Am J Hematol. 2020;95:529–547. doi: 10.1002/ajh.25750. [DOI] [PubMed] [Google Scholar]
- 2.Antar AI, Otrock ZK, Abou Dalle I, El-Cheikh J, Bazarbachi A. Pharmacologic therapies to prevent relapse of acute myeloid leukemia after allogeneic hematopoietic stem cell transplantation. Front Oncol. 2020;10:596134. doi: 10.3389/fonc.2020.596134. [DOI] [PMC free article] [PubMed] [Google Scholar]
- 3.Bell SP, Dutta A. DNA replication in eukaryotic cells. Annu Rev Biochem. 2002;71:333–374. doi: 10.1146/annurev.biochem.71.110601.135425. [DOI] [PubMed] [Google Scholar]
- 4.Li H, O’Donnell ME. The eukaryotic CMG helicase at the replication fork: emerging architecture reveals an unexpected mechanism. Bioessays. 2018;40:10. doi: 10.1002/bies.201700208. [DOI] [PMC free article] [PubMed] [Google Scholar]
- 5.Wu J, Lv Q, Huang H, Zhu M, Meng D. Screening and identification of key biomarkers in inflammatory breast cancer through integrated bioinformatic analyses. Genet Test Mol Biomarkers. 2020;24:484–491. doi: 10.1089/gtmb.2020.0047. [DOI] [PubMed] [Google Scholar]
- 6.Hu Y, Wang L, Li Z, Wan Z, Shao M, Wu S, Wang G. Potential prognostic and diagnostic values of CDC6, CDC45, ORC6 and SNHG7 in colorectal cancer. Onco Targets Ther. 2019;12:11609–11621. doi: 10.2147/OTT.S231941. [DOI] [PMC free article] [PubMed] [Google Scholar]
- 7.Huang J, Li Y, Lu Z, Che Y, Sun S, Mao S, Lei Y, Zang R, Li N, Zheng S, Liu C, Wang X, Sun N, He J. Analysis of functional hub genes identifies CDC45 as an oncogene in non-small cell lung cancer-a short report. Cell Oncol (Dordr) 2019;42:571–578. doi: 10.1007/s13402-019-00438-y. [DOI] [PubMed] [Google Scholar]
- 8.Perl AL, O’Connor CM, Fa P, Mayca Pozo F, Zhang J, Zhang Y, Narla G. Protein phosphatase 2A controls ongoing DNA replication by binding to and regulating cell division cycle 45 (CDC45) J Biol Chem. 2019;294:17043–17059. doi: 10.1074/jbc.RA119.010432. [DOI] [PMC free article] [PubMed] [Google Scholar]
- 9.Lang S, Huang L. The sulfolobus solfataricus GINS complex stimulates DNA binding and processive DNA unwinding by minichromosome maintenance helicase. J Bacteriol. 2015;197:3409–3420. doi: 10.1128/JB.00496-15. [DOI] [PMC free article] [PubMed] [Google Scholar]
- 10.Edwards MC, Tutter AV, Cvetic C, Gilbert CH, Prokhorova TA, Walter JC. MCM2-7 complexes bind chromatin in a distributed pattern surrounding the origin recognition complex in Xenopus egg extracts. J Biol Chem. 2002;277:33049–33057. doi: 10.1074/jbc.M204438200. [DOI] [PubMed] [Google Scholar]
- 11.Zhang XY, Tang LZ, Ren BG, Yu YP, Nelson J, Michalopoulos G, Luo JH. Interaction of MCM7 and RACK1 for activation of MCM7 and cell growth. Am J Pathol. 2013;182:796–805. doi: 10.1016/j.ajpath.2012.11.020. [DOI] [PMC free article] [PubMed] [Google Scholar]
- 12.Lee JS, Cheong HS, Koh Y, Ahn KS, Shin HD, Yoon SS. MCM7 polymorphisms associated with the AML relapse and overall survival. Ann Hematol. 2017;96:93–98. doi: 10.1007/s00277-016-2844-2. [DOI] [PubMed] [Google Scholar]
- 13.Lei X, Qing A, Yuan X, Qiu D, Li H. A landscape of lncRNA expression profile and the predictive value of a candidate lncRNA for silica-induced pulmonary fibrosis. DNA Cell Biol. 2020 doi: 10.1089/dna.2020.5531. [Epub ahead of print] [DOI] [PubMed] [Google Scholar]
- 14.Li P, Zhong X, Zhang L, Yu Y, Niu J. Bioinformatic investigation for candidate genes and molecular mechanism in the pathogenesis of membranous nephropathy. Nephrology (Carlton) 2021;26:262–269. doi: 10.1111/nep.13833. [DOI] [PubMed] [Google Scholar]
- 15.Wang Y, Zhou Z, Chen L, Li Y, Zhou Z, Chu X. Identification of key genes and biological pathways in lung adenocarcinoma via bioinformatics analysis. Mol Cell Biochem. 2020;476:931–939. doi: 10.1007/s11010-020-03959-5. [DOI] [PubMed] [Google Scholar]
- 16.Barrett T, Wilhite SE, Ledoux P, Evangelista C, Kim IF, Tomashevsky M, Marshall KA, Phillippy KH, Sherman PM, Holko M, Yefanov A, Lee H, Zhang N, Robertson CL, Serova N, Davis S, Soboleva A. NCBI GEO: archive for functional genomics data sets--update. Nucleic Acids Res. 2013;41:D991–995. doi: 10.1093/nar/gks1193. [DOI] [PMC free article] [PubMed] [Google Scholar]
- 17.Huang da W, Sherman BT, Lempicki RA. Systematic and integrative analysis of large gene lists using DAVID bioinformatics resources. Nat Protoc. 2009;4:44–57. doi: 10.1038/nprot.2008.211. [DOI] [PubMed] [Google Scholar]
- 18.Huang da W, Sherman BT, Lempicki RA. Bioinformatics enrichment tools: paths toward the comprehensive functional analysis of large gene lists. Nucleic Acids Res. 2009;37:1–13. doi: 10.1093/nar/gkn923. [DOI] [PMC free article] [PubMed] [Google Scholar]
- 19.Szklarczyk D, Gable AL, Lyon D, Junge A, Wyder S, Huerta-Cepas J, Simonovic M, Doncheva NT, Morris JH, Bork P, Jensen LJ, Mering CV. STRING v11: protein-protein association networks with increased coverage, supporting functional discovery in genome-wide experimental datasets. Nucleic Acids Res. 2019;47:D607–D613. doi: 10.1093/nar/gky1131. [DOI] [PMC free article] [PubMed] [Google Scholar]
- 20.Tang Z, Li C, Kang B, Gao G, Li C, Zhang Z. GEPIA: a web server for cancer and normal gene expression profiling and interactive analyses. Nucleic Acids Res. 2017;45:W98–W102. doi: 10.1093/nar/gkx247. [DOI] [PMC free article] [PubMed] [Google Scholar]
- 21.Chen Y, Pourabdollah M, Atenafu EG, Tierens A, Schimmer A, Chang H. Re-evaluation of acute erythroid leukemia according to the 2016 WHO classification. Leuk Res. 2017;61:39–43. doi: 10.1016/j.leukres.2017.08.011. [DOI] [PubMed] [Google Scholar]
- 22.Duan Y, Haybaeck J, Yang Z. Therapeutic potential of PI3K/AKT/mTOR pathway in gastrointestinal stromal tumors: rationale and progress. Cancers (Basel) 2020;12:2972. doi: 10.3390/cancers12102972. [DOI] [PMC free article] [PubMed] [Google Scholar]
- 23.Ma RJ, Tan YQ, Zhou G. Aberrant IGF1-PI3K/AKT/MTOR signaling pathway regulates the local immunity of oral lichen planus. Immunobiology. 2019;224:455–461. doi: 10.1016/j.imbio.2019.01.004. [DOI] [PubMed] [Google Scholar]
- 24.Tao Z, Shi A, Li R, Wang Y, Wang X, Zhao J. Microarray bioinformatics in cancer-a review. J BUON. 2017;22:838–843. [PubMed] [Google Scholar]
- 25.Liu L, Zhang Y, Zhang J, Wang JH, Cao Q, Li Z, Campbell JL, Dong MQ, Lou H. Characterization of the dimeric CMG/pre-initiation complex and its transition into DNA replication forks. Cell Mol Life Sci. 2020;77:3041–3058. doi: 10.1007/s00018-019-03333-9. [DOI] [PMC free article] [PubMed] [Google Scholar]
- 26.Xu X, Wang JT, Li M, Liu Y. TIMELESs suppresses the accumulation of aberrant CDC45·MCM2-7·GINS replicative helicase complexes on human chromatin. J Biol Chem. 2016;291:22544–22558. doi: 10.1074/jbc.M116.719963. [DOI] [PMC free article] [PubMed] [Google Scholar]
- 27.Klusmann I, Rodewald S, Müller L, Friedrich M, Wienken M, Li Y, Schulz-Heddergott R, Dobbelstein M. p53 activity results in DNA replication fork processivity. Cell Rep. 2016;17:1845–1857. doi: 10.1016/j.celrep.2016.10.036. [DOI] [PubMed] [Google Scholar]
- 28.Yang S, Ren X, Liang Y, Yan Y, Zhou Y, Hu J, Wang Z, Song F, Wang F, Liao W, Liao W, Ding Y, Liang L. KNK437 restricts the growth and metastasis of colorectal cancer via targeting DNAJA1/CDC45 axis. Oncogene. 2020;39:249–261. doi: 10.1038/s41388-019-0978-0. [DOI] [PubMed] [Google Scholar]
- 29.Zhong X, Chen X, Guan X, Zhang H, Ma Y, Zhang S, Wang E, Zhang L, Han Y. Overexpression of G9a and MCM7 in oesophageal squamous cell carcinoma is associated with poor prognosis. Histopathology. 2015;66:192–200. doi: 10.1111/his.12456. [DOI] [PubMed] [Google Scholar]
- 30.Petrak J, Toman O, Simonova T, Halada P, Cmejla R, Klener P, Zivny J. Identification of molecular targets for selective elimination of TRAIL-resistant leukemia cells. From spots to in vitro assays using TOP15 charts. Proteomics. 2009;9:5006–5015. doi: 10.1002/pmic.200900335. [DOI] [PubMed] [Google Scholar]
- 31.Tripon F, Iancu M, Trifa A, Crauciuc GA, Boglis A, Dima D, Lazar E, Bănescu C. Modelling the effects of MCM7 variants, somatic mutations, and clinical features on acute myeloid leukemia susceptibility and prognosis. J Clin Med. 2020;9:158. doi: 10.3390/jcm9010158. [DOI] [PMC free article] [PubMed] [Google Scholar]
- 32.Khalili K, Del Valle L, Muralidharan V, Gault WJ, Darbinian N, Otte J, Meier E, Johnson EM, Daniel DC, Kinoshita Y, Amini S, Gordon J. Puralpha is essential for postnatal brain development and developmentally coupled cellular proliferation as revealed by genetic inactivation in the mouse. Mol Cell Biol. 2003;23:6857–6875. doi: 10.1128/MCB.23.19.6857-6875.2003. [DOI] [PMC free article] [PubMed] [Google Scholar]
- 33.Orr SJ, Gaymes T, Ladon D, Chronis C, Czepulkowski B, Wang R, Mufti GJ, Marcotte EM, Thomas NS. Reducing MCM levels in human primary T cells during the G(0)-->G(1) transition causes genomic instability during the first cell cycle. Oncogene. 2010;29:3803–3814. doi: 10.1038/onc.2010.138. [DOI] [PMC free article] [PubMed] [Google Scholar]
- 34.Darici S, Alkhaldi H, Horne G, Jørgensen HG, Marmiroli S, Huang X. Targeting PI3K/Akt/mTOR in AML: rationale and clinical evidence. J Clin Med. 2020;9:2934. doi: 10.3390/jcm9092934. [DOI] [PMC free article] [PubMed] [Google Scholar]


