Abstract
FAM107A may have a dual role in regulating the biological functions of tumors; however, its role in prostate adenocarcinoma (PRAD) remains unknown. We analyzed FAM107A expression by employing databases to clarify its potential prognostic value for PRAD, as well as its role in the pathogenesis of PRAD. We observed that the FAM107A expression level is decreased in PRAD, and the reduced expression is considerably associated with poor overall survival and progression-free survival (PFS). To explore the mechanism of FAN107A in PRAD, we performed an immune cell infiltration analysis and a gene set enrichment analysis. The results showed that FAM107A expression is positively related to mast cells and natural killer cells. The Wnt signaling pathway, the MAPK signaling pathway, and the immune responses are differentially enriched in the FAM107A high-expression phenotype. The FAM107A low-expression phenotype is linked to apoptosis-induced DNA fragmentation and DNA methylation in PRAD. To assess the relationship between the clinical features and the FAM107A expression, we performed a logistic regression analysis and observed that a decreased FAM107A expression is associated with poor prognostic features, including the T stage, the N stage, the Gleason score, residual tumors, and the TP53 status. Our multivariate Cox regression results showed that the Gleason score, the primary therapy outcome, and the FAM107A expression are independent prognostic factors in PFS. In summary, we consider FAM107A an independent risk factor for PFS in PRAD. Moreover, several pathways may reveal the role of FAM107A in triggering carcinogenesis. These discoveries provide novel perspectives for future research to elucidate the pathogenic mechanism underlying PRAD.
Keywords: FAM107A, prostate cancer, prognosis, therapeutic targets
Introduction
According to Global Cancer Epidemic Statistics (GLOBOCAN) 2018, prostate adenocarcinoma (PRAD) is the second-most prevalent cancer and the fifth-greatest cause of cancer-related death in men [1]. Prostatic special antigen (PSA) is a crucial biomarker for the diagnosis of PRAD, as well as for determining its prognosis and treatment effectiveness. Reportedly, PSA concentration can be associated with the prostate size, the number of glandular epithelia [2], and other factors, such as age [3], body mass index (BMI) [4], drugs [5], and race [6]. Some studies have revealed that PSA has a low specificity, presenting false positives when both benign prostatic hyperplasia and prostatitis are present [7,8]. For PRAD treatment, hormone therapy significantly improves patients’ progression-free survival (PFS) and overall median survival [9,10]. However, approximately 10-20% of advanced PRAD cases develop into castration-resistant PRAD. Therefore, identifying new biomarkers and therapeutic targets remains of vital clinical significance for patients with PRAD.
FAM107A (Family with Sequence Similarity 107 Member A), also known as downregulated renal cell carcinoma gene 1 (DRR1), was designated by Tohoku University cDNA clone A on chromosome 3 (TU3A) [11,12]. FAM107A is a protein coding gene that encodes a protein present in the nucleus, composed of 144 amino acids with a coiled-coil domain. Therefore, FAM107A can regulate gene expression by interacting with DNA and/or other proteins [13]. FAM107A expression is reduced in several types of cancer, including neuroblastoma carcinogenesis [11], renal cell carcinoma [12], lung cancer [14], and laryngeal tumors [15]. FAM107A also plays a critical role in promoting tumor cell proliferation [16]. However, Ma et al. found that FAM107A is overexpressed in glioblastoma, and FAM107A overexpression can be related to poor clinical outcomes [17]. Therefore, FAM107A may play dual roles in regulating the biological functions of neoplasms.
In recent years, bioinformatics has been widely employed to study tumor genesis and development induced by gene alterations. With technological developments, a large amount of shared biological data has emerged, and analyzing these big data is now a major research hotspot. In the present study, we aimed to clarify the role of FAM107A in PRAD pathogenesis and its potential prognostic value in patients with PRAD. To achieve this goal, we assessed FAM107A expression in PRAD and normal tissues from The Cancer Genome Atlas (TCGA) database, analyzed the relationship between the expression of FAM107A and clinical features in PRAD, and used gene set enrichment analysis (GSEA) to explore the underlying mechanism of FAM107A in PRAD.
Materials and methods
RNA-sequencing patient data
The RNA-Seq data (HTSeq-FPKM and HTSeq-counts) of 495 PRAD samples, as well as the corresponding clinical information, were downloaded from the TCGA-PRAD project (https://portal.gdc.cancer.gov/). Among them, 52 prostate cancer tissues with paired adjacent samples were available. We excluded patients with PRAD presenting an overall survival (OS) of less than 30 days. Then, the level 3 HTSeq-FPKM was converted to transcripts per million (TPM) for the subsequent analyses. According to the median level of FAM107A expression, the tumor samples were divided into high and low FAM107A expression groups. The characteristics of 495 patients, including their TNM stages, Gleason scores, primary therapy outcomes, residual tumors, races, zones of origin, TP53 statuses, ages, and PSAs, are summarized in Supplementary Table 1. The mRNA expressions of FAM107A was analyzed using the Oncomine database (https://www.oncomine.org/). The threshold settings were as follows: P-value, 0.05; fold change, 1.5; gene ranking, top 5%. The Human Protein Atlas (HPA) (http://www.proteinatlas.org/) was used to verify the FAM107A expression at the translational level [18]. The mRNA expressions of FAM107A in the cancer cell lines and the prostate cancer cell lines were verified using the Cancer Cell Line Encyclopedia (CCLE) (https://www.broadinstitute.org/ccle) [19].
Differentially expressed gene (DEGs) analysis and immune infiltration analysis
In the present study, the DEGs between the high and low FAM107A expression groups were identified using HTSeq-counts data from the DESeq2 package [20]. The genes with an adjusted P<0.05 and |log2 Fold Change| (|log2FC|)>l.5 were considered DEGs. The immune infiltration analysis of PRAD was performed using a single sample gene set enrichment analysis (ssGSEA) with the GSVA package [21]. Based on the signature genes of the 24 immunocyte types described in the medical literature [22], all the relative enrichment scores of every immunocyte were quantified from the gene expression profile for each tumor sample.
Gene set enrichment analysis (GSEA)
Our GSEA, conducted using R package cluster Profiler [23], was performed between the high and low FAM107A expression groups. Function or pathway terms with a |Normalized enrichment score| (|NES|)>1, an adjusted P<0.05, and a false discovery rate (FDR) <0.25 were regarded as a meaningful enrichment.
Survival analysis
Wilcoxon rank-sum tests and Wilcoxon signed-rank tests were used to analyze the FAM107A expressions in the non-paired and paired samples, respectively. Receiver Operating Characteristic (ROC) curves were drawn, and the area under the curve (AUC) was calculated to evaluate the diagnostic efficacy of FAM107A in PRAD. The prognostic analysis data used in this study were all derived from the study by Liu et al. [24]. The Kaplan-Meier approach and a logistic regression were performed to assess the prognostic value of FAM107A for PRAD and to determine the relationship between the clinical features and the FAM107A expression, respectively. Cox regressions were performed to evaluate the factors contributing to the prognosis. In addition, a nomogram was constructed based on the results of a multivariate Cox regression.
Results
The role of FAM107A in PRAD
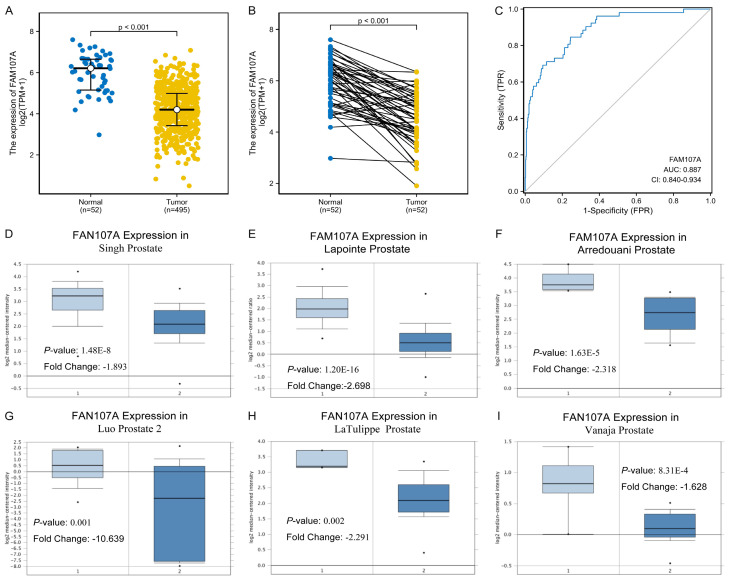
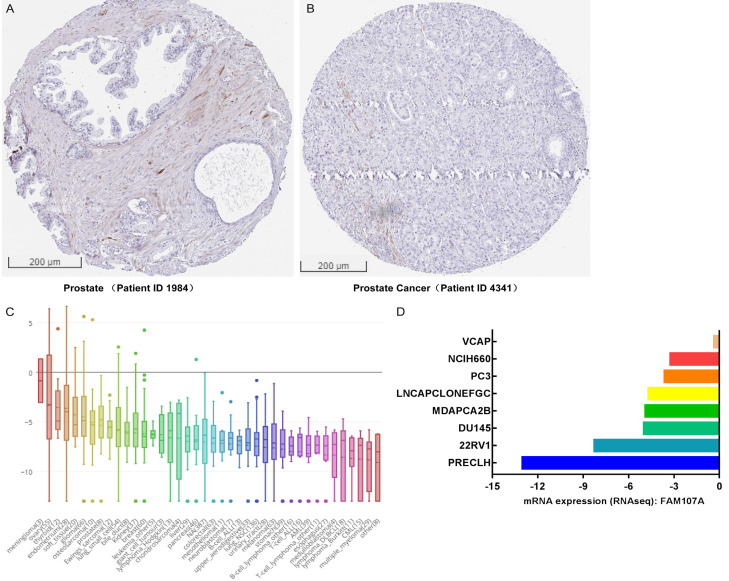
As shown in Figure 1A and 1B, the FAM107A expression significantly differed between the normal and the tumor tissues (P<0.001), with low expressions observed in the PRAD from TCGA. In addition, the AUC of FAM107A was 0.887, which suggests that FAM107A may be a potential diagnostic molecule (Figure 1C). Multiple datasets from the Oncomine database revealed that the mRNA expression of FAM107A is significantly lower in PRAD than in normal tissues (P<0.001), as shown in Figure 1D-I [25-30]. The results from the Kaplan-Meier survival analysis revealed that low the FAM107A expression in PRAD is related to poor OS (hazard ratio [HR]=0.12, 95% CI: 0.02-0.99, P=0.049) (Figure 2A) and PFS (HR=0.51, 95% CI: 0.33-0.78, P=0.002) (Figure 2B). Moreover, the immunohistochemical staining obtained from the HPA database showed a low expression of FAM107A in PRAD (Figure 3A, 3B). From the CCLE database, we observed that the mRNA expressions of FAM107A were low in both the cancer and prostate cancer cell lines (Figure 3C, 3D).
Figure 1.
The role of FAM107A in prostate cancer (TCGA and Oncomine). A. The expression of FAM107A in the 52 adjacent tissues samples and the 495 human prostate cancer (PRAD) samples in the TCGA. B. The expression of FAM107A in 52 PRAD samples and the corresponding paired adjacent samples of PRAD in TCGA. C. The ROC analysis evaluates the diagnostic efficacy of FAM107A in PRAD. D-I. The mRNA levels of FAM107A in Singh Prostate, Lapointe Prostate, Arredouani Prostate, Luo Prostate 2, LaTulippe Prostate, and Vanaja Prostate, respectively.
Figure 2.
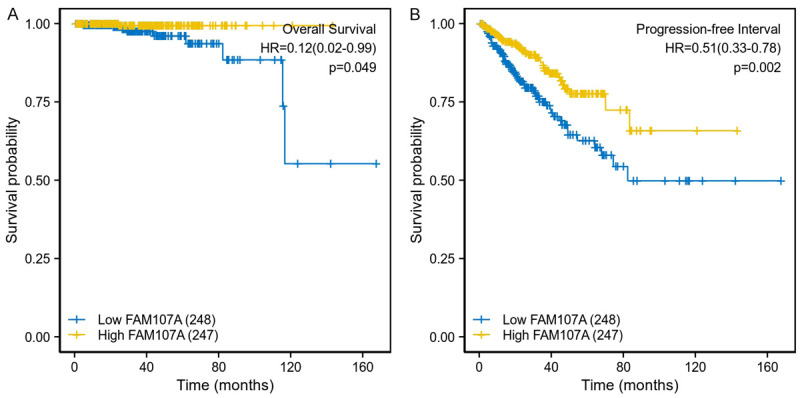
The Kaplan-Meier survival curves comparing the high and low expression of FAM107A in prostate cancer. A. Overall survival of the high and low FAM107A expression groups. B. Progression free survival of the high and low FAM107A expression groups.
Figure 3.
FAM107A expressions in the prostate cancer tissues and cell lines. A, B. Immunohistochemical staining of FAM107A in the prostate tissues and the prostate cancer tissues in the HPA database. C, D. The mRNA expression of FAM107A in cancer cell lines and prostate cancer cell lines in the CCLE database.
Potential mechanism of FAM107A in regulating the progression of PRAD
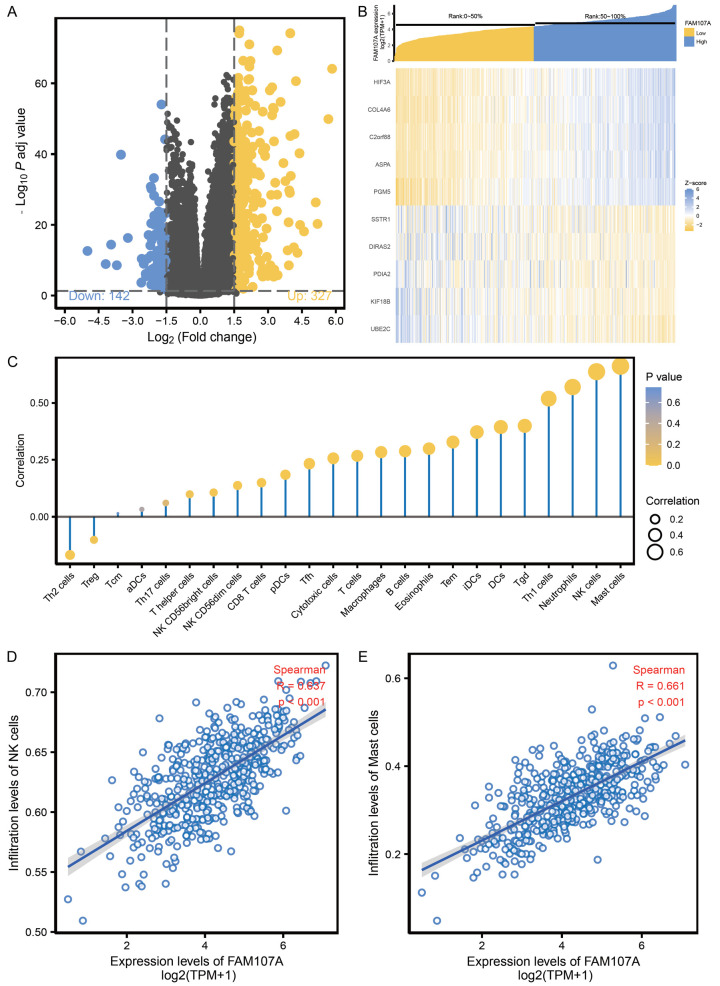
Based on the cutoff standard (adjust P<0.05, |logFC|>1.5), a total of 469 DEGs were identified in the FAM107A high and low expression groups, of which 142 were downregulated and 327 were upregulated (Figure 4A). The heat map shows the top 5 upregulated and downregulated DEGs between the FAM107A high and low expression groups (Figure 4B). A Spearman correlation was employed to reveal the relationship between the expression level of FAM107A and the immune cell infiltration level, quantified by ssGSEA, in the PRAD microenvironment (Figure 4C). The results showed that the FAM107A expression is positively related to natural killer (NK) cells (R=0.637, P<0.001, Figure 4D) and mast cells (R=0.661, P<0.001, Figure 4E).
Figure 4.
The potential mechanism of FAM107A in regulating the progression of PRAD. A. Volcano plot of the differentially expressed genes between the high and low FAM107A expression groups. B. Heat map of the top 5 differentially expressed genes between the high and low FAM107A expression groups. C. Correlation between the relative abundances of the 24 immune cells and the FAM107A expression level. D. Correlation between the relative enrichment score of the NK cells and the expression level of FAM107A of PRAD. E. The correlation between the relative enrichment score of the mast cells and the expression level of FAM107A of PRAD.
FAM107A-related signaling pathways based on GSEA
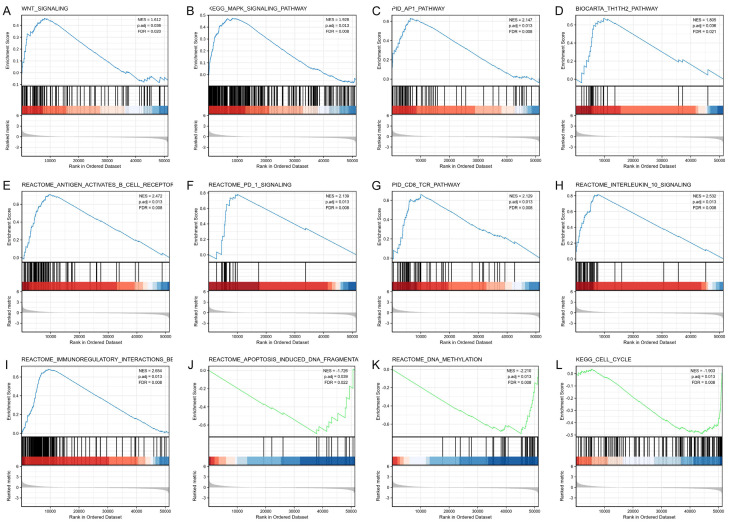
Then, a GSEA was performed to further explore the underlying mechanism of FAM107A in PRAD. Meaningful differences were observed in the enrichment of the MSigDB Collections (c2.cp.v7.0. symbols) of several pathways. Various biological processes were significantly enriched in FAM107A-PRAD, including the Wnt signaling pathway, the MAPK signaling pathway, the AP1 pathway, the Th1Th2 pathway, and the antigen activates B cell receptor (BCR) leading to the generation of second messengers, PD 1 signaling, the CD8 TCR pathway, interleukin 10 signaling, immunoregulatory interactions between lymphoid and non-lymphoid cells, apoptosis induced DNA fragmentation, DNA methylation, and the cell cycle (Figure 5). These results indicate that FAM107A is related to these data sets.
Figure 5.
Enrichment plots from the gene set enrichment analysis. A. WNT signaling pathway. B. MAPK signaling pathway. C. AP1 pathway. D. Th1Th2 pathway. E. Antigen activates the B cell receptor BCR leading to the generation of second messengers. F. PD 1 signaling. G. CD8 TCR pathway. H. Interleukin 10 signaling. I. Immunoregulatory interactions between a lymphoid and a non-lymphoid cell. J. Apoptosis induced DNA fragmentation. K. DNA methylation. L. The cell cycle.
The relationship between FAM107A expression and the clinical characteristics of PRAD
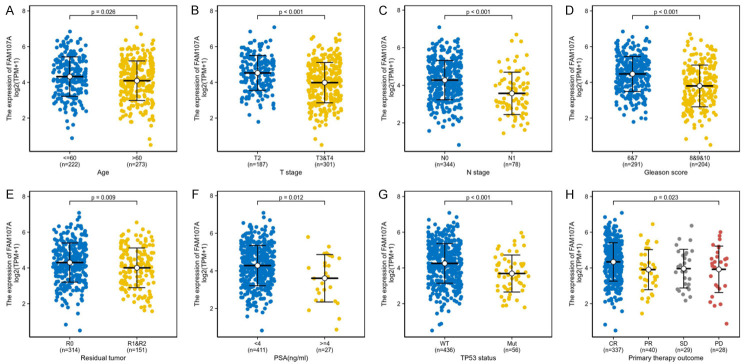
In total, 495 PRAD samples with FAM107A expression data were analyzed from the TCGA. Decreased FAM107A expression is significantly associated with age (P=0.026), T stage (P<0.001), N stage (P<0.001), the Gleason score (P<0.001), residual tumors (P=0.009), PSA (ng/mL) (P=0.012), the TP53 status (P<0.001), and the primary therapy outcome (P=0.023) (Figure 6). The logistic regression revealed that low FAM107A expression is significantly related to poor prognostic features, including T stage (P<0.001), N stage (P<0.001), the Gleason score (P<0.001), residual tumors (P=0.021), and the TP53 status (P=0.003) (Table 1).
Figure 6.
The relationship between the expression of FAM107A and the clinical characteristics of PRAD. A. Age. B. T stage. C. N stage. D. Gleason score. E. Residual tumor. F. PSA. G. TP53 status. H. Primary therapy outcome.
Table 1.
FAM107A expression associated with various clinical pathological characteristics (logistic regression)
| Characteristic | Total (N) | Odds Ratio in FAM107A expression | P value |
|---|---|---|---|
| T stage (T3&T4 vs. T2) | 488 | 0.46 (0.31-0.66) | <0.001 |
| N stage (N1 vs. N0) | 422 | 0.29 (0.16-0.50) | <0.001 |
| Gleason score (8&9&10 vs. 6&7) | 495 | 0.35 (0.24-0.50) | <0.001 |
| Residual tumor (R1&R2 vs. R0) | 465 | 0.63 (0.43-0.93) | 0.021 |
| PSA (ng/ml) (≥4 vs. <4) | 438 | 0.65 (0.28-1.41) | 0.278 |
| TP53 status (Mut vs. WT) | 492 | 0.40 (0.22-0.72) | 0.003 |
Cox regression analyses of survival
Our univariate analysis revealed that low FAM107A expression is related to poor PFS (Table 2) and shorter OS (Table 3). To further explore the relevant factors impacting PFS, we created a multivariate Cox regression model, incorporating variables presenting a P<0.1 in the univariate Cox regression in the multivariate Cox regression. The multivariate Cox regression revealed that FAM107A (P=0.013), the Gleason score (P<0.001), and the primary therapy outcome (P=0.029) are independent prognostic factors for PFS in PRAD.
Table 2.
The relationship between progression free survival and characteristics
| Characteristic | Total (N) | HR (95% CI) Univariate analysis | P value Univariate analysis | HR (95% CI) Multivariate analysis | P value Multivariate analysis |
|---|---|---|---|---|---|
| T stage (T3&T4 vs. T2) | 488 | 3.716 (2.100-6.575) | <0.001 | 1.915 (0.908-4.042) | 0.088 |
| N stage (N1 vs. N0) | 422 | 1.854 (1.137-3.026) | 0.013 | 0.796 (0.447-1.417) | 0.438 |
| M stage (M1 vs. M0) | 456 | 3.648 (0.505-26.354) | 0.200 | ||
| Gleason score (8&9&10 vs. 6&7) | 495 | 4.603 (2.909-7.284) | <0.001 | 3.802 (2.073-6.974) | <0.001 |
| Residual tumor (R1&R2 vs. R0) | 465 | 2.320 (1.533-3.510) | <0.001 | 1.552 (0.929-2.592) | 0.093 |
| PSA (ng/ml) (≥4 vs. <4) | 438 | 4.246 (2.119-8.510) | <0.001 | 1.820 (0.789-4.199) | 0.160 |
| Age (>60 vs. ≤60) | 495 | 1.274 (0.843-1.923) | 0.250 | ||
| Race (White vs. Asian & Black or African American) | 480 | 1.309 (0.726-2.360) | 0.371 | ||
| Zone of origin (Overlapping/Multiple Zones vs. Peripheral Zone) | 262 | 1.293 (0.794-2.108) | 0.302 | ||
| TP53 status (Mut vs. WT) | 492 | 2.086 (1.258-3.461) | 0.004 | 1.059 (0.613-1.830) | 0.836 |
| Primary therapy outcome (PD vs. CR&PR&SD) | 434 | 3.584 (2.080-6.175) | <0.001 | 2.059 (1.077-3.936) | 0.029 |
| FAM107A (High vs. Low) | 495 | 0.509 (0.333-0.777) | 0.002 | 0.524 (0.314-0.874) | 0.013 |
Table 3.
The relationship between overall survival and characteristics
| Characteristic | Total (N) | HR (95% CI) Univariate analysis | P value Univariate analysis | HR (95% CI) Multivariate analysis | P value Multivariate analysis |
|---|---|---|---|---|---|
| T stage (T3&T4 vs. T2) | 488 | 3.298 (0.613-17.743) | 0.165 | ||
| N stage (N1 vs. N0) | 422 | 3.609 (0.799-16.298) | 0.095 | 1.186 (0.173-8.122) | 0.862 |
| M stage (M1 vs. M0) | 456 | 59.119 (6.491-538.418) | <0.001 | 0.000 (0.000-Inf) | 0.999 |
| Gleason score (8&9&10 vs. 6&7) | 495 | 6.698 (1.381-32.493) | 0.018 | 3.736 (0.449-31.068) | 0.223 |
| Residual tumor (R1&R2 vs. R0) | 465 | 2.627 (0.704-9.804) | 0.151 | ||
| PSA (ng/ml) (≥4 vs. <4) | 438 | 10.412 (2.457-44.129) | 0.001 | 1.317 (0.091-19.067) | 0.840 |
| Age (>60 vs. ≤60) | 495 | 1.583 (0.442-5.669) | 0.480 | ||
| Race (White vs. Asian & Black or African American) | 480 | 1.615 (0.308-8.470) | 0.571 | ||
| Zone of origin (Overlapping/Multiple Zones vs. Peripheral Zone) | 262 | 1.666 (0.445-6.245) | 0.449 | ||
| TP53 status (Mut vs. WT) | 492 | 2.128 (0.523-8.653) | 0.291 | ||
| Primary therapy outcome (PD vs. SD&PR&CR) | 434 | 9.813 (2.413-39.914) | 0.001 | 4.152 (0.514-33.549) | 0.182 |
| FAM107A (High vs. Low) | 495 | 0.125 (0.016-0.994) | 0.049 | 0.149 (0.017-1.342) | 0.090 |
Construction and evaluation of the nomogram
As shown in Figure 7A, to provide a suitable method to quantitatively predict the PRAD prognosis, a nomogram was constructed using the Gleason score, the primary therapy outcome, and FAM107A. The C-index for the nomogram was 0.731 (95% CI: 0.705-0.757) with 1000 bootstrap replicates. The calibration plots indicated that the prediction using the FAM107A-related nomogram was consistent with the actual observation for the 3-(red line), 5-(blue line), and 8-(green line) year PFS probability (Figure 7B). In summary, the nomogram was a reliable model when compared with the individual prognostic factors to predict PFS in PRAD.
Figure 7.
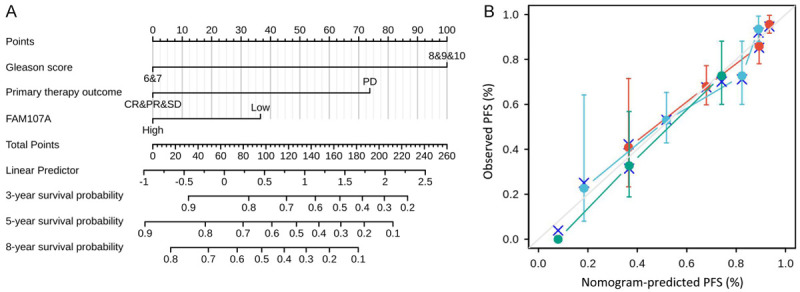
Construction and validation of a nomogram based on the FAM107A. A. Nomogram for predicting the probability of 3-, 5-, and 8-year PFS for PRAD. B. Calibration plot of the nomogram for predicting the probability of 3 (red line), 5 (blue line), and 8 (green line) year PFS for PRAD.
The prognostic value of FAM107A in the progression-free survival of different subgroups of PRAD
As shown in Figure 8, low FAM107A expression correlated with worse PFS in terms of age ≤60 (HR=0.377, 95% CI: 0.191-0.744, P=0.005), T2 of T stage (HR=0.264, 95% CI: 0.082-0.848, P=0.025), N0 of N stage (HR=0.489, 95% CI: 0.293-0.816, P=0.006), 6&7 of Gleason score (HR=0.275, 95% CI: 0.118-0.638, P=0.003), CR&PR&SD of the primary therapy outcome (HR=0.451, 95% CI: 0.277-0.733, P=0.001), PSA (ng/mL)<4 (HR=0.555, 95% CI: 0.353-0.873, P=0.011), PSA (ng/mL) ≥4 (HR=0.113, 95% CI: 0.013-0.979, P=0.048), the WT of the TP53 status (HR=0.496, 95% CI: 0.307-0.801, P=0.004), the R0 of the residual tumor (HR=0.492, 95% CI: 0.270-0.895, P=0.020), and the R1&R2 of the residual tumor (HR=0.474, 95% CI: 0.253-0.885, P=0.019). These results suggest that the FAM107A expression level can impact the PFS in different PRAD subgroups.
Figure 8.
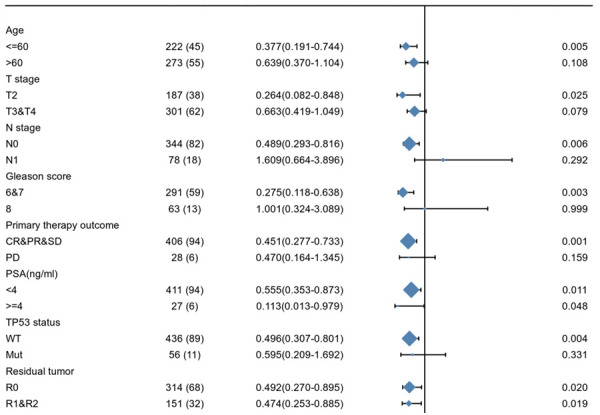
The prognostic value of FAM107A in the progression free survival of various subgroups of PRAD.
Discussion
In recent years, the expressions and mechanisms of FAM107A have been documented in some malignant tumors. FAM107A, a protein coding gene, reportedly suppresses renal cancer cell proliferation and induces apoptosis [12]. Similar results were reported for lung cancer [16] and neuroblastoma [11]. FAM107A promoter hypermethylation has been observed in lung cancer [13], laryngeal tumors [15], and hepatocellular carcinoma [31]. In addition, Le et al. found high FAM107A expressions in invasive glioblastoma, promoting brain cancer invasion via regulation of cytoskeletal-focal adhesion dynamics [32]. Ma et al. have demonstrated that FAM107A has a critical role in promoting glioblastoma invasion and the epithelial-mesenchymal transition via AKT activation [17]. Dudley et al. have indicated that FAM107A regulates AKT activation to drive brain cancer invasion [33]. Based on these studies, FAM107A is closely related to various cancers, and multiple mechanisms are closely associated with FAM107A expression. To the best of our knowledge to date, the expression of FAM107A and its potential prognostic impact on PRAD has not been explored; the potential role of FAM107A in PRAD is the primary focus of this study.
Herein, by employing bioinformatic tools, we found that FAM107A expression is decreased in PRAD, which is consistent with a previous study [34]. Decreased FAM107A expression in PRAD is considerably associated with poor OS and PFS. Furthermore, a decreased FAM107A expression is related to poor prognostic features, including T stage, N stage, the Gleason score, residual tumors, and the TP53 status. In addition, our multivariate Cox regression analysis revealed that the Gleason score, the primary therapy outcome, and FAM107A are independent prognostic factors for PFS. As reported in previous studies, the Gleason score is an independent prognostic factor [35,36]. Based on the results of our multivariate Cox regression, we constructed nomograms, which reveal better performance than the conventional staging systems in some cancers [37,38]. The nomogram, which includes the Gleason score, the primary therapy outcomes, and FAM107A, is a better model for predicting PFS in PRAD than the individual prognostic factors.
To further explore the function of FAM107A in PRAD, we used the TCGA data for ssGSEA and GSEA. The ssGSEA results indicated that the FAM107A expression is positively related to mast cells and NK cells, indicating that FAM107A possibly regulates the functions of the mast cells and NK cells in PRAD. NK cells, which were first identified in 1975, are a type of cell that differs from T cells and B cells. Mast cells are among the most important immune cells, and they play key roles in innate immunity, adaptive immunity, and immune regulation. Reportedly, mast cells may exert anti-tumor effects by enhancing inflammation and the anti-tumor response, as well as by inducing cell apoptosis and reducing cell mobility [39]. NK cells have the inherent ability to kill cancer cells and play a significant role in the immune monitoring of cancer cells [40]. Furthermore, a growing number of studies have revealed that NK cells demonstrate an excellent anti-tumor effect [41-44]. The GSEA results showed that the Wnt signaling pathway, the MAPK signaling pathway, the AP1 pathway, and the immune responses, such as the Th1Th2 pathway and PD 1 signaling, are differentially enriched in the FAM107A high-expression phenotype. Wnt signaling has been suggested as a key signaling pathway impacting PRAD through various mechanisms, including regulating androgen receptors, the proliferation of PRAD stem cells, promoting osteoblast metastasis, and anti-androgen therapy [45,46]. Previous studies have shown that activation of the MAPK pathway is closely related to PRAD progression, but the inhibition of the MAPK pathway can effectively prevent the occurrence of metastatic PRAD [47,48]. It has been reported that AP-1 can regulate the occurrence, progression, and recurrence of PRAD [49]. Although immunotherapy for PRAD remains limited, some progress has been achieved [50]. The related immune responses also provide a novel perspective in terms of the PRAD targets and mechanisms. In addition, the FAM107A low-expression phenotype is significantly related to apoptosis-induced DNA fragmentation, DNA methylation, and the cell cycle in PRAD. Collectively, these results suggest that FAM107A not only acts as a latent prognostic marker but can be developed as a potential therapeutic target in PRAD.
Although this study showed the correlation between FAM107A and PRAD, it still has some limitations. As our study is based on a bioinformatics analysis with no external dataset validation, biases resulting from the confounding factors may be present. Additional investigations need to be performed to identify the validation set cohort data. Furthermore, multi-center large scale clinical studies should be undertaken to verify these findings. The mechanism of action of FAM107A in PRAD has been revealed through datamining and predictions using bio-informatics data. Cell and animal experiments are needed to confirm the mechanism of FAM107A in PRAD.
In conclusion, this study, for the first time, shows the diagnostic and prognostic values of FAM107A in PRAD. Low FAM107A expressions are significantly related to short survival in PRAD. Moreover, several pathways can reveal the possible associations of FAM107A in triggering carcinogenesis. These discoveries provide novel targets for future research to clarify the pathogenic mechanisms of PRAD.
Acknowledgements
This research was supported by the National Natural Science Foundation of China (No. 81673924) and the Beijing Natural Science Foundation (7202065).
Disclosure of conflict of interest
None.
Supporting Information
References
- 1.Bray F, Ferlay J, Soerjomataram I, Siegel RL, Torre LA, Jemal A. Global cancer statistics 2018: GLOBOCAN estimates of incidence and mortality worldwide for 36 cancers in 185 countries. CA Cancer J Clin. 2018;68:394–424. doi: 10.3322/caac.21492. [DOI] [PubMed] [Google Scholar]
- 2.Pérez-Ibave DC, Burciaga-Flores CH, Elizondo-Riojas M. Prostate-specific antigen (PSA) as a possible biomarker in non-prostatic cancer: a review. Cancer Epidemiol. 2018;54:48–55. doi: 10.1016/j.canep.2018.03.009. [DOI] [PubMed] [Google Scholar]
- 3.Oesterling JE, Jacobsen SJ, Chute CG, Guess HA, Girman CJ, Panser LA, Lieber MM. Serum prostate-specific antigen in a community-based population of healthy men. Establishment of age-specific reference ranges. JAMA. 1993;270:860–864. [PubMed] [Google Scholar]
- 4.Baillargeon J, Pollock BH, Kristal AR, Bradshaw P, Hernandez J, Basler J, Higgins B, Lynch S, Rozanski T, Troyer D, Thompson I. The association of body mass index and prostate-specific antigen in a population-based study. Cancer. 2005;103:1092–1095. doi: 10.1002/cncr.20856. [DOI] [PubMed] [Google Scholar]
- 5.Chang SL, Harshman LC, Presti JC Jr. Impact of common medications on serum total prostate-specific antigen levels: analysis of the national health and nutrition examination survey. J. Clin. Oncol. 2010;28:3951–3957. doi: 10.1200/JCO.2009.27.9406. [DOI] [PMC free article] [PubMed] [Google Scholar]
- 6.Ganpule AP, Desai MR, Manohar T, Bapat S. Age-specific prostate specific antigen and prostate specific antigen density values in a community-based Indian population. Indian J Urol. 2007;23:122–125. doi: 10.4103/0970-1591.32060. [DOI] [PMC free article] [PubMed] [Google Scholar]
- 7.Agnihotri S, Mittal RD, Kapoor R, Mandhani A. Asymptomatic prostatic inflammation in men with clinical BPH and erectile dysfunction affects the positive predictive value of prostate-specific antigen. Urol Oncol. 2014;32:946–951. doi: 10.1016/j.urolonc.2014.03.004. [DOI] [PubMed] [Google Scholar]
- 8.Zackrisson B, Aus G, Lilja H, Lodding P, Pihl CG, Hugosson J. Follow-up of men with elevated prostate-specific antigen and one set of benign biopsies at prostate cancer screening. Eur Urol. 2003;43:327–332. doi: 10.1016/s0302-2838(03)00044-7. [DOI] [PubMed] [Google Scholar]
- 9.Smith MR, Saad F, Chowdhury S, Oudard S, Hadaschik BA, Graff JN, Olmos D, Mainwaring PN, Lee JY, Uemura H, Lopez-Gitlitz A, Trudel GC, Espina BM, Shu Y, Park YC, Rackoff WR, Yu MK, Small EJ. Apalutamide treatment and metastasis-free survival in prostate cancer. N Engl J Med. 2018;378:1408–1418. doi: 10.1056/NEJMoa1715546. [DOI] [PubMed] [Google Scholar]
- 10.Hussain M, Fizazi K, Saad F, Rathenborg P, Shore N, Ferreira U, Ivashchenko P, Demirhan E, Modelska K, Phung D, Krivoshik A, Sternberg CN. Enzalutamide in men with nonmetastatic, castration-resistant prostate cancer. N Engl J Med. 2018;378:2465–2474. doi: 10.1056/NEJMoa1800536. [DOI] [PMC free article] [PubMed] [Google Scholar]
- 11.Asano Y, Kishida S, Mu P, Sakamoto K, Murohara T, Kadomatsu K. DRR1 is expressed in the developing nervous system and downregulated during neuroblastoma carcinogenesis. Biochem Biophys Res Commun. 2010;394:829–835. doi: 10.1016/j.bbrc.2010.03.085. [DOI] [PubMed] [Google Scholar]
- 12.Wang L, Darling J, Zhang JS, Liu W, Qian J, Bostwick D, Hartmann L, Jenkins R, Bardenhauer W, Schutte J, Opalka B, Smith DI. Loss of expression of the DRR 1 gene at chromosomal segment 3p21.1 in renal cell carcinoma. Genes Chromosomes Cancer. 2000;27:1–10. doi: 10.1002/(sici)1098-2264(200001)27:1<1::aid-gcc1>3.0.co;2-6. [DOI] [PubMed] [Google Scholar]
- 13.Awakura Y, Nakamura E, Ito N, Kamoto T, Ogawa O. Methylation-associated silencing of TU3A in human cancers. Int J Oncol. 2008;33:893–899. [PubMed] [Google Scholar]
- 14.Pastuszak-Lewandoska D, Czarnecka KH, Migdalska-Sęk M, Nawrot E, Domańska D, Kiszałkiewicz J, Kordiak J, Antczak A, Górski P, Brzeziańska-Lasota E. Decreased FAM107A expression in patients with non-small cell lung cancer. Adv Exp Med Biol. 2015;852:39–48. doi: 10.1007/5584_2014_109. [DOI] [PubMed] [Google Scholar]
- 15.Kiwerska K, Szaumkessel M, Paczkowska J, Bodnar M, Byzia E, Kowal E, Kostrzewska-Poczekaj M, Janiszewska J, Bednarek K, Jarmuż-Szymczak M, Kalinowicz E, Wierzbicka M, Grenman R, Szyfter K, Marszałek A, Giefing M. Combined deletion and DNA methylation result in silencing of FAM107A gene in laryngeal tumors. Sci Rep. 2017;7:5386. doi: 10.1038/s41598-017-05857-1. [DOI] [PMC free article] [PubMed] [Google Scholar]
- 16.Liu Q, Zhao XY, Bai RZ, Liang SF, Nie CL, Yuan Z, Wang CT, Wu Y, Chen LJ, Wei YQ. Induction of tumor inhibition and apoptosis by a candidate tumor suppressor gene DRR1 on 3p21.1. Oncol Rep. 2009;22:1069–1075. [PubMed] [Google Scholar]
- 17.Ma YS, Wu ZJ, Bai RZ, Dong H, Xie BX, Wu XH, Hang XS, Liu AN, Jiang XH, Wang GR, Jiang JJ, Xu WH, Chen XP, Tan GH, Fu D, Liu JB, Liu Q. DRR1 promotes glioblastoma cell invasion and epithelial-mesenchymal transition via regulating AKT activation. Cancer Lett. 2018;423:86–94. doi: 10.1016/j.canlet.2018.03.015. [DOI] [PubMed] [Google Scholar]
- 18.Uhlén M, Fagerberg L, Hallström BM, Lindskog C, Oksvold P, Mardinoglu A, Sivertsson Å, Kampf C, Sjöstedt E, Asplund A, Olsson I, Edlund K, Lundberg E, Navani S, Szigyarto CA, Odeberg J, Djureinovic D, Takanen JO, Hober S, Alm T, Edqvist PH, Berling H, Tegel H, Mulder J, Rockberg J, Nilsson P, Schwenk JM, Hamsten M, von Feilitzen K, Forsberg M, Persson L, Johansson F, Zwahlen M, von Heijne G, Nielsen J, Pontén F. Proteomics. Tissue-based map of the human proteome. Science. 2015;347:1260419. doi: 10.1126/science.1260419. [DOI] [PubMed] [Google Scholar]
- 19.Barretina J, Caponigro G, Stransky N, Venkatesan K, Margolin AA, Kim S, Wilson CJ, Lehar J, Kryukov GV, Sonkin D, Reddy A, Liu M, Murray L, Berger MF, Monahan JE, Morais P, Meltzer J, Korejwa A, Jane-Valbuena J, Mapa FA, Thibault J, Bric-Furlong E, Raman P, Shipway A, Engels IH, Cheng J, Yu GK, Yu J, Aspesi P Jr, de Silva M, Jagtap K, Jones MD, Wang L, Hatton C, Palescandolo E, Gupta S, Mahan S, Sougnez C, Onofrio RC, Liefeld T, MacConaill L, Winckler W, Reich M, Li N, Mesirov JP, Gabriel SB, Getz G, Ardlie K, Chan V, Myer VE, Weber BL, Porter J, Warmuth M, Finan P, Harris JL, Meyerson M, Golub TR, Morrissey MP, Sellers WR, Schlegel R, Garraway LA. The cancer cell line encyclopedia enables predictive modelling of anticancer drug sensitivity. Nature. 2012;483:603–607. doi: 10.1038/nature11003. [DOI] [PMC free article] [PubMed] [Google Scholar]
- 20.Love MI, Huber W, Anders S. Moderated estimation of fold change and dispersion for RNA-seq data with DESeq2. Genome Biol. 2014;15:550. doi: 10.1186/s13059-014-0550-8. [DOI] [PMC free article] [PubMed] [Google Scholar]
- 21.Hänzelmann S, Castelo R, Guinney J. GSVA: gene set variation analysis for microarray and RNA-seq data. BMC Bioinformatics. 2013;14:7. doi: 10.1186/1471-2105-14-7. [DOI] [PMC free article] [PubMed] [Google Scholar]
- 22.Bindea G, Mlecnik B, Tosolini M, Kirilovsky A, Waldner M, Obenauf AC, Angell H, Fredriksen T, Lafontaine L, Berger A, Bruneval P, Fridman WH, Becker C, Pagès F, Speicher MR, Trajanoski Z, Galon J. Spatiotemporal dynamics of intratumoral immune cells reveal the immune landscape in human cancer. Immunity. 2013;39:782–795. doi: 10.1016/j.immuni.2013.10.003. [DOI] [PubMed] [Google Scholar]
- 23.Yu G, Wang LG, Han Y, He QY. clusterProfiler: an R package for comparing biological themes among gene clusters. OMICS. 2012;16:284–287. doi: 10.1089/omi.2011.0118. [DOI] [PMC free article] [PubMed] [Google Scholar]
- 24.Liu J, Lichtenberg T, Hoadley KA, Poisson LM, Lazar AJ, Cherniack AD, Kovatich AJ, Benz CC, Levine DA, Lee AV, Omberg L, Wolf DM, Shriver CD, Thorsson V Cancer Genome Atlas Research Network. Hu H. An integrated TCGA pan-cancer clinical data resource to drive high-quality survival outcome analytics. Cell. 2018;173:400–416. e411. doi: 10.1016/j.cell.2018.02.052. [DOI] [PMC free article] [PubMed] [Google Scholar]
- 25.Singh D, Febbo PG, Ross K, Jackson DG, Manola J, Ladd C, Tamayo P, Renshaw AA, D’Amico AV, Richie JP, Lander ES, Loda M, Kantoff PW, Golub TR, Sellers WR. Gene expression correlates of clinical prostate cancer behavior. Cancer Cell. 2002;1:203–209. doi: 10.1016/s1535-6108(02)00030-2. [DOI] [PubMed] [Google Scholar]
- 26.Lapointe J, Li C, Higgins JP, van de Rijn M, Bair E, Montgomery K, Ferrari M, Egevad L, Rayford W, Bergerheim U, Ekman P, DeMarzo AM, Tibshirani R, Botstein D, Brown PO, Brooks JD, Pollack JR. Gene expression profiling identifies clinically relevant subtypes of prostate cancer. Proc Natl Acad Sci U S A. 2004;101:811–816. doi: 10.1073/pnas.0304146101. [DOI] [PMC free article] [PubMed] [Google Scholar]
- 27.Arredouani MS, Lu B, Bhasin M, Eljanne M, Yue W, Mosquera JM, Bubley GJ, Li V, Rubin MA, Libermann TA, Sanda MG. Identification of the transcription factor single-minded homologue 2 as a potential biomarker and immunotherapy target in prostate cancer. Clin Cancer Res. 2009;15:5794–5802. doi: 10.1158/1078-0432.CCR-09-0911. [DOI] [PMC free article] [PubMed] [Google Scholar]
- 28.Luo JH, Yu YP, Cieply K, Lin F, Deflavia P, Dhir R, Finkelstein S, Michalopoulos G, Becich M. Gene expression analysis of prostate cancers. Mol Carcinog. 2002;33:25–35. doi: 10.1002/mc.10018. [DOI] [PubMed] [Google Scholar]
- 29.LaTulippe E, Satagopan J, Smith A, Scher H, Scardino P, Reuter V, Gerald WL. Comprehensive gene expression analysis of prostate cancer reveals distinct transcriptional programs associated with metastatic disease. Cancer Res. 2002;62:4499–4506. [PubMed] [Google Scholar]
- 30.Vanaja DK, Cheville JC, Iturria SJ, Young CY. Transcriptional silencing of zinc finger protein 185 identified by expression profiling is associated with prostate cancer progression. Cancer Res. 2003;63:3877–3882. [PubMed] [Google Scholar]
- 31.Udali S, Guarini P, Ruzzenente A, Ferrarini A, Guglielmi A, Lotto V, Tononi P, Pattini P, Moruzzi S, Campagnaro T, Conci S, Olivieri O, Corrocher R, Delledonne M, Choi SW, Friso S. DNA methylation and gene expression profiles show novel regulatory pathways in hepatocellular carcinoma. Clin Epigenetics. 2015;7:43. doi: 10.1186/s13148-015-0077-1. [DOI] [PMC free article] [PubMed] [Google Scholar]
- 32.Le PU, Angers-Loustau A, de Oliveira RM, Ajlan A, Brassard CL, Dudley A, Brent H, Siu V, Trinh G, Mölenkamp G, Wang J, Seyed Sadr M, Bedell B, Del Maestro RF, Petrecca K. DRR drives brain cancer invasion by regulating cytoskeletal-focal adhesion dynamics. Oncogene. 2010;29:4636–4647. doi: 10.1038/onc.2010.216. [DOI] [PubMed] [Google Scholar]
- 33.Dudley A, Sater M, Le PU, Trinh G, Sadr MS, Bergeron J, Deleavey GF, Bedell B, Damha MJ, Petrecca K. DRR regulates AKT activation to drive brain cancer invasion. Oncogene. 2014;33:4952–4960. doi: 10.1038/onc.2013.436. [DOI] [PubMed] [Google Scholar]
- 34.Vanaja DK, Ballman KV, Morlan BW, Cheville JC, Neumann RM, Lieber MM, Tindall DJ, Young CY. PDLIM4 repression by hypermethylation as a potential biomarker for prostate cancer. Clin Cancer Res. 2006;12:1128–1136. doi: 10.1158/1078-0432.CCR-05-2072. [DOI] [PubMed] [Google Scholar]
- 35.Hurwitz LM, Agalliu I, Albanes D, Barry KH, Berndt SI, Cai Q, Chen C, Cheng I, Genkinger JM, Giles GG, Huang J, Joshu CE, Key TJ, Knutsen S, Koutros S, Langseth H, Li SX, MacInnis RJ, Markt SC, Penney KL, Perez-Cornago A, Rohan TE, Smith-Warner SA, Stampfer MJ, Stopsack KH, Tangen CM, Travis RC, Weinstein SJ, Wu L, Jacobs EJ, Mucci LA, Platz EA, Cook MB Prostate Cancer Cohort Consortium (PC3) Working Group. Recommended definitions of aggressive prostate cancer for etiologic epidemiologic research. J Natl Cancer Inst. 2021;113:727–734. doi: 10.1093/jnci/djaa154. [DOI] [PMC free article] [PubMed] [Google Scholar]
- 36.Hashimoto T, Nakashima J, Kashima T, Yamaguchi Y, Satake N, Nakagami Y, Namiki K, Ohno Y. Predicting factors for progression to castration resistance prostate cancer after biochemical recurrence in patients with clinically localized prostate cancer who underwent radical prostatectomy. Int J Clin Oncol. 2020;25:1704–1710. doi: 10.1007/s10147-020-01716-8. [DOI] [PubMed] [Google Scholar]
- 37.Wo Y, Yang H, Zhang Y, Wo J. Development and external validation of a nomogram for predicting survival in patients with stage ia non-small cell lung cancer ≤2 cm undergoing sublobectomy. Front Oncol. 2019;9:1385. doi: 10.3389/fonc.2019.01385. [DOI] [PMC free article] [PubMed] [Google Scholar]
- 38.Kim CG, Lee HW, Choi HJ, Lee JI, Lee HW, Kim SU, Park JY, Kim DY, Ahn SH, Han KH, Kim HS, Kim KH, Choi SJ, Kim Y, Lee KS, Kim GM, Kim MD, Won JY, Lee DY, Kim BK. Development and validation of a prognostic model for patients with hepatocellular carcinoma undergoing radiofrequency ablation. Cancer Med. 2019;8:5023–5032. doi: 10.1002/cam4.2417. [DOI] [PMC free article] [PubMed] [Google Scholar]
- 39.Dyduch G, Kaczmarczyk K, Okoń K. Mast cells and cancer: enemies or allies? Pol J Pathol. 2012;63:1–7. [PubMed] [Google Scholar]
- 40.Fang F, Xiao W, Tian Z. NK cell-based immunotherapy for cancer. Semin Immunol. 2017;31:37–54. doi: 10.1016/j.smim.2017.07.009. [DOI] [PubMed] [Google Scholar]
- 41.Sungur CM, Murphy WJ. Positive and negative regulation by NK cells in cancer. Crit Rev Oncog. 2014;19:57–66. doi: 10.1615/critrevoncog.2014010805. [DOI] [PMC free article] [PubMed] [Google Scholar]
- 42.Vivier E, Tomasello E, Baratin M, Walzer T, Ugolini S. Functions of natural killer cells. Nat Immunol. 2008;9:503–510. doi: 10.1038/ni1582. [DOI] [PubMed] [Google Scholar]
- 43.Martinet L, Smyth MJ. Balancing natural killer cell activation through paired receptors. Nat Rev Immunol. 2015;15:243–254. doi: 10.1038/nri3799. [DOI] [PubMed] [Google Scholar]
- 44.Shimasaki N, Coustan-Smith E, Kamiya T, Campana D. Expanded and armed natural killer cells for cancer treatment. Cytotherapy. 2016;18:1422–1434. doi: 10.1016/j.jcyt.2016.06.013. [DOI] [PubMed] [Google Scholar]
- 45.Wang Y, Singhal U, Qiao Y, Kasputis T, Chung JS, Zhao H, Chammaa F, Belardo JA, Roth TM, Zhang H, Zaslavsky AB, Palapattu GS, Pienta KJ, Chinnaiyan AM, Taichman RS, Cackowski FC, Morgan TM. Wnt signaling drives prostate cancer bone metastatic tropism and invasion. Transl Oncol. 2020;13:100747. doi: 10.1016/j.tranon.2020.100747. [DOI] [PMC free article] [PubMed] [Google Scholar]
- 46.Kothari V, Goodwin JF, Zhao SG, Drake JM, Yin Y, Chang SL, Evans JR, Wilder-Romans K, Gabbara K, Dylgjeri E, Chou J, Sun G, Tomlins SA, Mehra R, Hege K, Filvaroff EH, Schaeffer EM, Karnes RJ, Quigley DA, Rathkopf DE, He HH, Speers C, Spratt DE, Gilbert LA, Ashworth A, Chinnaiyan AM, Raj GV, Knudsen KE, Feng FY. DNA-dependent protein kinase drives prostate cancer progression through transcriptional regulation of the wnt signaling pathway. Clin Cancer Res. 2019;25:5608–5622. doi: 10.1158/1078-0432.CCR-18-2387. [DOI] [PMC free article] [PubMed] [Google Scholar]
- 47.Mulholland DJ, Kobayashi N, Ruscetti M, Zhi A, Tran LM, Huang J, Gleave M, Wu H. Pten loss and RAS/MAPK activation cooperate to promote EMT and metastasis initiated from prostate cancer stem/progenitor cells. Cancer Res. 2012;72:1878–1889. doi: 10.1158/0008-5472.CAN-11-3132. [DOI] [PMC free article] [PubMed] [Google Scholar]
- 48.Dasgupta P, Kulkarni P, Bhat NS, Majid S, Shiina M, Shahryari V, Yamamura S, Tanaka Y, Gupta RK, Dahiya R, Hashimoto Y. Activation of the Erk/MAPK signaling pathway is a driver for cadmium induced prostate cancer. Toxicol Appl Pharmacol. 2020;401:115102. doi: 10.1016/j.taap.2020.115102. [DOI] [PMC free article] [PubMed] [Google Scholar]
- 49.Thiel G, Welck J, Wissenbach U, Rössler OG. Dihydrotestosterone activates AP-1 in LNCaP prostate cancer cells. Int J Biochem Cell Biol. 2019;110:9–20. doi: 10.1016/j.biocel.2019.02.005. [DOI] [PubMed] [Google Scholar]
- 50.Schatten H. Immunodiagnostics and immunotherapy possibilities for prostate cancer. Adv Exp Med Biol. 2018;1096:185–194. doi: 10.1007/978-3-319-99286-0_10. [DOI] [PubMed] [Google Scholar]
Associated Data
This section collects any data citations, data availability statements, or supplementary materials included in this article.


