

Abstract
Elevated intraocular pressure (IOP) is the only modifiable risk factor for primary open-angle glaucoma (POAG). Herein we sought to prioritize a set of previously identified IOP-associated genes using novel and previously published datasets. We identified several genes for future study, including several involved in cytoskeletal/extracellular matrix reorganization, cell adhesion, angiogenesis, and TGF-β signaling. Our differential correlation analysis of IOP-associated genes identified 295 pairs of 201 genes with differential correlation. Pathway analysis identified β-estradiol as the top upstream regulator of these genes with ESR1 mediating 25 interactions. Several genes (i.e., EFEMP1, FOXC1, and SPTBN1) regulated by β-estradiol/ESR1 were highly expressed in non-glaucomatous human trabecular meshwork (TM) or Schlemm’s canal (SC) cells and specifically expressed in TM/SC cell clusters defined by single-cell RNA-sequencing. We confirmed ESR1 gene and protein expression in human TM cells and TM/SC tissue with quantitative real-time PCR and immunofluorescence, respectively. 17β-estradiol was identified in bovine, porcine, and human aqueous humor (AH) using ELISA. In conclusion, we have identified estrogen receptor signaling as a key modulator of several IOP-associated genes. The expression of ESR1 and these IOP-associated genes in TM/SC tissue and the presence of 17β-estradiol in AH supports a role for estrogen signaling in IOP regulation.
Keywords: primary open-angle glaucoma, intraocular pressure, aqueous humor outflow, estrogen signaling
1. Introduction
Glaucoma is the leading cause of irreversible blindness in the world, impacting the lives of approximately 75 million individuals [1,2,3]. Primary open-angle glaucoma (POAG) is the most predominant form of this group of optic neuropathies, accounting for approximately 75% of cases [1,2,3]. Like other forms of glaucoma, POAG is characterized by retinal ganglion cell death and optic nerve atrophy resulting in progressive visual field loss, but differs from other forms of glaucoma in that it lacks an identifiable cause [3,4,5,6,7].
Although its etiology is not completely understood, several risk factors have been identified, including age, African ancestry, positive family history, and elevated intraocular pressure (IOP) [1,3,5,7,8,9,10]. IOP is sustained by the dynamic production and outflow of aqueous humor (AH), the fluid which carries nutrients to and removes wastes from the avascular cornea, lens, and trabecular meshwork (TM) in the anterior segment of the eye [3,7,11]. After being produced by the ciliary body (CB), AH flows forward between the lens and iris to the anterior segment where it provides nutrients to the cornea [3,7]. The fluid then flows out of the eye, carrying with it metabolic waste from the lens, iris, and cornea [11]. AH outflow predominantly occurs through the conventional pathway in the iridocorneal angle [12,13]. In this pathway, AH flows through the TM, Schlemm’s canal (SC), and out into the vasculature through the episcleral veins and collector channels [3,7,12]. The tissues in this region, predominantly the TM, regulate outflow resistance [7,13,14,15]. If the outflow resistance of the AH is elevated, the equilibrium of production and outflow is disrupted, and IOP increases [7,13,14,15]. Although elevated IOP is not experienced in all POAG cases, it is the only modifiable risk factor for POAG that slows disease progression, and as such has been the subject of intense investigation [7,10].
In order to identify genetic factors that contribute to IOP regulation and POAG risk, many genome-wide association studies (GWAS) have been conducted in recent years [16,17,18,19,20,21,22,23,24,25,26]. Two GWAS conducted in 2018 by Khawaja, et al., and MacGregor, et al., identified single nucleotide polymorphisms (SNPs) in or around more than 150 genes [24,25]. Many of these were novel associations with IOP. Due to limited time and resources, not all of these genes can be thoroughly examined using in vitro and in vivo studies. Therefore, this study sought to prioritize these genes by using previously published data, publicly available databases, and our own unpublished data as screening criteria.
2. Results
2.1. Selection of Genes for Prioritization
By combining the data provided in the supplemental files from Khawaja, et al., and MacGregor, et al., we compiled a list of 191 lead SNPs associated with IOP (Supplemental Tables S1 and S2). These SNPs were located in or near 157 genes. In some cases, multiple SNPs were identified within a single gene (e.g., TMCO1, FNDC3B, AFAP1, GMDS, OXR1, ANGPT1, LMX1B, and GAS7). Alternatively, some SNPs were located between genes; in such cases, genes on either side of the SNP were included. Furthermore, many genes were identified by both studies. For this reason, the final list of IOP-associated genes included only 157 non-redundant genes (Supplemental Table S3).
2.2. Gene Prioritization
The list of genes were prioritized using multiple criteria (Figure 1). First, differential gene expression was examined in two previously published microarray datasets, one comparing expression in healthy and POAG-affected human TM tissue [27] and the other comparing expression in human SC cells isolated from healthy and POAG-affected donor eyes [28]. The genes identified as being significantly differentially expressed in these datasets were then analyzed for their level of expression in an unpublished RNA-sequencing (RNA-Seq) study we conducted previously in primary cultures of human TM and SC cells. Expression of these genes of interest was also examined in TM, CB, and cornea tissue [29,30]. The genes were further characterized using the Genotype-Tissue Expression (GTEx) Portal [31,32,33,34] and the UCSC Genome Browser (https://genome.ucsc.edu/, accessed on 3 December 2018) [35]. Separately, all 157 IOP-associated genes were screened using expression data from an RNA-Seq study, in which we subjected cultures of primary human TM cells to cyclic mechanical stretch, and a single-cell RNA-sequencing (scRNA-Seq) analysis of human outflow tissues [36,37]. Lastly, we conducted a differential expression correlation analysis of all 157 IOP-associated genes and the genes differentially expressed in POAG-affected human TM tissues [27]. Differential correlation analysis was followed by network analysis.
Figure 1.
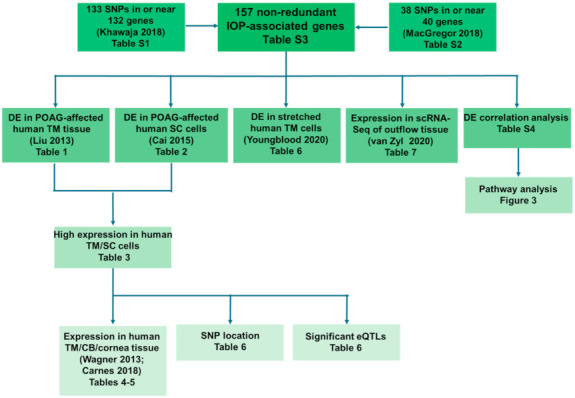
Experimental design for prioritization of intraocular pressure (IOP) associated genes. From two previously published genome-wide association studies (GWAS) [24,25], we identified 157 non-redundant IOP-associated genes, which we filtered and characterized for future functional analysis using the following criteria: (1) differential expression (DE) in primary open-angle glaucoma (POAG) affected trabecular meshwork (TM) tissue, (2) DE in POAG-affected Schlemm’s canal (SC) cells, (3) high expression in non-glaucomatous human TM and/or SC cells, (4) significant/high expression in human TM, ciliary body (CB), and cornea tissue, (5) single nucleotide polymorphism (SNP) location in regulatory regions, (6) significant expression quantitative trait loci (eQTL) for gene/SNP pairs, (7) DE in cyclically stretched human TM cells, (8) specific expression in cell clusters defined by single-cell RNA-sequencing (scRNA-Seq) of human conventional outflow tissue, and (9) pathway analysis of differential correlation pairs.
2.2.1. Differential Expression in POAG-Affected Human TM Tissue or SC Cells
While some of the currently available drug therapies for glaucoma manage IOP by reducing secretion, the primary cause of elevated IOP is reduced outflow facility [7,13,14,15]. The TM is responsible for regulating AH outflow [7,13,14,15]; therefore, understanding the transcriptional differences between healthy and glaucomatous TM is crucial. Genes differentially expressed in the TM of POAG patients may play a role in disease etiology by affecting AH outflow, and therefore IOP. For this reason, the differential expression of the 157 IOP-associated genes was looked up in a previously published microarray comparing POAG-affected (n = 14) and non-glaucomatous (n = 13) postmortem human TM tissues [27]. From this microarray, 10 differentially expressed (│FC│ ≥ 1.5) genes were identified: ANKH, ANTXR1, COL8A2, EFEMP1, GMDS, HLA-DQA1, LTBP2, MAFB, RPLP2, and SEMA3E (Table 1). For these genes, there was evidence for upregulation in POAG-affected TM tissue.
Table 1.
Intraocular Pressure-Associated Genes Differentially Expressed in Primary Open-Angle Glaucoma-Affected Human Trabecular Meshwork Tissue.
| Gene | Description | Fold Change | p |
|---|---|---|---|
| ANKH | ANKH inorganic pyrophosphate transport regulator | 2.69 | 3.16 × 10⁻⁷ |
| ANTXR1 | ANTXR cell adhesion molecule 1 | 1.79 | 6.46 × 10⁻³ |
| COL8A2 | Collagen type VIII α2 chain | 2.66 | 1.32 × 10⁻⁴ |
| EFEMP1 | EGF containing fibulin extracellular matrix protein 1 | 1.82 | 4.43 × 10⁻³ |
| GMDS | GDP-mannose 4,6-dehydratase | 1.93 | 3.14 × 10⁻³ |
| HLA-DQA1 | Major histocompatibility complex, class II, DQ α1 | 2.13 | 3.10 × 10⁻³ |
| LTBP2 | Latent TGF-β binding protein 2 | 2.25 | 1.65 × 10⁻³ |
| MAFB | MAF BZIP transcription factor B | 1.54 | 1.22 × 10⁻² |
| RPLP2 | Ribosomal protein lateral stalk subunit P2 | 1.58 | 1.32 × 10⁻¹ |
| SEMA3E | Semaphorin 3E | 1.94 | 1.26 × 10⁻⁵ |
As AH exits the TM, it enters the SC lumen, a vessel that has both vascular and lymphatic characteristics [12,38]. The endothelial cells comprising the inner wall of the SC share responsibility with the TM for outflow resistance and IOP regulation [12,13,14,15,38,39]. As a result, genes differentially expressed in the SC cells of POAG patients are likely involved in POAG pathogenesis. Therefore, the differential expression of the 157 IOP-associated genes was cross-referenced in previously published microarray data comparing gene expression in glaucomatous (n = 4) and non-glaucomatous (n = 4) SC cells [28]. There were eight genes that were upregulated (i.e., AFAP1, COL4A1, CPXM1, ETS1, PRKAG2, PTPN1, SH2B3, and TES), and nine that were downregulated (i.e., ANGPTL2, ANTXR1, HHEX, LTBP2, MAFB, ME3, NR1H3, PCSK5, and PRSS23) in POAG-affected SC cells (Table 2). Three of these genes (i.e., ANTXR1, LTBP2, and MAFB) had also been shown to be differentially expressed in POAG-affected human TM tissue (Figure 2, Table 1). Interestingly, the direction of differential expression for the 3 shared genes was opposite for TM tissue and SC cells.
Table 2.
Intraocular Pressure-Associated Genes Differentially Expressed in Primary Open-Angle Glaucoma-Affected Human Schlemm’s Canal Cells.
| Gene | Description | Fold Change | p |
|---|---|---|---|
| AFAP1 | Actin filament associated protein 1 | 1.56 | 1.35 × 10⁻¹ |
| ANGPTL2 | Angiopoietin like 2 | −3.33 | 6.73 × 10⁻² |
| ANTXR1 | ANTXR cell adhesion molecule 1 | −1.67 | 4.77 × 10⁻² |
| COL4A1 | Collagen type IV α1 chain | 2.84 | 1.43 × 10⁻¹ |
| CPXM1 | Carboxypeptidase X, M14 family member 1 | 1.57 | 2.18 × 10⁻² |
| ETS1 | ETS proto-oncogene 1, transcription factor | 1.61 | 1.28 × 10⁻¹ |
| HHEX | Hematopoietically expressed homeobox | −1.62 | 1.81 × 10⁻² |
| LTBP2 | Latent TGF-β binding protein 2 | −1.63 | 1.56 × 10⁻¹ |
| MAFB | MAF BZIP transcription factor B | −1.79 | 2.82 × 10⁻¹ |
| ME3 | Malic enzyme 3 | −1.59 | 3.23 × 10⁻³ |
| NR1H3 | Nuclear receptor subfamily 1 group H member 3 | −1.59 | 5.54 × 10⁻² |
| PCSK5 | Proprotein convertase subtilisin/kexin type 5 | −2.04 | 3.93 × 10⁻² |
| PRKAG2 | Protein kinase AMP-activated non-catalytic subunit γ2 | 1.63 | 1.70 × 10⁻² |
| PRSS23 | Serine protease 23 | −1.65 | 1.60 × 10⁻¹ |
| PTPN1 | Protein tyrosine phosphatase non-receptor type 1 | 1.63 | 1.63 × 10⁻² |
| SH2B3 | SH2B adaptor protein 3 | 1.58 | 7.07 × 10⁻³ |
| TES | Testin LIM domain protein | 1.54 | 4.75 × 10⁻² |
Figure 2.
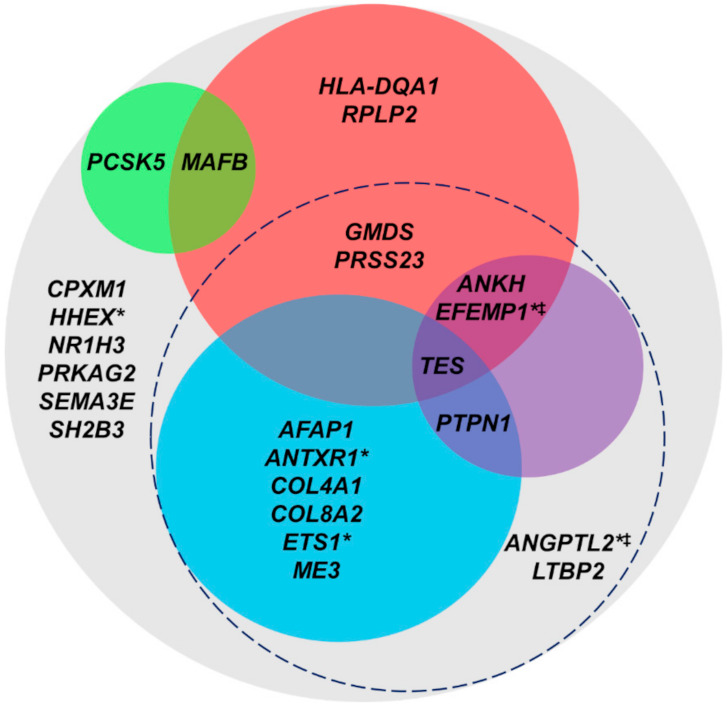
Prioritization of intraocular pressure (IOP)-associated genes differentially expressed in primary open-angle glaucoma (POAG)-affected trabecular meshwork (TM) tissue and/or Schlemm’s canal (SC) cells. Twenty-four IOP-associated genes were differentially expressed (│FC│ ≥ 1.5) in POAG-affected TM tissue and/or POAG-affected SC cells (grey circle). Fifteen of the 24 genes were highly expressed (FPKM ≥ 10) in non-glaucomatous TM or SC cells (dashed circle), all of which were located in regions of histone modification. Eight of the IOP-associated variants in/near these 15 genes were located in enhancer or promoter regions (blue circle), and 4 of the 15 were significantly/highly expressed in TM tissue (purple circle). Eight of the 24 genes were specifically expressed in ≥1 cell cluster defined by single-cell RNA-sequencing of human outflow tissue (red circle), and 2 of the 24 genes were differentially expressed by cyclically stretched human TM cells (green circle). Five of the 24 genes were part of differential correlation pairs (asterisk) and 2 were regulated by ESR1 (two-barred cross).
2.2.2. High Expression in RNA-Seq of Primary Human TM and SC Cells
In order to examine the expression of the 24 differentially expressed IOP-associated genes in normal tissue, we conducted stranded total RNA-Seq of primary TM and SC cells from post-mortem donors with no history of ocular illness. While the 10 TM genes in Table 1 were filtered using RNA-Seq expression data from normal TM cells, the 17 SC genes in Table 2 were analyzed using normal SC cell RNA-Seq expression data. Genes having an average number of counts (FPKM) ≥ 10 were considered to be highly expressed. These genes included 6 differentially expressed genes in POAG-affected TM tissue and 11 differentially expressed genes in POAG-affected SC cells. Two of these genes (i.e., ANTXR1 and LTBP2) had been differentially expressed in both POAG-affected TM tissue and SC cells, resulting in 15 non-redundant IOP-associated genes having high expression in normal TM and/or SC cells (Figure 2, Table 3).
Table 3.
Expression of Differentially Expressed Intraocular Pressure-Associated Genes in Non-Glaucomatous Human Trabecular Meshwork/Schlemm’s Canal Cells
| Gene | Cell/Tissue Type | RNA-Seq Expression (FPKM) |
|---|---|---|
| AFAP1 | SC | 46.64 |
| ANGPTL2 | SC | 30.90 |
| ANKH | TM | 64.41 |
| ANTXR1 * | TM, SC | 32.78, 47.13 |
| COL4A1 | SC | 17.92 |
| COL8A2 | TM | 34.44 |
| CPXM1 | SC | 0.49 |
| EFEMP1 | TM | 89.70 |
| ETS1 | SC | 15.70 |
| GMDS | TM | 29.40 |
| HHEX | SC | 2.60 |
| HLA-DQA1 | TM | 0.00 |
| LTBP2 * | TM, SC | 104.70, 171.74 |
| MAFB * | TM, SC | 1.37, 1.79 |
| ME3 | SC | 11.09 |
| NR1H3 | SC | 4.45 |
| PCSK5 | SC | 1.97 |
| PRKAG2 | SC | 6.49 |
| PRSS23 | SC | 184.92 |
| PTPN1 | SC | 12.46 |
| RPLP2P1 | TM | 0.00 |
| SEMA3E | TM | 1.51 |
| SH2B3 | SC | 13.63 |
| TES | SC | 64.48 |
* Differentially expressed in both trabecular meshwork tissue and Schlemm’s canal cells.
2.2.3. High Expression in Human Ocular Tissue
To confirm gene expression in normal tissue, we examined the expression of these 24 genes of interest in TM, CB, and corneal tissue in the Human Ocular Tissue Database and a previously published transcriptomic profile of these same tissues [29]. As mentioned previously, the CB and TM are the tissues responsible for producing and draining AH, respectively. In addition, several studies have shown a relationship between glaucoma risk and central corneal thickness (CCT), particularly a thin CCT [40,41]. Because of the association with disease risk, we also examined corneal tissue.
Four of these 24 genes (i.e., ANKH, EFEMP1, PTPN1, and TES) were found to be significantly expressed (DABG ≤ 0.05) in TM tissue from the Human Ocular Tissue Database [29] and highly expressed (FPKM ≥ 10) in TM tissue profiled by Carnes, et al. [30] (Figure 2, Table 4 and Table 5). Furthermore, both studies found ANKH, EFEMP1, and TES to be expressed in either CB or cornea tissue (Table 4 and Table 5). Interestingly, all genes that were highly expressed in TM cells were highly expressed in at least one of the normal TM tissue profiles. On the other hand, SEMA3E, HLA-DQA1, and MAFB, which had low or no expression in normal TM cells (Table 3), were highly expressed in at least one of the normal TM tissue profiles (Table 4 and Table 5), suggesting that two-dimensional TM cell culture does not completely capture the biological processes that occur in tissue.
Table 4.
Expression of Differentially Expressed Intraocular Pressure-Associated Genes in the Human Ocular Tissue Database.
| Gene | Trabecular Meshwork | Ciliary Body | Cornea | ||||||
|---|---|---|---|---|---|---|---|---|---|
| PLIER | DABG Average | DABG Range | PLIER | DABG Average | DABG Range | PLIER | DABG Average | DABG Range | |
| AFAP1 | 33.64 | 0.08 | 0–0.58 | 31.53 | 0.07 | 0–0.49 | 30.54 | 0.14 | 0–0.77 |
| ANGPTL2 | 45.11 | 0.16 | 0–0.71 | 30.32 | 0.19 | 0–0.8 | 74.34 | 0.07 | 0–0.42 |
| ANKH | 112.61 | 0.05 | 0–0.76 | 70.15 | 0.05 | 0–0.51 | 88.56 | 0.07 | 0–0.51 |
| ANTXR1 * | 145.19 | 0.06 | 0–0.89 | 90.84 | 0.10 | 0–0.77 | 58.56 | 0.09 | 0–0.84 |
| COL4A1 | 46.71 | 0.08 | 0–0.92 | 42.61 | 0.16 | 0–0.97 | 24.59 | 0.24 | 0–0.98 |
| COL8A2 | 99.82 | 0.12 | 0–0.56 | 86.39 | 0.14 | 0–0.52 | 81.40 | 0.11 | 0–0.57 |
| CPXM1 | 26.48 | 0.11 | 0–0.58 | 24.60 | 0.17 | 0–0.85 | 26.29 | 0.10 | 0–0.32 |
| EFEMP1 | 214.28 | 0.01 | 0–0.11 | 667.78 | 0.03 | 0–0.35 | 165.29 | 0.04 | 0–0.52 |
| ETS1 | 86.82 | 0.07 | 0–0.76 | 41.16 | 0.08 | 0–0.51 | 27.07 | 0.05 | 0–0.35 |
| GMDS | 76.23 | 0.06 | 0–0.20 | 88.91 | 0.19 | 0–0.78 | 93.19 | 0.06 | 0–0.16 |
| HHEX | 92.41 | 0.14 | 0–0.64 | 63.12 | 0.20 | 0–0.54 | 95.97 | 0.23 | 0–0.95 |
| HLA-DQA1 | NA | NA | NA | NA | NA | NA | NA | NA | NA |
| LTBP2 * | 79.44 | 0.06 | 0–0.66 | 69.94 | 0.08 | 0–0.77 | 62.10 | 0.08 | 0–0.53 |
| MAFB * | 54.38 | 0.19 | 0–0.93 | 62.34 | 0.17 | 0–0.82 | 77.52 | 0.09 | 0–0.50 |
| ME3 | 29.17 | 0.13 | 0–0.86 | 36.24 | 0.17 | 0–0.52 | 34.63 | 0.11 | 0–0.52 |
| NR1H3 | 32.84 | 0.18 | 0–0.72 | 32.88 | 0.23 | 0–1.00 | 33.11 | 0.16 | 0–0.57 |
| PCSK5 | 37.87 | 0.07 | 0–0.33 | 31.31 | 0.17 | 0–0.81 | 234.57 | 0.01 | 0–0.18 |
| PRKAG2 | 65.93 | 0.08 | 0–0.68 | 57.75 | 0.14 | 0–0.78 | 51.41 | 0.13 | 0–0.72 |
| PRSS23 | 76.78 | 0.06 | 0–0.34 | 155.24 | 0.02 | 0–0.15 | 121.46 | 0.04 | 0–0.28 |
| PTPN1 | 84.10 | 0.02 | 0–0.22 | 61.15 | 0.06 | 0–0.62 | 78.01 | 0.07 | 0–0.37 |
| RPLP2P1 | NA | NA | NA | NA | NA | NA | NA | NA | NA |
| SEMA3E | 130.67 | 0.01 | 0–0.20 | 28.40 | 0.10 | 0–0.82 | 35.46 | 0.07 | 0–0.83 |
| SH2B3 | 40.00 | 0.15 | 0–0.99 | 29.77 | 0.15 | 0–0.68 | 37.72 | 0.12 | 0–0.5 |
| TES | 290.39 | 0.01 | 0–0.11 | 67.06 | 0.07 | 0–0.27 | 193.21 | 0.01 | 0–0.08 |
* Differentially expressed in both trabecular meshwork tissue and Schlemm’s canal cells.
Table 5.
Expression (FPKM) of Filtered Intraocular Pressure-Associated Genes in a Previously Published Transcriptional Profile of Adult Human Trabecular Meshwork, Ciliary Body, and Cornea Tissue.
| Gene | Trabecular Meshwork | Ciliary Body | Cornea |
|---|---|---|---|
| AFAP1 | 3.10 | 4.71 | 2.46 |
| ANGPTL2 | 18.84 | 15.75 | 8.69 |
| ANKH | 50.88 | 32.83 | 21.43 |
| ANTXR1 * | 67.92 | 5.40 | 10.42 |
| COL4A1 | 9.15 | 8.06 | 0.73 |
| COL8A2 | 118.54 | 33.40 | 28.26 |
| CPXM1 | 6.63 | 9.52 | 0.22 |
| EFEMP1 | 142.27 | 153.01 | 77.16 |
| ETS1 | 16.18 | 1.85 | 3.56 |
| GMDS | 81.59 | 55.42 | 89.55 |
| HHEX | 2.25 | 0.53 | 0.48 |
| HLA-DQA1 | 31.13 | 4.11 | 9.36 |
| LTBP2 * | 54.69 | 142.61 | 3.93 |
| MAFB * | 13.35 | 1.45 | 8.08 |
| ME3 | 7.26 | 15.74 | 5.42 |
| NR1H3 | 8.60 | 19.88 | 7.02 |
| PCSK5 | 5.04 | 2.71 | 21.57 |
| PRKAG2 | 16.79 | 2.30 | 16.08 |
| PRSS23 | 23.22 | 8.20 | 16.50 |
| PTPN1 | 16.16 | 34.22 | 17.24 |
| RPLP2P1 | 0.00 | 0.00 | 0.00 |
| SEMA3E | 8.27 | 0.16 | 1.93 |
| SH2B3 | 4.54 | 2.79 | 1.28 |
| TES | 56.81 | 0.81 | 30.17 |
* Differentially expressed in both trabecular meshwork tissue and Schlemm’s canal cells.
2.2.4. Variant Impacts on Expression Due to Location in Regulatory Regions
Having identified 15 genes that were differentially expressed between pathogenic and healthy outflow cells/tissue and specifically expressed at high levels in non-glaucomatous tissue, we sought to identify how the IOP-associated SNPs in/near these genes might be affecting their expression. Gene expression may be regulated by a variety of mechanisms. One such way is the binding of transcription factors at promoter, enhancer, or repressor regions upstream or downstream of the transcription start site. A single nucleotide change in one of these regions could be sufficient to impact transcription factor recognition of and/or binding affinity to the site. In addition to genetic regulatory regions, epigenetic modification of histones can cause transcriptional changes by increasing or decreasing chromatin condensation, thereby influencing the exposure of gene promoters to transcriptional machinery. Just as a single nucleotide change in a regulatory region could impact transcription initiation, a SNP located in a region of histone modification could affect the ability of the histone to be modified, thereby influencing chromatin condensation and transcription. Therefore, we identified the location of each of the IOP-associated SNPs in/near the genes of interest using the UCSC Genome Browser [35] (http://genome.ucsc.edu/, accessed on 3 December 2018). All of the 15 SNPs were located in regions of histone modification, and 8 were located in promoter/enhancer regions (Figure 2, Table 6).
Table 6.
Genomic Location of Intraocular Pressure (IOP)-Associated Single Nucleotide Polymorphisms (SNPs) and Expression Quantitative Trait Loci (eQTL) for IOP-Associated Gene/SNP Pairs.
| SNP | Gene | Histone Modification |
Enhancer or Promoter Region |
Significant eQTL |
|---|---|---|---|---|
| rs28649910 | AFAP1 | Yes | Yes | Skin; Whole blood |
| rs11795066 | ANGPTL2 | Yes | No | Cerebellum; Esophageal mucosa; Skin; Testis; Tibial nerve; Thyroid; Whole blood |
| rs368503 | ANKH | Yes | No | Esophageal mucosa |
| rs6546486 | ANTXR1 * | Yes | Yes | None |
| rs112972174 | COL4A1 | Yes | Yes | None |
| rs12123086 | COL8A2 | Yes | Yes | Whole blood |
| rs4672075 | EFEMP1 | Yes | No | Skin; Thyroid |
| rs7924522 | ETS1 | Yes | Yes | None |
| rs722585 | GMDS | Yes | No | None |
| rs74384554 | LTBP2 * | Yes | No | Tibial nerve |
| rs2433414 | ME3 | Yes | Yes | Esophageal muscularis; Lung; Skeletal muscle; Skin; Subcutaneous adipose; Tibial nerve; Transformed fibroblasts |
| rs11606902 | PRSS23 | Yes | No | Adrenal gland; Esophagus; Skeletal muscle |
| rs6095946 | PTPN1 | Yes | Yes | None |
| rs10774624 | SH2B3 | Yes | No | Esophageal mucosa; Skin |
| rs55892100 | TES | Yes | Yes | Adrenal gland; Lung; Pancreas; Subcutaneous adipose; Testis; Tibial artery; Tibial nerve; Thyroid; Whole blood |
* Differentially expressed in both trabecular meshwork tissue and Schlemm’s canal cells.
In order to better elucidate how these SNPs might affect gene expression, we sought to identify tissues in which these gene/SNP pairs might form expression quantitative trait loci (eQTL) using the publicly available GTEx Portal (https://gtexportal.org, accessed on 3 December 2018) [31,32,33,34]. Although eye tissue had not been included in the GTEx Project, identification of significant eQTL for these gene/SNP pairs could provide evidentiary support for SNP effects on gene expression. In addition, identifying other tissues in which these SNPs significantly impact gene expression (i.e., significant eQTL) might elucidate how the gene/SNP pair functionally impact outflow tissue.
Significant eQTL were identified for 10 of the 15 gene/SNP pairs in one or more tissues with skin, tibial nerve, and whole blood being the tissues with the most eQTL (Table 6). The SNP rs55892100 had significantly affected TES gene expression in more tissues than any other gene/SNP pair, suggesting that this SNP might be in a region universally important for gene expression.
2.2.5. Differential Expression in Cyclically Stretched Primary Human TM Cells
Due to their pressure-responsive regulation of AH outflow, TM cells are under constant mechanical stretch [7,13,14,15,42,43]. Furthermore, the heart beat and filling of the choroid creates an ocular pulse of AH outflow through the TM, creating a cyclical process of mechanical stretch [15,43,44,45,46]. In order to identify IOP-associated genes responsible for regulating TM cell response to this stress, we analyzed differential expression of all 157 IOP-associated genes in our previously published RNA-Seq dataset of primary human TM cells subjected to cyclic mechanical stretch [36].
Four IOP-associated genes were significantly differentially expressed (│FC│ > 2, p < 0.05) between stretched and unstretched TM cells (Table 7). These included MCPH1, MAFB, HGF, and PCSK5. Both MAFB and PCSK5 had been differentially expressed in POAG-affected SC cells (Figure 2, Table 2). In both cases, the genes were downregulated. In addition, 4 other IOP-associated genes (i.e., MYOF, FOXC1, SPTBN1, and TCF7L2) shared sequence homology to long non-coding RNAs (lncRNAs) differentially expressed (│FC│ > 2, p < 0.05) in cyclically stretched human TM cells (Table 8), suggesting that these IOP-associated genes may be regulated by lncRNAs within the TM in response to stretch.
Table 7.
Intraocular Pressure-Associated Genes Differentially Expressed in Cyclically Stretched Human Trabecular Meshwork Cells.
| Gene | Description | Fold Change | p |
|---|---|---|---|
| MCPH1 | Microcephalin 1 | 2.18 | 2.4 × 10⁻² |
| MAFB | MAF BZIP transcription factor B | −2.12 | 1.9 × 10⁻² |
| HGF | Hepatocyte growth factor | −2.52 | 3.1 × 10⁻² |
| PCSK5 | Proprotein convertase subtilisin/kexin type 5 | −2.75 | 3.2 × 10⁻² |
Table 8.
Intraocular Pressure-Associated Genes with Sequence Homology to Differentially Expressed Long Non-Coding RNAs (lncRNAs) in Cyclically Stretched Human Trabecular Meshwork Cells.
| lncRNA | Sequence Homology | Fold Change | p |
|---|---|---|---|
| NONHSAT157336.1:208–1549 | Myoferlin | 1.61 × 10⁵ | 3.6 × 10⁻² |
| NONHSAT106523.2:1153–1748 | Forkhead box C1 | 2.26 × 10³ | 4.5 × 10⁻² |
| NONHSAT184643.1:226–631 | Spectrin β, non-erythrocytic 1 | 4.77 | 1.6 × 10⁻² |
| NONHSAT156133.1:88–552 | Transcription factor 7 like 2 | −2.42 | 2.5 × 10⁻² |
2.2.6. Differential Expression in Outflow Pathway scRNA-Seq
The transcriptional profile of cell types within the AH outflow pathway has been recently characterized by scRNA-Seq [37,47]. As a last confirmation of the expression of IOP-associated genes within the outflow pathway, we analyzed which of the 157 IOP-associated genes were specifically expressed in cell clusters defined by the publicly available scRNA-Seq dataset provided by van Zyl, et al. [37]. Due to the nature of sequencing RNA transcripts from single cells, coverage is often low, even given sufficiently large read depths. As a result, scRNA-Seq mostly detects genes highly expressed in the tissue of interest, to the exclusion of some lower expressed genes. Therefore, even the transcripts that are detected at a relatively low abundance in a scRNA-Seq dataset would have to be highly expressed in the native tissue in order to be detected. For this reason, we did not apply an expression cutoff for inclusion, but rather included any IOP-associated genes that were specifically expressed within one or more scRNA-Seq cell clusters.
Twenty-nine IOP-associated genes were specifically expressed in one of the 19 cell clusters (Figure 3, Supplemental Table S4). Because these 19 clusters included some clusters which described cell types that are not specific to the outflow pathway, such as melanocytes, neurons, and pericytes, we further restricted our analysis to cell clusters specifically involved in AH production and outflow. These 6 cell clusters were localized to the TM (i.e., Beam Cell A, Beam Cell B, and Cribiform Juxtacanalicular (JCT)), SC (i.e., SC Endothelium), distal outflow pathway (i.e., Collector Channel/Aqueous Vein), and CB (i.e., Ciliary Muscle). Twenty-one genes were specifically expressed in one or more of these clusters, with RPLP2 being expressed in all six cell clusters and having the highest expression. SPTBN1, FOXC1, and EMCN were the genes most commonly expressed in the TM and SC. Eight of the 21 genes (i.e., ANKH, EFEMP1, GMDS, HLA-DQA1, MAFB, PRSS23, RPLP2, and TES) had been differentially expressed in POAG-affected TM tissue or SC cells (Figure 2, Table 1 and Table 2). Interestingly, MAFB had also been differentially expressed in cyclically stretched human TM cells (Figure 2, Table 8). Furthermore, the expression of TES in this scRNA-Seq study further supports evidence for its importance identified by prior filtering criteria (Figure 2).
Figure 3.
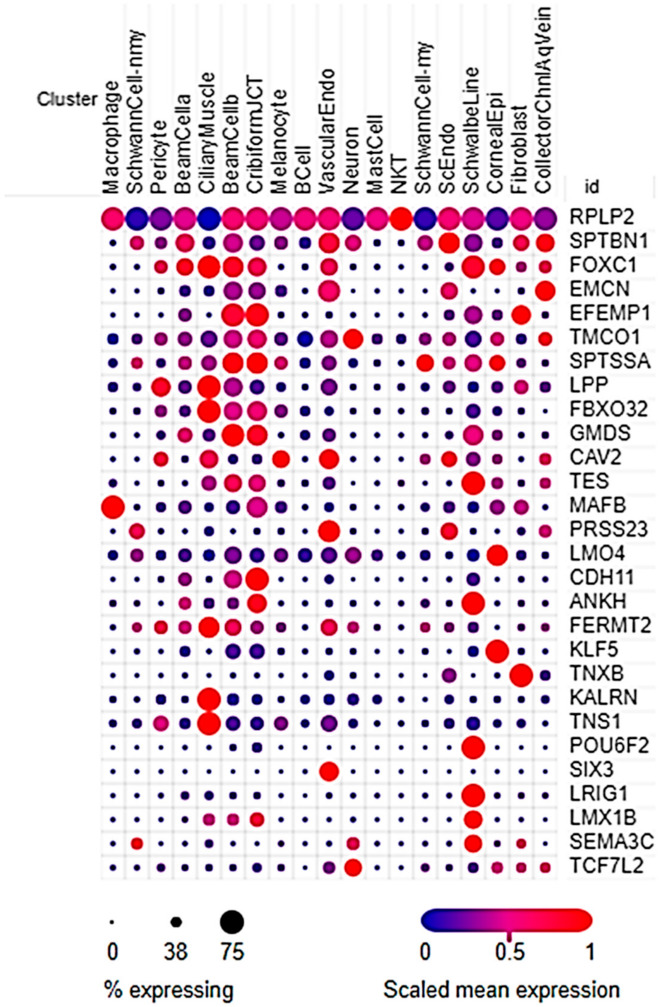
Genes expressed in single-cell RNA-sequencing (scRNA-Seq) cell clusters. Twenty-nine intraocular pressure-associated genes were specifically expressed in one or more of the 19 cell clusters defined by scRNA-Seq of human aqueous humor outflow tissue. Genes expressed in a high percentage of cells within a cluster are represented by a large dot while genes expressed in a low percentage of cells are represented by a small dot. Highly expressed genes appear more red while lowly expressed genes appear more blue. Cell clusters included Macrophage, Non-Myelinated Schwann Cell (SchwannCell-nmy), Pericyte, Trabecular Meshwork Beam Cell A, Ciliary Muscle, Trabecular Meshwork Beam Cell B, Cribiform Juxtacanalicular Trabecular Meshwork Cell (CribiformJCT), Melanocyte, B Cell, Vascular Endothelium (VascularEndo), Neuron, Mast Cell, NKT Cell, Myelinated Schwann Cell (SchwannCell-my), Schlemm’s Canal Endothelium (ScEndo), Schwalbe Line Cell, Corneal Epithelium (CornealEpi), Fibroblast, and Collector Channel/Aqueous Vein Endothelium (CollectorChnlAqVein).
Of note, van Zyl, et al. found that the three TM cell clusters highly, but differentially, expressed one of our genes of interest EFEMP1, with the JCT cluster having the highest expression and the Beam Cell A cluster having the lowest expression [37]. It is important to note the differences between the TM cell clusters: the TM Beam Cell A cluster preferentially expressed FABP4 while the TM Beam Cell B cluster preferentially expressed TMEFF2 and was localized closer to the JCT [37]. Therefore, it is possible that the cell A cluster corresponded with the uveal TM while the cell B cluster corresponded to the corneoscleral TM.
2.2.7. Differential Expression Correlation Analysis
Lastly, in order to identify potential interactions between IOP-associated genes, we performed a differential correlation analysis using previously published expression data from control and POAG human TM tissue [27]. All differentially expressed genes in this dataset (i.e., 480 genes) were also included in the differential correlation analysis along with the 157 IOP-associated genes. Genes were evaluated for expression correlations within groups (i.e., control or POAG), that is gene-gene pairs that followed similar expression patterns. These expression correlations would suggest that the two genes might affect each other’s expression or be a part of a common cascade. Then it was determined whether there was a significant difference between control and POAG expression correlations for these gene-gene pairs. Differential correlations would suggest that one or both of the genes in the correlation pair, or the biological network they share in common, may be involved in POAG pathogenesis.
From this differential correlation analysis, we identified 295 significant differential correlation pairs (FDR ≤ 0.1) comprised of 201 genes (Supplemental Table S5). Of these 201 genes, 45 were IOP-associated genes. To better understand how these correlation pairs interacted, we created an interaction network for all correlation pairs using Cytoscape (Figure 4). Many of the 201 genes were involved in more than one correlation pair, with GCNT3, MUC20, KLK11, PLK5, and IL1RN being involved in the most number of correlation pairs.
Figure 4.
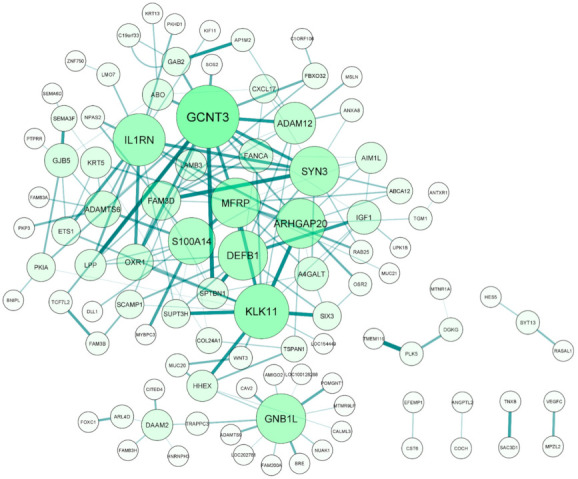
Complex interactions of differential correlation pairs involving intraocular pressure (IOP)-associated genes. Differential correlation analysis identified 295 differential correlation pairs (FDR ≤ 0.1) comprised of 201 genes. Of these, 166 pairs included 45 IOP-associated genes. Due to many IOP-associated genes being a part of multiple differential correlation pairs, these gene pairs formed several complex correlation networks. The size and color of the nodes indicate which genes are involved in the most differential correlation pairs with the larger green nodes having the most interactions. Similarly, the size and color of the lines connecting the gene nodes indicate the significance of the differential correlation with thicker, darker lines representing greater significance.
In order to examine known functional relationships between these genes and better understand what biological processes they may impact, we conducted a network analysis of all 201 genes using Ingenuity Pathway Analysis (IPA). β-estradiol was identified as the top upstream regulator of these genes, with ESR1 (i.e., estrogen receptor 1 or α) mediating regulatory interactions with 25 genes (Figure 5). Twelve of these genes were associated with IOP (i.e., ANGPTL2, CAV2, DLL1, EFEMP1, FOXC1, IGF1, SCAMP1, SEMA3F, SOS2, SPTBN1, TCF72, and VEGFC). In addition, network analysis identified three networks centered on β-estradiol and estrogen receptors ESR2 (i.e., estrogen receptor 2 or β) and GPER1 (i.e., G protein-coupled estrogen receptor 1) (Supplemental Figure S1). This suggests that these IOP-associated genes may have a significant role in the regulation of IOP and AH outflow and may be modulated by estrogen signaling.
Figure 5.
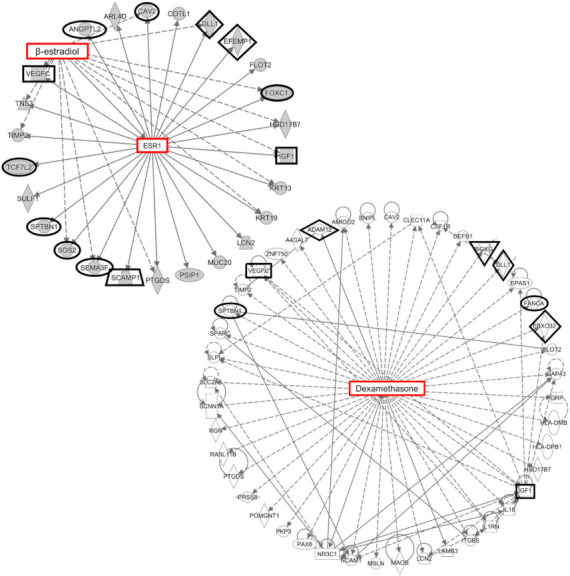
Functional networks composed of genes identified by differential correlational analysis. The 201 genes identified by differential correlation analysis comprised several functional networks. The top upstream regulator of the 201 genes identified by differential correlation analysis was β-estradiol with ESR1 mediating regulatory interactions between β-estradiol and 25 genes. Another top-upstream regulator was dexamethasone, which regulated several of the same genes as β-estradiol. Intraocular pressure-associated genes are indicated by a thick black outline.
Dexamethasone, a corticosteroid known to increase AH outflow resistance and IOP, was also identified as one of the top upstream regulators of the 201 genes identified by differential correlation analysis (Figure 5) [48,49,50,51]. This ocular hypertension-inducing molecule regulated 44 of the 201 genes, with 9 of these genes being associated with IOP (i.e., ADAM12, CAV2, DGKG, DLL1, FANCA, FBXO32, IGF1, SPTBN1, and VEGFC). Several of these genes, including CAV2, DLL1, IGF1, SPTBN1, and VEGFC, were also regulated by ESR1, suggesting shared, but possibly opposing, mechanisms of IOP regulation.
2.3. Estrogen Signaling in the Human Outflow Pathway
The expression of estrogen receptors, including ESR1, has been established in multiple ocular tissues including cornea, iris, lens, CB, retina, and conjunctiva [52]. Furthermore, ESR1 has been shown to be expressed in human TM cells [53]. Moreover, the various isoforms of estrogen have been shown to be present in bovine, canine, rabbit, and human AH [54,55,56,57] as well as in human TM cells [53].
Here we sought to confirm receptor expression in human outflow tissue and the presence of 17β-estradiol, the active isoform of estrogen, in human AH. We confirmed the presence of 17β-estradiol in both glaucomatous (34.46 ± 7.08 pg/mL, n = 4) and non-glaucomatous (37.90 ± 14.80 pg/mL, n = 4) human AH, as well as bovine (59.70 ± 8.58 pg/mL, n = 5) and porcine (149.44 ± 168.21 pg/mL, n = 4) AH (Table 9; Supplemental Table S6). Unfortunately, there were insufficient numbers of male and female human AH samples per group to statistically analyze sex differences between human AH estradiol concentrations, and the biological sex for bovine and porcine AH samples was unavailable. However, there were no trending differences between human male and female AH samples.
Table 9.
17β-Estradiol Concentration in Bovine, Porcine, and Human Aqueous Humor.
| Donor | 17β-Estradiol Concentration | |
|---|---|---|
| Non-glaucomatous (n = 4) | 0.14 ± 0.05 nM | 37.90 ± 14.80 pg/mL |
| Glaucomatous (n = 4) | 0.13 ± 0.03 nM | 34.46 ± 7.08 pg/mL |
| Bovine (n = 5) | 0.22 ± 0.03 nM | 59.70 ± 8.58 pg/mL |
| Porcine (n = 4) | 0.55 ± 0.62 nM | 149.44 ± 168.21 pg/mL |
The expression of estrogen receptors ESR1, ESR2, and GPER1 was ascertained in human TM cells (Supplemental Table S7) by quantitative real-time PCR (qRT-PCR). ESR1 was expressed at detectable levels in females (n = 3, Ct = 29.37), but not in males (n = 3, Ct = 35.16). Interestingly, ESR2 was expressed at barely detectable levels in males (Ct = 33.90), but was undetectable in females (Ct = 34.69). However, GPER1 was expressed at detectable, equivalent levels in both males and females (Ct = 31.73, 31.04). As confirmation, ESR1 protein was expressed throughout the TM/SC region of outflow tissue derived from human organ donors of both sexes and a range of ages (n = 4; Figure 6, Supplemental Table S8). Although quantification of ESR1 fluorescence was not conducted, there were no apparent differences between the sexes. Identification of both receptor and ligand in human outflow tissue supports a possible role of ESR1 signaling in IOP regulation.
Figure 6.
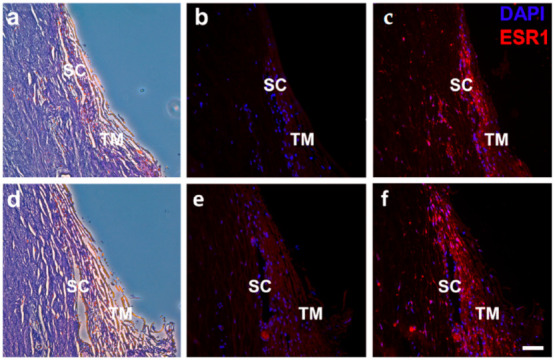
Expression of ESR1 in the trabecular meshwork (TM)/Sclemm’s canal (SC) region of human outflow tissue. ESR1 protein was expressed in the TM/SC region of human outflow tissue (n = 4, 24–60 years of age) taken from both male (a–c) and female (d–f) post-mortem donors. Representative images of H&E (a,d), negative control (b,e), and positive staining (c,f). ESR1, estrogen receptor 1; TM, trabecular meshwork; SC, Schlemm’s canal. Scale bar: 50 μm.
3. Discussion
3.1. Overview
Herein, we prioritized a set of 157 genes associated with IOP. From this set of genes, we identified several genes of interest based on their high expression in conventional outflow pathway tissue/cells and their differential expression in glaucomatous outflow tissue/cells. Furthermore, this study identified β-estradiol as a key regulator of many IOP-associated genes. ESR1 expression in TM/SC tissue and 17β-estradiol presence in AH supported this potential regulatory role for estrogen signaling.
3.2. IOP-Associated Gene Prioritization
Of the 157 genes, several genes passed multiple levels of filtering criteria (Figure 2). Of note, TES passed the most levels of prioritization criteria (Figure 2), having been differentially expressed in POAG-affected SC cells (Table 2), being one of the most highly expressed IOP-associated genes in non-glaucomatous SC cells (Table 3), and the highest expressed IOP-associated gene in TM tissue as indicated by the Human Ocular Tissue Database (Table 4). TES was also highly expressed in TM tissue assayed by Carnes, et al., (Table 5) as well as specifically expressed in the Beam Cell B and JCT cell clusters defined by scRNA-Seq (Figure 3, Supplemental Table S4). The IOP-associated SNP in/near TES was located in a region of histone modification and an enhancer/promoter region (Table 6). Moreover, the SNP rs55892100 had significantly affected TES gene expression in more tissues than any other gene/SNP pair, suggesting that the SNP must be in a region universally important for gene expression. Furthermore, the association of the TES SNP with IOP was quite strong (p = 1.5 × 10⁻²¹; Supplemental Table S2), and although its association with POAG was not significant (p = 5.3 × 10⁻⁶) at the level of genome-wide significance, it was suggestive [25]. Furthermore, the recent GWAS conducted by Gharahkhani, et al., identified a SNP between TES and TFEC that was significantly associated (p = 1.06 × 10⁻⁹) with IOP in a European discovery cohort after Conditional and Joint (COJO) analysis [26]. However, significance for this SNP was not confirmed in the study’s cross-ancestry meta-analysis or in the replication cohort [26], suggesting that its association is limited to individuals of European ancestry.
TES (i.e., testin) is a tumor suppressor gene expressed in multiple tissues, where it is involved in the formation of focal adhesions and actin stress fibers [58,59,60]. In fact, Sala, et al., has shown that testin is a mechanosensitive component of the actin cytoskeleton and that it localizes to actin stress fibers in response to activated RhoA [61]. Focal adhesions and actin cytoskeletal elements play important roles in TM cell contractility and response to mechanical strain [49,62,63], and Rho/ROCK signaling has been shown to decrease AH outflow facility by inducing TM cell contraction [64,65]. Therefore, given the multiple lines of evidence supporting its significance in the outflow pathway, TES and its IOP-associated SNP may be of special interest for future functional studies.
In addition to TES, several other genes passed multiple levels of filtering criteria including ANTXR1, ETS1, and HHEX. ANTXR1 was differentially expressed (│FC│ ≥ 1.5) in POAG-affected TM and SC cells (Figure 2, Table 1 and Table 2) while ETS1 and HHEX were differentially expressed in POAG-affected SC cells alone (Figure 2, Table 2). Moreover, ANTXR1 and ETS1 were highly expressed (FPKM ≥ 10) in non-glaucomatous TM and/or SC cells (Figure 2, Table 3) and highly expressed (FPKM ≥ 10) in the TM, CB, or cornea tissue profiled by Carnes, et al. (Table 5) [30]. Additionally, IOP-associated variants in/near ANTXR1 and ETS1 were located in either an enhancer or promoter region or a region of histone modification (Figure 2, Table 6). Both ETS1 and HHEX act as transcription factors [66,67]. Interestingly, HHEX inhibits the repression of WNT signaling, a signaling pathway involved in normal IOP regulation and dysregulated in glaucoma [68,69,70]. Like TES, ANTXR1 (i.e., anthrax toxin receptor 1) is involved in mediating actin cytoskeleton adhesion to substrate [71].
Many other prioritized genes (e.g., AFAP1, ANTXR1, COL4A1, COL8A2, EFEMP1, ETS1, LTBP2, PCSK5, PTPN1, and SEMA3E) also play roles in cytoskeletal reorganization, extracellular matrix (ECM) assembly, and/or cell adhesion, especially through focal adhesions [71,72,73,74,75,76,77,78,79,80,81,82,83,84]. It has been well established that ECM composition, cytoskeletal organization, and cell adhesion are critical to TM regulation of IOP homeostasis [13,14,15,49,85,86,87,88]. Furthermore, glaucomatous TM is characterized by dysregulation of these processes. For example, glaucomatous TM demonstrates an abnormal ECM content and an altered actin cytoskeleton [15]. Furthermore, cytoskeletal reorganization, ECM turnover, and focal adhesion assembly are processes responsive to mechanical strain of the TM [62,89,90,91]. Interestingly, ETS1 (i.e., ETS proto-oncogene 1, transcription factor) is responsive to both fluid shear [92,93,94] and mechanical stress [95,96], types of stress that are regularly experienced by TM cells [15,89,90], and AFAP1 is necessary for c-Src-mediated mechanotransduction [77]. Perhaps these genes mediate IOP homeostasis through ECM modulation and cytoskeletal reorganization in response to mechanical strain.
However, IOP-associated genes may affect IOP regulation through several other processes. For example, another key biological process shared by several prioritized genes (e.g., ANGPTL2, ANTXR1, COL4A1, COL8A2, ETS1, and SEMA3E) was angiogenesis, blood vessel morphogenesis, and endothelial cell regulation [97,98,99,100,101,102,103,104,105,106,107]. Perhaps these genes are involved in IOP regulation through the role of the SC endothelium and the distal vasculature in aqueous humor outflow [12,13,14,15,38,39,108,109,110,111]. Therefore, genes prioritized by our analysis may affect IOP homeostasis by several mechanisms.
3.3. Estrogen Signaling in IOP Regulation
Our network analysis identified β-estradiol as being a key upstream regulator of a number of IOP-associated genes with many of these regulatory interactions being coordinated by ESR1. It should be noted that the genes regulated by estradiol were not only associated with IOP, but some also passed several filtering criteria, indicating a high likelihood that these estrogen-regulated genes play important roles in outflow regulation. The presence of estradiol in AH and the expression of estrogen receptors, including ESR1, in human TM/SC tissue further suggest a possible role for estrogen in IOP regulation.
Over the past couple decades, there has been increasing evidence that estrogen signaling plays a role in IOP homeostasis and protecting against glaucoma. For example, it has been shown that IOP levels and risk for developing glaucoma increase at menopause [112]. Conversely, post-menopausal hormone replacement therapy, including estrogen-only treatment, has been shown to decrease IOP and glaucoma risk [112,113,114,115,116,117,118,119]. Similarly, shorter lifetime estrogen exposure due to late menarche or early menopause has been shown to increase risk for glaucoma [120]. Furthermore, the effects of estrogen levels on IOP are not limited to post-menopausal individuals. IOP has also been shown to vary during the menstrual cycle with IOP being lower during the hyperestrogenic luteal phase [121]. Furthermore, IOP decreases in an estrogen-level dependent manner during pregnancy, especially during the second trimester, an elevated estrogen state [122,123,124]. Moreover, this decrease in IOP appears to result from an increased outflow facility [122]. Interestingly, antiestrogen therapies, such as tamoxifen, have been shown to exert detrimental ocular effects, including elevated IOP [125]. However, it must be noted that several studies have found the opposite trend or have found no significant difference in IOP or glaucoma risk/incidence [126].
In addition to the epidemiological evidence, Kosior-Jareck, et al., have demonstrated that POAG phenotypes may be affected by ESR1 variants [127]. Furthermore, CYP1B1, which is responsible for metabolizing 17β-estradiol, is associated with POAG as well as primary congenital glaucoma [128]. In fact, an entire panel of SNPs within genes in the estrogen metabolic pathway was shown to be associated with glaucoma, including high-tension glaucoma [129].
Beyond the clinical and genetic studies, a few functional studies have also implicated estrogen signaling in the regulation of IOP homeostasis. Chen, et al., observed an 8–19% IOP increase in female aromatase knockout mice, which lack estradiol synthesis [130]. Several studies have validated that ESR1 and other estrogen receptors are expressed throughout the eye [116,131,132]. The various forms of estrogen, including the active form 17β-estradiol (0.83 ng/mL), have been identified previously in bovine AH [54]. Furthermore, the presence of estradiol in human TM cells has been confirmed [53], as was the expression of several estrogen metabolic enzymes, including aromatase [53]. Mookherjee, et al., have shown that estradiol treatment of TM cells upregulates MYOC through estrogen regulatory elements, and that decreasing estradiol metabolism through CYP1B1 mutagenesis increases MYOC expression [53]. They postulate that this connection between CYP1B1 and MYOC may explain the digenic mode of inheritance seen in some cases of juvenile glaucoma [53]. A separate study has shown that estradiol treatment of human TM cells results in increased nitric oxide production, which could lead to vasodilation downstream [133]. Furthermore, 17β-estradiol has been suggested to exert protective effects in retinal tissue via sigma-1 receptor, agonism of which has been shown to lower IOP in both normo- and hypertensive rodent models [134,135].
However, despite the plethora of data evidencing that estrogen signaling plays an important role in IOP homeostasis, the mechanism of this effect has not been fully explored. Here we present 12 genes (i.e., ANGPTL2, CAV2, DLL1, EFEMP1, FOXC1, IGF1, SCAMP1, SEMA3F, SOS2, SPTBN1, TCF72, and VEGFC) that are both regulated by estrogen and are associated with IOP. Perhaps these genes and the common biological processes they share can illuminate our understanding of estrogen’s impact on IOP dynamics.
The majority of these estrogen-regulated, IOP-associated genes (i.e., ANGPTL2, CAV2, DLL1, FOXC1, IGF1, TCF7L2, and VEGFC) are involved in angiogenesis, endothelial cell function, or other aspects of the vasculature [100,136,137,138,139,140,141,142,143,144]. FOXC1 and VEGFC are also involved in lymphangiogenesis [139,145]. These genes may transduce estrogen-mediated effects on IOP through the distal vessels and the SC, given the combined lymphatic and vascular nature of its endothelial cells [38]. Furthermore, estrogen is known to stimulate vasodilation through nitric oxide production, a known regulator of AH outflow [133,146].
As seen with the prioritized genes discussed previously, other common biological processes shared by estrogen-regulated genes (i.e., CAV2, DLL1, EFEMP1, SEMA3F, and SPTBN1) include cytoskeletal reorganization, ECM turnover, and cell adhesion [78,84,147,148,149,150,151,152,153,154]. Interestingly, CAV2 has been shown to be essential for remodeling TM ECM [151]. Of note, several SNPs in CAV1/2 have been identified as being more strongly associated in women [155], further supporting a role of estrogen regulation of CAV2.
Furthermore, three of these genes are involved in ocular development and/or pathology. DLL1 is required for normal eye development [156] while EFEMP1 has been implicated in age-related macular degeneration and is also associated with Malattia Leventinese and Doyne honeycomb retinal dystrophy [157,158]. Of note, FOXC1 is required for proper development of the anterior segment and has been previously associated with congenital glaucoma [159].
To further elucidate how estrogen signaling may contribute to IOP homeostasis, it may be helpful to note that several of the genes (i.e., CAV2, DLL1, IGF1, SPTBN1, and VEGFC) regulated by estradiol/ESR1 were also regulated by dexamethasone, suggesting that the two molecules may affect similar processes. Dexamethasone is known to elevate IOP by increasing TM cell and ECM stiffness, thereby increasing outflow resistance [48,49,50,51]. This further supports the possibility that estrogen signaling may impact IOP homeostasis through the TM ECM.
Taken together, these findings suggest that estrogen signaling may contribute to maintaining IOP homeostasis through endothelial function in the SC/distal vasculature and through homeostatic modulation of the TM cytoskeleton/ECM in response to IOP fluctuations. Estrogen signaling may also contribute to IOP homeostasis through ocular development or modulation of glaucoma-related pathways.
3.4. Limitations and Future Work
Despite the rigor of consulting multiple data sources, a few limitations must be noted for this study. First, genes were selected based on their proximity to the SNPs identified by GWAS. However, the SNPs in question may occur in regulatory elements for genes much further downstream or upstream. Second, a few of the datasets were limited by small sample sizes. Our own RNA-Seq sample sets of non-glaucomatous TM (n = 4) and SC cells (n = 2) and stretched TM cells (n = 5) [36] were small as were the TM, ciliary body, and cornea tissue sample sets (n = 4) used for RNA-Seq by Carnes, et al. [30]. In addition, although their sample sizes were sufficiently large, the scRNA-Seq dataset referenced by this study identified only ~24,000 single-cell transcriptomes, thereby limiting the power of their results. The third limitation of this study is that TM tissue dissection was likely performed differently between studies. Therefore, different cell types may be included in the different tissue profiles. This could account for discrepancies in gene expression between TM tissue datasets. Fourth, differences between two-dimensional cell culture and tissue may account for differences between ESR1 expression in male human TM cells and male human TM/SC tissue. Fifth, due to the small number of samples, human AH estradiol concentrations were not able to be statistically analyzed on the basis of sex. Furthermore, the biological sex of bovine and porcine AH was unknown although it was assumed to be male due to commonly accepted abattoir practices. Despite these limitations, including multiple datasets with different approaches and both cells and tissue provides rigor for our prioritization study and ensures that genes of interest have several sources of support.
In the future, additional transcriptional studies with larger sample sizes and more standardized approaches may be consulted to further support our findings. In addition, functional assays may be conducted to determine whether associated SNPs impact IOP regulation through our genes of interest and whether these effects on IOP have pathological consequences. Furthermore, significant effort should be directed towards elucidating the mechanism by which estrogen signaling plays a role in IOP regulation.
3.5. Conclusions
In summary, we have prioritized a set of 157 genes containing/neighboring IOP-associated SNPs. As a result, we have identified several genes of interest for future functional study as well as identified estradiol as a key regulator of several IOP-associated genes. Therefore, we postulate a role for estrogen signaling in the normal maintenance of IOP homeostasis. Although much evidence for estrogenic effects on IOP regulation has accumulated over the years, the mechanism of action has not been well studied. Here we present a group of genes that are both associated with IOP and regulated by estrogen, thereby offering insight into the mechanisms by which estrogen may impact IOP. Given the function of the estrogen-regulated, IOP-associated genes, we hypothesize that estrogen may mediate its effects on IOP through dilation of the SC/distal vessels and/or through modulation of TM ECM and cellular morphology. The confirmed expression of ESR1 in TM/SC tissue and the presence of estradiol in AH further supports this hypothesis.
4. Materials and Methods
4.1. Gene Prioritization Using RNA-Sequencing and Previously Published Datasets
Supplemental files from the GWAS by Khawaja, et al., and MacGregor, et al., were used to identify genes of interest [24,25]. In their Supplementary Table S2, Khawaja, et al., identified 133 SNPs associated with IOP; these SNPs were located in or near 142 genes (Supplemental Table S1). Meanwhile, MacGregor, et al., identified 106 IOP-associated SNPs/genes in their Supplementary Tables S1 and S2 (Supplemental Table S2). The 133 SNPs from Khawaja, et al., were combined with the 106 SNPs identified by MacGregor, et al., to yield a total of 191 non-redundant IOP-associated SNPs in or near 157 non-redundant genes (Supplemental Table S3).
First, the list of 157 IOP-associated genes (Supplemental Table S3) was screened using microarray data from a study previously published by our group [27]. In brief, human TM tissue was obtained from 14 POAG patients during trabeculectomy and from 13 nonglaucomatous post-mortem eyes. Differential gene expression between POAG and control TM tissue was determined using a HumanWG-6 BeadChip array (Illumina, San Diego, CA, USA). For our current study, genes were considered to be differentially expressed if │FC│ ≥ 1.5, regardless of p-value (Table 1).
Second, differential expression of the 157 IOP-associated genes (Supplemental Table S3) was examined in our previously published microarray dataset of POAG-affected human SC cells [28]. In brief, SC cells were isolated from 4 glaucomatous and 4 non-glaucomatous post-mortem human donor eyes. Differential gene expression was analyzed using a HumanWG-6 BeadChip array (Illumina, San Diego, CA, USA). A │FC│ ≥ 1.5 was the sole criterion for differential expression in our current study (Table 2).
A series of additional filtering criteria were then applied to the 24 genes that were differentially expressed in human TM tissue or SC cells. First, expression of the 10 genes differentially expressed in POAG-affected TM tissue (Table 1) was determined in four non-glaucomatous primary human TM cell lines using total stranded RNA-Seq (Table 3). Likewise, expression of the 17 genes differentially expressed in POAG-affected SC cells (Table 2) was determined in 2 non-glaucomatous primary human SC cell lines using total stranded RNA-Seq (Table 3). Genes with an average expression (FPKM) ≥ 10 were considered to be highly expressed (Table 3). Second, the expression for each of the 24 genes in the Human Ocular Tissue Database (https://genome.uiowa.edu/otdb/, accessed on 12 December 2020; ©2019 The Center for Bioinformatics & Computational Biology at The University of Iowa) [29] was determined (Table 4). Search criteria was restricted to trabecular meshwork, CB, and corneal tissues; values from the core; and values from reverse strand probes only. Third, we determined the expression (FPKM) of the 24 genes in a previously published transcriptional profile of adult human TM, CB, and cornea tissue [30]. In brief, the North Carolina Eye Bank provided tissue samples from four adult post-mortem human donors. Resulting RNA libraries were sequenced by Illumina Hi-Seq (Illumina, San Diego, CA, USA). Genes with an average expression (FPKM) ≥ 10 were considered to be highly expressed (Table 5). Fifth, the University of California, Santa Cruz (UCSC) Genome Browser (http://genome.ucsc.edu/cgi-bin/hgGateway, accessed on 3 December 2018; ©2000–2018 The Regents of The University of California) [35] was employed to determine whether the 15 differentially and highly expressed IOP-associated SNPs were located in enhancer or promoter regions or in regions of histone modification, using the GRCh37/hg19 human genome assembly (Table 6). Lastly, the Genotype-Tissue Expression (GTEx) Portal (https://gtexportal.org/, accessed on 3 December 2018; ©2021 Broad Institute of MIT and Harvard; V6P release with 544 donors, GENCODE version v19, GRCh37/hg19) [31,32,33,34] was used to identify in which tissues the 15 differentially and highly expressed IOP-associated gene-SNP pairs formed eQTL (Table 6).
Next, all 157 genes associated with IOP (Supplemental Table S3) were screened against a previously published RNA-Seq dataset of normal TM cells subjected to cyclic mechanical stretch [36]. In brief, primary cultures of human TM cells were obtained from 5 donors with no history of ocular disease. Secondary cultures of these cells were subjected to 24 hours cyclic mechanical stretch (15% stretch, 1 cycle/second) with the computer-controlled FX-5000 Tension System (Flexcell International Corporation, Burlington, NC, USA). Stranded total RNA-sequencing was conducted using a NextSeq 500 System (Illumina, San Diego, CA, USA). For this study, mRNAs and lncRNAs with │FC│ > 2 and p < 0.05 were considered to be significantly differentially expressed (Table 7 and Table 8).
Lastly, the specific expression of all 157 IOP-associated genes (Supplemental Table S3) was examined in a previously published scRNA-Seq of human outflow tissue [37]. In brief, whole eyes were obtained from 7 post-mortem human donors, and a “permissive dissection technique” was used to remove TM and surrounding tissue from the anterior segment. Single cell suspensions were sequenced using 10× Chromium Single Cell Chips (10× Genomics, Pleasanton, CA, USA) and Illumina HiSeq 2500. The median expression for each of the 157 genes was determined using the Single Cell Portal (https://singlecell.broadinstitute.org/single_cell/study/SCP780/cell-atlas-of-aqueous-humor-outflow-pathways-in-eyes-of-humans-and-four-model-species-provides-insights-into-glaucoma-pathogenesis, accessed on 8 March 2021) [37] and applying default settings (Supplemental Table S4).
4.2. Differential Expression Correlation and Network Analyses
Microarray expression data [27] was used to determine the expression of the 157 IOP-associated genes in both glaucomatous (POAG) and non-glaucomatous TM tissue. In addition, 480 genes were differentially expressed between glaucomatous and non-glaucomatous TM tissue samples in this dataset. The expression levels of the 157 IOP genes and the 480 differentially expressed TM genes were imported into RStudio (version 3.5.3, RStudio, Boston, MA, USA) and differential correlation analysis based upon this expression data was conducted as described previously [160]. In brief, after removing duplicated genes and genes with no expression, gene-gene expression correlations were identified within groups (i.e., glaucomatous or non-glaucomatous tissue) using R’s Pearson correlation function (cor). The R psych package’s test for significant correlation (r.test) was used to calculate the significance (P) of differences between gene-gene correlations in glaucomatous and non-glaucomatous TM tissue. In this way, gene-gene correlations identified in non-glaucomatous tissue that changed significantly (e.g., no correlation or oppositely signed correlation) in glaucomatous tissue could be identified, and vice versa. R’s Benjamini-Hochberg procedure function (p.adjust with “BH” parameter) was then used to calculate the FDR from the p-value. Duplicate correlations were removed, and gene-gene correlations with FDR ≤ 0.01 were considered significant and retained for further analysis.
All significantly correlated genes were input into Cytoscape (version 3.5.1, Cytoscape Consortium, New York, NY, USA) [161] in order to visualize interactions between gene-gene correlation pairs. Furthermore, IPA (version 65367011, Qiagen, Hilden, Germany) was used to identify biological interactions and functional networks involving these significantly correlated genes.
4.3. Reagents
For RNA-sequencing, mirVana miRNA Isolation kits (catalog number AM1560) were obtained from Thermo Fisher Scientific (Waltham, MA, USA), High Sensitivity DNA kits (catalog number 5067–4626) from Agilent Technologies (Santa Clara, CA, USA), and both RiboGone Mammalian kits (catalog number 634847) and SMARTer Stranded Total RNA Low Input Mammalian Sample Prep kits (catalog number 634861) from TaKaRa Bio USA, Inc. (San Jose, CA, USA). RNeasy Mini kits (catalog number 74104) were purchased from Qiagen (Hilden, Germany) and High-Capacity cDNA Reverse Transcription kits with RNase Inhibitor (catalog number 4374966) were purchased from Applied Biosystems (Waltham, MA, USA). 17β-estradiol ELISA kits (catalog number ADI-900–174) were obtained from Enzo Life Sciences (Farmingdale, NY, USA). All primers were obtained from Integrated DNA Technologies (Coralville, IA, USA; Supplemental Table S9). For immunofluorescence, citrate buffer (catalog number 21545) was purchased from Millipore Sigma (Burlington, MA, USA), Triton X-100 (catalog number 1610407) from Bio-Rad Laboratories, Inc. (Hercules, CA, USA), bovine serum albumin (BSA; catalog number a8022) from Sigma-Aldrich (St. Louis, MO, USA), and ProLongTM Diamond Antifade Mountant with DAPI (catalog number 36966) from Invitrogen (Waltham, MA, USA). Mouse anti-ESR1 (catalog number MA1–310) and CyTM3 goat anti-mouse IgG (catalog number 115–165-062) antibodies were purchased from Invitrogen and Jackson ImmunoResearch Laboratories, Inc. (West Grove, PA, USA), respectively (Supplemental Table S10).
4.4. RNA-Sequencing
Four primary TM cell lines and two primary SC cell lines were derived from post-mortem human cornea rims obtained from Duke University. Cultures were derived, maintained, and characterized according to accepted standards [162,163]. RNA isolation and stranded total RNA-sequencing were conducted as described previously [160]. In brief, a mirVana miRNA Isolation kit (Thermo Fisher Scientific Waltham, MA, USA) was used to extract total RNA from the 6 cell lines. RNA quality was assayed with a High Sensitivity DNA kit using Agilent 2100 Bioanalyzer (Agilent Technologies, Santa Clara, CA, USA), with an RNA Integrity Number (RIN) ≥ 6 being required for sequencing. Ribosomal RNA (rRNA) was depleted with a RiboGone Mammalian kit (TaKaRa Bio USA, Inc., San Jose, CA, USA). A SMARTer Stranded RNA-Seq kit (TaKaRa Bio USA, Inc., San Jose, CA, USA) was used to generate cDNA libraries from 200 ng total RNA. Pooled cDNA libraries underwent 50bp paired-end sequencing on an Illumina HiSeq 2500 system (Integrated Genomics Shared Resource, Georgia Cancer Center, Augusta University, Augusta, GA, USA). Alignment against human Ensembl transcriptome or lncRNAs annotated from NONCODE was performed by TopHat 2.1.1 [164] following quality control and demultiplexing, and Cufflinks software determined read counts in fragments per kilobase per million reads (FPKM). An average coverage of at least 25–30 million reads was achieved for each sample.
4.5. Aqueous Humor Estradiol Quantification
Glaucomatous (n = 4) and nonglaucomatous (n = 4) AH samples were obtained from the Eye Clinic at Augusta University Medical Center. The study was approved by the Institutional Review Board at Augusta University. Written consent was collected from all individuals. Samples were collected from male and female patients undergoing cataract or glaucoma surgery (Supplemental Table S6). Bovine (n = 5) and porcine (n = 4) AH were obtained from the local abattoir. After performing a liquid-liquid extraction of 17β-estradiol with 5:1 (v/v) diethyl ether:sample, the presence of 17β-estradiol in these samples was confirmed with enzyme-linked immunosorbent assay (ELISA; Enzo Life Sciences, Farmingdale, NY, USA) following the manufacturer’s protocol. Optical density was determined at 405nm using an Infinite M200 Pro plate reader (Tecan, Männedorf, Switzerland).
4.6. Quantitative Real-Time PCR
Primary human TM cell lines (n = 6; Supplemental Table S7) were derived from post-mortem human cornea rims obtained from the Eye Surgery Center of Augusta and the Department of Ophthalmology at Augusta University (Augusta, GA, USA). Cell lines were cultured and characterized according to accepted standards [162,163]. RNA was extracted using a Qiagen RNeasy Mini kit following the manufacturer’s protocol. RNA quality was assayed with a High Sensitivity DNA kit and 2100 Bioanalyzer (Agilent Technologies, Santa Clara, CA, USA), with an RIN ≥ 6 being required for inclusion. cDNA was reverse transcribed from 100ng RNA using a High-Capacity cDNA Reverse Transcription kit (Applied Biosystems, Waltham, MA, USA) following the manufacturer’s protocol. A 10μL reaction was prepared using iTaq Universal SYBR Green Supermix (Bio-Rad Laboratories, Inc., Hercules, CA, USA) and 10μM of the following primers: β-actin, ESR1, ESR2, and GPER1 (Supplemental Table S9). β-actin was used as an endogenous control. The reactions were run on a StepOnePlus System (Applied Biosystems, Waltham, MA, USA) and relative expression levels were calculated using the ΔΔCt method, with female human TM cells being considered the control sample.
4.7. Immunofluorescence
Discarded cornea rims (n = 4; Supplemental Table S8) were obtained from the Eye Surgery Center of Augusta and the Department of Ophthalmology at Augusta University (Augusta, GA, USA) following cornea transplant. The rims were hemisected and a ~500 mm wedge removed for histology. The corneal rim section was placed in Davidson’s fixative for >24 h, before being moved to 70% EtOH. The corneal rim section was then paraffin-embedded and sectioned by the Augusta University Electron Microscopy and Histology Core. Three sections per sample were processed for H&E staining. Six sections (i.e., 3 sections for negative staining and 3 sections for positive staining) were prepared for immunofluorescence by xylene de-paraffinization, ethanol rehydration, and citrate buffer (1×, Millipore Sigma, Burlington, MA, USA) antigen retrieval. Tissue membranes were permeabilized with Triton X-100 (Bio-Rad Laboratories, Inc., Hercules, CA, USA) before blocking in 5% BSA (Sigma-Aldrich, St. Louis, MO, USA) for 1 hour. Slides were then incubated with 1:100 mouse anti-ESR1 antibody (Invitrogen, Waltham, MA, USA) overnight at 4 °C before incubating with 1:100 secondary antibody (CyTM3 goat anti-mouse IgG; Jackson ImmunoResearch Laboratories, Inc., West Grove, PA, USA) for 30 minutes of darkness at room temperature. ProLongTM Diamond Antifade Mountant (Invitrogen, Waltham, MA, USA) was used to fix coverslips before imaging with an Axio Imager D.2 microscope (Zeiss, Oberkochen, Germany) and Zeiss Zen 2.3 pro software (version 2.3, Zeiss, Oberkochen, Germany).
4.8. Statistical Analysis
The filtering analyses described in Section 4.1 and the statistical analysis for the aqueous humor quantification described in Section 4.5 were performed using Microsoft Excel 2016 (version Office 16, Microsoft Corporation, Redmond, WA, USA) as were ΔΔCt calculations for the qRT-PCR described in Section 4.6. The differential correlation analysis described in Section 4.2 was performed using RStudio (version 3.5.3, RStudio, Boston, MA, USA).
Acknowledgments
The authors thank all of the donors for their ocular samples. This study would not be feasible without these precious samples. The Genotype-Tissue Expression (GTEx) Project was supported by the Common Fund of the Office of the Director of the National Institutes of Health and by NCI, NHGRI, NHLBI, NIDA, NIMH, and NINDS. The data used for the analyses described in this manuscript were obtained from the GTEx Portal on 12/3/2018. Parts of this manuscript were presented at the 2020 ARVO Annual Meeting by Yutao Liu and the 2021 ARVO Annual Meeting by Hannah A. Youngblood.
Supplementary Materials
The following are available online at https://www.mdpi.com/article/10.3390/ijms221910288/s1.
Author Contributions
Conceptualization, H.A.Y. and Y.L.; Formal analysis, H.A.Y., E.P., S.B.S., K.E.B., J.L.W., L.R.P., M.A.H., W.D.S. and Y.L.; Funding acquisition, H.A.Y., S.B.S., L.R.P., W.D.S. and Y.L.; Investigation, H.A.Y., E.P., J.C., K.P., H.Y., J.S., J.L.W., L.R.P., M.A.H. and W.D.S.; Writing—original draft preparation, H.A.Y. and Y.L.; Writing—review and editing, H.A.Y., J.L.W., L.R.P., M.A.H., W.D.S. and Y.L. All authors have read and agreed to the published version of the manuscript.
Funding
This research was funded by the BrightFocus Foundation; Fight for Sight; The Glaucoma Foundation; the Glaucoma Research Foundation; Research to Prevent Blindness; and the National Institutes of Health, F31EY031973, P30EY005722, P30EY031631, R01EY023242, R01EY022359, R01EY023287, R01EY015473, R01EY032559, and R21EY028671. The APC was funded by R01EY023242.
Institutional Review Board Statement
The study was conducted according to the guidelines of the Declaration of Helsinki, and approved by the Institutional Review Board of Augusta University (protocol code 668263, originally approved on 1 April 2015 with continuous annual renewal until 2 September 2022).
Informed Consent Statement
Informed consent was obtained from all subjects involved in the study.
Data Availability Statement
The RNA-Seq data is in the process of being deposited into the NCBI GEO database. This will be updated once the deposit is completed with the GEO accession number.
Conflicts of Interest
The authors declare no conflict of interest. The funders had no role in the design of the study, in the collection, analyses, or interpretation of data, in the writing of the manuscript, or in the decision to publish the results. As non-competing financial interests outside of this work, Louis R. Pasquale is a consultant to Twenty Twenty, Eyenovia, and Skye Biosciences, and Janey L. Wiggs has served as a consultant to Aerpio, Avellion, Allergan, Allergan, Editas, Maze, and Regenxbio.
Footnotes
Publisher’s Note: MDPI stays neutral with regard to jurisdictional claims in published maps and institutional affiliations.
References
- 1.Quigley H.A., Broman A.T. The number of people with glaucoma worldwide in 2010 and 2020. Br. J. Ophthalmol. 2006;90:262–267. doi: 10.1136/bjo.2005.081224. [DOI] [PMC free article] [PubMed] [Google Scholar]
- 2.Tham Y.C., Li X., Wong T.Y., Quigley H.A., Aung T., Cheng C.Y. Global prevalence of glaucoma and projections of glaucoma burden through 2040: A systematic review and meta-analysis. Ophthalmology. 2014;121:2081–2090. doi: 10.1016/j.ophtha.2014.05.013. [DOI] [PubMed] [Google Scholar]
- 3.Jonas J.B., Aung T., Bourne R.R., Bron A.M., Ritch R., Panda-Jonas S. Glaucoma. Lancet. 2017;390:2183–2193. doi: 10.1016/S0140-6736(17)31469-1. [DOI] [PubMed] [Google Scholar]
- 4.Weinreb R.N., Khaw P.T. Primary open-angle glaucoma. Lancet. 2004;363:1711–1720. doi: 10.1016/S0140-6736(04)16257-0. [DOI] [PubMed] [Google Scholar]
- 5.Allingham R.R., Liu Y., Rhee D.J. The genetics of primary open-angle glaucoma: A review. Exp. Eye Res. 2009;88:837–844. doi: 10.1016/j.exer.2008.11.003. [DOI] [PMC free article] [PubMed] [Google Scholar]
- 6.Quigley H.A. Glaucoma. Lancet. 2011;377:1367–1377. doi: 10.1016/S0140-6736(10)61423-7. [DOI] [PubMed] [Google Scholar]
- 7.Weinreb R.N., Aung T., Medeiros F.A. The pathophysiology and treatment of glaucoma: A review. JAMA. 2014;311:1901–1911. doi: 10.1001/jama.2014.3192. [DOI] [PMC free article] [PubMed] [Google Scholar]
- 8.Fan B.J., Wiggs J.L. Glaucoma: Genes, phenotypes, and new directions for therapy. J. Clin. Investig. 2010;120:3064–3072. doi: 10.1172/JCI43085. [DOI] [PMC free article] [PubMed] [Google Scholar]
- 9.Liu Y., Allingham R.R. Molecular genetics in glaucoma. Exp. Eye Res. 2011;93:331–339. doi: 10.1016/j.exer.2011.08.007. [DOI] [PMC free article] [PubMed] [Google Scholar]
- 10.Liu Y., Allingham R.R. Major review: Molecular genetics of primary open-angle glaucoma. Exp. Eye Res. 2017;160:62–84. doi: 10.1016/j.exer.2017.05.002. [DOI] [PMC free article] [PubMed] [Google Scholar]
- 11.Brubaker R.F. The flow of aqueous humor in the human eye. Trans. Am. Ophthalmol. Soc. 1982;80:391–474. [PMC free article] [PubMed] [Google Scholar]
- 12.Bill A. Editorial: The drainage of aqueous humor. Investig. Ophthalmol. 1975;14:1–3. [PubMed] [Google Scholar]
- 13.Stamer W.D. The cell and molecular biology of glaucoma: Mechanisms in the conventional outflow pathway. Investig. Ophthalmol. Vis. Sci. 2012;53:2470–2472. doi: 10.1167/iovs.12-9483f. [DOI] [PubMed] [Google Scholar]
- 14.Stamer W.D., Acott T.S. Current understanding of conventional outflow dysfunction in glaucoma. Curr. Opin. Ophthalmol. 2012;23:135–143. doi: 10.1097/ICU.0b013e32834ff23e. [DOI] [PMC free article] [PubMed] [Google Scholar]
- 15.Stamer W.D., Clark A.F. The many faces of the trabecular meshwork cell. Exp. Eye Res. 2017;158:112–123. doi: 10.1016/j.exer.2016.07.009. [DOI] [PMC free article] [PubMed] [Google Scholar]
- 16.van Koolwijk L.M., Ramdas W.D., Ikram M.K., Jansonius N.M., Pasutto F., Hysi P.G., Macgregor S., Janssen S.F., Hewitt A.W., Viswanathan A.C., et al. Common genetic determinants of intraocular pressure and primary open-angle glaucoma. PLoS Genet. 2012;8:e1002611. doi: 10.1371/journal.pgen.1002611. [DOI] [PMC free article] [PubMed] [Google Scholar]
- 17.Blue Mountains Eye Study (BMES) Wellcome Trust Case Control Consortium 2 (WTCCC2) Genome-wide association study of intraocular pressure identifies the GLCCI1/ICA1 region as a glaucoma susceptibility locus. Hum. Mol. Genet. 2013;22:4653–4660. doi: 10.1093/hmg/ddt293. [DOI] [PMC free article] [PubMed] [Google Scholar]
- 18.Hysi P.G., Cheng C.Y., Springelkamp H., Macgregor S., Bailey J.N.C., Wojciechowski R., Vitart V., Nag A., Hewitt A.W., Höhn R., et al. Genome-wide analysis of multi-ancestry cohorts identifies new loci influencing intraocular pressure and susceptibility to glaucoma. Nat. Genet. 2014;46:1126–1130. doi: 10.1038/ng.3087. [DOI] [PMC free article] [PubMed] [Google Scholar]
- 19.Nag A., Venturini C., Small K.S., Young T.L., Viswanathan A.C., Mackey D.A., Hysi P.G., Hammond C. A genome-wide association study of intra-ocular pressure suggests a novel association in the gene FAM125B in the TwinsUK cohort. Hum. Mol. Genet. 2014;23:3343–3348. doi: 10.1093/hmg/ddu050. [DOI] [PMC free article] [PubMed] [Google Scholar]
- 20.Ozel A.B., Moroi S.E., Reed D.M., Nika M., Schmidt C.M., Akbari S., Scott K., Rozsa F., Pawar H., Musch D.C., et al. Genome-wide association study and meta-analysis of intraocular pressure. Hum. Genet. 2014;133:41–57. doi: 10.1007/s00439-013-1349-5. [DOI] [PMC free article] [PubMed] [Google Scholar]
- 21.Chen Y., Hughes G., Chen X., Qian S., Cao W., Wang L., Wang M., Sun X. Genetic Variants Associated With Different Risks for High Tension Glaucoma and Normal Tension Glaucoma in a Chinese Population. Investig. Ophthalmol. Vis. Sci. 2015;56:2595–2600. doi: 10.1167/iovs.14-16269. [DOI] [PubMed] [Google Scholar]
- 22.Springelkamp H., Iglesias A.I., Cuellar-Partida G., Amin N., Burdon K.P., van Leeuwen E.M., Gharahkhani P., Mishra A., van der Lee S.J., Hewitt A.W., et al. ARHGEF12 influences the risk of glaucoma by increasing intraocular pressure. Hum. Mol. Genet. 2015;24:2689–2699. doi: 10.1093/hmg/ddv027. [DOI] [PubMed] [Google Scholar]
- 23.Springelkamp H., Iglesias A.I., Mishra A., Höhn R., Wojciechowski R., Khawaja A.P., Nag A., Wang Y.X., Wang J.J., Cuellar-Partida G., et al. New insights into the genetics of primary open-angle glaucoma based on meta-analyses of intraocular pressure and optic disc characteristics. Hum. Mol. Genet. 2017;26:438–453. doi: 10.1093/hmg/ddw399. [DOI] [PMC free article] [PubMed] [Google Scholar]
- 24.Khawaja A.P., Cooke Bailey J.N., Wareham N.J., Scott R.A., Simcoe M., Igo R.P., Jr., Song Y.E., Wojciechowski R., Cheng C.Y., Khaw P.T., et al. Genome-wide analyses identify 68 new loci associated with intraocular pressure and improve risk prediction for primary open-angle glaucoma. Nat. Genet. 2018;50:778–782. doi: 10.1038/s41588-018-0126-8. [DOI] [PMC free article] [PubMed] [Google Scholar]
- 25.MacGregor S., Ong J.S., An J., Han X., Zhou T., Siggs O.M., Law M.H., Souzeau E., Sharma S., Lynn D.J., et al. Genome-wide association study of intraocular pressure uncovers new pathways to glaucoma. Nat. Genet. 2018;50:1067–1071. doi: 10.1038/s41588-018-0176-y. [DOI] [PubMed] [Google Scholar]
- 26.Gharahkhani P., Jorgenson E., Hysi P., Khawaja A.P., Pendergrass S., Han X., Ong J.S., Hewitt A.W., Segrè A.V., Rouhana J.M., et al. Genome-wide meta-analysis identifies 127 open-angle glaucoma loci with consistent effect across ancestries. Nat. Commun. 2021;12:1258. doi: 10.1038/s41467-020-20851-4. [DOI] [PMC free article] [PubMed] [Google Scholar]
- 27.Liu Y., Allingham R.R., Qin X., Layfield D., Dellinger A.E., Gibson J., Wheeler J., Ashley-Koch A.E., Stamer W.D., Hauser M.A. Gene expression profile in human trabecular meshwork from patients with primary open-angle glaucoma. Investig. Ophthalmol. Vis. Sci. 2013;54:6382–6389. doi: 10.1167/iovs.13-12128. [DOI] [PMC free article] [PubMed] [Google Scholar]
- 28.Cai J., Perkumas K.M., Qin X., Hauser M.A., Stamer W.D., Liu Y. Expression Profiling of Human Schlemm’s Canal Endothelial Cells From Eyes with and Without Glaucoma. Investig. Ophthalmol. Vis. Sci. 2015;56:6747–6753. doi: 10.1167/iovs.15-17720. [DOI] [PMC free article] [PubMed] [Google Scholar]
- 29.Wagner A.H., Anand V.N., Wang W.H., Chatterton J.E., Sun D., Shepard A.R., Jacobson N., Pang I.H., Deluca A.P., Casavant T.L., et al. Exon-level expression profiling of ocular tissues. Exp. Eye Res. 2013;111:105–111. doi: 10.1016/j.exer.2013.03.004. [DOI] [PMC free article] [PubMed] [Google Scholar]
- 30.Carnes M.U., Allingham R.R., Ashley-Koch A., Hauser M.A. Transcriptome analysis of adult and fetal trabecular meshwork, cornea, and ciliary body tissues by RNA sequencing. Exp. Eye Res. 2018;167:91–99. doi: 10.1016/j.exer.2016.11.021. [DOI] [PubMed] [Google Scholar]
- 31.GTEx Consortium The Genotype-Tissue Expression (GTEx) project. Nat. Genet. 2013;45:580–585. doi: 10.1038/ng.2653. [DOI] [PMC free article] [PubMed] [Google Scholar]
- 32.GTEx Consortium Human genomics. The Genotype-Tissue Expression (GTEx) pilot analysis: Multitissue gene regulation in humans. Science. 2015;348:648–660. doi: 10.1126/science.1262110. [DOI] [PMC free article] [PubMed] [Google Scholar]
- 33.Battle A., Brown C.D., Engelhardt B.E., Montgomery S.B. Genetic effects on gene expression across human tissues. Nature. 2017;550:204–213. doi: 10.1038/nature24277. [DOI] [PMC free article] [PubMed] [Google Scholar]
- 34.eGTEx Project Enhancing GTEx by bridging the gaps between genotype, gene expression, and disease. Nat. Genet. 2017;49:1664–1670. doi: 10.1038/ng.3969. [DOI] [PMC free article] [PubMed] [Google Scholar]
- 35.Kent W.J., Sugnet C.W., Furey T.S., Roskin K.M., Pringle T.H., Zahler A.M., Haussler D. The human genome browser at UCSC. Genome Res. 2002;12:996–1006. doi: 10.1101/gr.229102. [DOI] [PMC free article] [PubMed] [Google Scholar]
- 36.Youngblood H., Cai J., Drewry M.D., Helwa I., Hu E., Liu S., Yu H., Mu H., Hu Y., Perkumas K., et al. Expression of mRNAs, miRNAs, and lncRNAs in Human Trabecular Meshwork Cells Upon Mechanical Stretch. Investig. Ophthalmol. Vis. Sci. 2020;61:2. doi: 10.1167/iovs.61.5.2. [DOI] [PMC free article] [PubMed] [Google Scholar]
- 37.van Zyl T., Yan W., McAdams A., Peng Y.R., Shekhar K., Regev A., Juric D., Sanes J.R. Cell atlas of aqueous humor outflow pathways in eyes of humans and four model species provides insight into glaucoma pathogenesis. Proc. Natl. Acad. Sci. USA. 2020;117:10339–10349. doi: 10.1073/pnas.2001250117. [DOI] [PMC free article] [PubMed] [Google Scholar]
- 38.Ramos R.F., Hoying J.B., Witte M.H., Stamer D.W. Schlemm’s canal endothelia, lymphatic, or blood vasculature? J. Glaucoma. 2007;16:391–405. doi: 10.1097/IJG.0b013e3180654ac6. [DOI] [PubMed] [Google Scholar]
- 39.Allingham R.R., de Kater A.W., Ethier C.R. Schlemm’s canal and primary open angle glaucoma: Correlation between Schlemm’s canal dimensions and outflow facility. Exp. Eye Res. 1996;62:101–109. doi: 10.1006/exer.1996.0012. [DOI] [PubMed] [Google Scholar]
- 40.Herndon L.W., Weizer J.S., Stinnett S.S. Central corneal thickness as a risk factor for advanced glaucoma damage. Arch. Ophthalmol. 2004;122:17–21. doi: 10.1001/archopht.122.1.17. [DOI] [PubMed] [Google Scholar]
- 41.Susanna B.N., Ogata N.G., Jammal A.A., Susanna C.N., Berchuck S.I., Medeiros F.A. Corneal Biomechanics and Visual Field Progression in Eyes with Seemingly Well-Controlled Intraocular Pressure. Ophthalmology. 2019;126:1640–1646. doi: 10.1016/j.ophtha.2019.07.023. [DOI] [PMC free article] [PubMed] [Google Scholar]
- 42.Johnstone M.A., Grant W.G. Pressure-dependent changes in structures of the aqueous outflow system of human and monkey eyes. Am. J. Ophthalmol. 1973;75:365–383. doi: 10.1016/0002-9394(73)91145-8. [DOI] [PubMed] [Google Scholar]
- 43.Ramos R.F., Sumida G.M., Stamer W.D. Cyclic mechanical stress and trabecular meshwork cell contractility. Investig. Ophthalmol. Vis. Sci. 2009;50:3826–3832. doi: 10.1167/iovs.08-2694. [DOI] [PMC free article] [PubMed] [Google Scholar]
- 44.Coleman D.J., Trokel S. Direct-recorded intraocular pressure variations in a human subject. Arch. Ophthalmol. 1969;82:637–640. doi: 10.1001/archopht.1969.00990020633011. [DOI] [PubMed] [Google Scholar]
- 45.Perkins E.S. The ocular pulse. Curr. Eye Res. 1981;1:19–23. doi: 10.3109/02713688109019968. [DOI] [PubMed] [Google Scholar]
- 46.Johnstone M., Martin E., Jamil A. Pulsatile flow into the aqueous veins: Manifestations in normal and glaucomatous eyes. Exp. Eye Res. 2011;92:318–327. doi: 10.1016/j.exer.2011.03.011. [DOI] [PMC free article] [PubMed] [Google Scholar]
- 47.Patel G., Fury W., Yang H., Gomez-Caraballo M., Bai Y., Yang T., Adler C., Wei Y., Ni M., Schmitt H., et al. Molecular taxonomy of human ocular outflow tissues defined by single-cell transcriptomics. Proc. Natl. Acad. Sci. USA. 2020;117:12856–12867. doi: 10.1073/pnas.2001896117. [DOI] [PMC free article] [PubMed] [Google Scholar]
- 48.Clark A.F., Wilson K., McCartney M.D., Miggans S.T., Kunkle M., Howe W. Glucocorticoid-induced formation of cross-linked actin networks in cultured human trabecular meshwork cells. Investig. Ophthalmol. Vis. Sci. 1994;35:281–294. [PubMed] [Google Scholar]
- 49.Gasiorowski J.Z., Russell P. Biological properties of trabecular meshwork cells. Exp. Eye Res. 2009;88:671–675. doi: 10.1016/j.exer.2008.08.006. [DOI] [PMC free article] [PubMed] [Google Scholar]
- 50.Raghunathan V.K., Morgan J.T., Park S.A., Weber D., Phinney B.S., Murphy C.J., Russell P. Dexamethasone Stiffens Trabecular Meshwork, Trabecular Meshwork Cells, and Matrix. Investig. Ophthalmol. Vis. Sci. 2015;56:4447–4459. doi: 10.1167/iovs.15-16739. [DOI] [PMC free article] [PubMed] [Google Scholar]
- 51.Wang K., Read A.T., Sulchek T., Ethier C.R. Trabecular meshwork stiffness in glaucoma. Exp. Eye Res. 2017;158:3–12. doi: 10.1016/j.exer.2016.07.011. [DOI] [PMC free article] [PubMed] [Google Scholar]
- 52.Gupta P., Johar Sr K., Nagpal K., Vasavada A.J.S. Sex hormone receptors in the human eye. Surv. Ophthalmol. 2005;50:274–284. doi: 10.1016/j.survophthal.2005.02.005. [DOI] [PubMed] [Google Scholar]
- 53.Mookherjee S., Acharya M., Banerjee D., Bhattacharjee A., Ray K. Molecular basis for involvement of CYP1B1 in MYOC upregulation and its potential implication in glaucoma pathogenesis. PLoS ONE. 2012;7:e45077. doi: 10.1371/journal.pone.0045077. [DOI] [PMC free article] [PubMed] [Google Scholar]
- 54.Iqbal Z., Midgley J.M., Watson D.G. Determination of oestrone, 17alpha- and 17beta-oestradiol in bovine aqueous humor using gas chromatography-negative ion chemical ionization mass spectrometry. Arch. Pharm. Res. 1997;20:247–252. doi: 10.1007/BF02976152. [DOI] [PubMed] [Google Scholar]
- 55.Colitz C.M., Lu P., Sugimoto Y., Barden C.A., Chandler H.L. Estradiol biosynthesis in canine lens epithelial cells. Curr. Eye Res. 2015;40:541–548. doi: 10.3109/02713683.2014.935446. [DOI] [PubMed] [Google Scholar]
- 56.Stárka L., Hampl R., Bicíková M., Obenberger J. Indentification and radioimmunologic estimation of sexual steroid hormones in aqueous humor and vitreous of rabbit eye. Albrecht Von Graefes Arch. Klin. Exp. Ophthalmol. 1976;199:261–266. doi: 10.1007/BF00417296. [DOI] [PubMed] [Google Scholar]
- 57.Zhang X.H., Sun H.M., Ji J., Zhang H., Ma W.J., Jin Z., Yuan J.Q. Sex hormones and their receptors in patients with age-related cataract. J. Cataract. Refract. Surg. 2003;29:71–77. doi: 10.1016/S0886-3350(02)01436-0. [DOI] [PubMed] [Google Scholar]
- 58.Tobias E.S., Hurlstone A.F., MacKenzie E., McFarlane R., Black D.M. The TES gene at 7q31.1 is methylated in tumours and encodes a novel growth-suppressing LIM domain protein. Oncogene. 2001;20:2844–2853. doi: 10.1038/sj.onc.1204433. [DOI] [PubMed] [Google Scholar]
- 59.Coutts A.S., MacKenzie E., Griffith E., Black D.M. TES is a novel focal adhesion protein with a role in cell spreading. J. Cell Sci. 2003;116:897–906. doi: 10.1242/jcs.00278. [DOI] [PubMed] [Google Scholar]
- 60.Garvalov B.K., Higgins T.E., Sutherland J.D., Zettl M., Scaplehorn N., Köcher T., Piddini E., Griffiths G., Way M. The conformational state of Tes regulates its zyxin-dependent recruitment to focal adhesions. J. Cell Biol. 2003;161:33–39. doi: 10.1083/jcb.200211015. [DOI] [PMC free article] [PubMed] [Google Scholar]
- 61.Sala S., Oakes P.W. Stress fiber strain recognition by the LIM protein testin is cryptic and mediated by RhoA. Mol. Biol. Cell. 2021;32:1758–1771. doi: 10.1091/mbc.E21-03-0156. [DOI] [PMC free article] [PubMed] [Google Scholar]
- 62.Tumminia S.J., Mitton K.P., Arora J., Zelenka P., Epstein D.L., Russell P. Mechanical stretch alters the actin cytoskeletal network and signal transduction in human trabecular meshwork cells. Investig. Ophthalmol. Vis. Sci. 1998;39:1361–1371. [PubMed] [Google Scholar]
- 63.Clark A.F., Brotchie D., Read A.T., Hellberg P., English-Wright S., Pang I.H., Ethier C.R., Grierson I. Dexamethasone alters F-actin architecture and promotes cross-linked actin network formation in human trabecular meshwork tissue. Cell Motil. Cytoskelet. 2005;60:83–95. doi: 10.1002/cm.20049. [DOI] [PubMed] [Google Scholar]
- 64.Wang J., Liu X., Zhong Y. Rho/Rho-associated kinase pathway in glaucoma (Review) Int. J. Oncol. 2013;43:1357–1367. doi: 10.3892/ijo.2013.2100. [DOI] [PubMed] [Google Scholar]
- 65.Hill L.J., Mead B., Thomas C.N., Foale S., Feinstein E., Berry M., Blanch R.J., Ahmed Z., Logan A. TGF-β-induced IOP elevations are mediated by RhoA in the early but not the late fibrotic phase of open angle glaucoma. Mol. Vis. 2018;24:712–726. [PMC free article] [PubMed] [Google Scholar]
- 66.Wernert N., Raes M.B., Lassalle P., Dehouck M.P., Gosselin B., Vandenbunder B., Stehelin D. c-ets1 proto-oncogene is a transcription factor expressed in endothelial cells during tumor vascularization and other forms of angiogenesis in humans. Am. J. Pathol. 1992;140:119–127. [PMC free article] [PubMed] [Google Scholar]
- 67.Bedford F.K., Ashworth A., Enver T., Wiedemann L.M. HEX: A novel homeobox gene expressed during haematopoiesis and conserved between mouse and human. Nucleic Acids Res. 1993;21:1245–1249. doi: 10.1093/nar/21.5.1245. [DOI] [PMC free article] [PubMed] [Google Scholar]
- 68.Marfil V., Moya M., Pierreux C.E., Castell J.V., Lemaigre F.P., Real F.X., Bort R. Interaction between Hhex and SOX13 modulates Wnt/TCF activity. J. Biol. Chem. 2010;285:5726–5737. doi: 10.1074/jbc.M109.046649. [DOI] [PMC free article] [PubMed] [Google Scholar]
- 69.Mao W., Millar J.C., Wang W.H., Silverman S.M., Liu Y., Wordinger R.J., Rubin J.S., Pang I.H., Clark A.F. Existence of the canonical Wnt signaling pathway in the human trabecular meshwork. Investig. Ophthalmol. Vis. Sci. 2012;53:7043–7051. doi: 10.1167/iovs.12-9664. [DOI] [PMC free article] [PubMed] [Google Scholar]
- 70.Wang X., Huai G., Wang H., Liu Y., Qi P., Shi W., Peng J., Yang H., Deng S., Wang Y. Mutual regulation of the Hippo/Wnt/LPA/TGF-β signaling pathways and their roles in glaucoma (Review) Int. J. Mol. Med. 2018;41:1201–1212. doi: 10.3892/ijmm.2017.3352. [DOI] [PMC free article] [PubMed] [Google Scholar]
- 71.Werner E., Kowalczyk A.P., Faundez V. Anthrax toxin receptor 1/tumor endothelium marker 8 mediates cell spreading by coupling extracellular ligands to the actin cytoskeleton. J. Biol. Chem. 2006;281:23227–23236. doi: 10.1074/jbc.M603676200. [DOI] [PubMed] [Google Scholar]
- 72.Muragaki Y., Jacenko O., Apte S., Mattei M.G., Ninomiya Y., Olsen B.R. The alpha 2(VIII) collagen gene. A novel member of the short chain collagen family located on the human chromosome 1. J. Biol. Chem. 1991;266:7721–7727. doi: 10.1016/S0021-9258(20)89508-8. [DOI] [PubMed] [Google Scholar]
- 73.Saharinen J., Hyytiäinen M., Taipale J., Keski-Oja J. Latent transforming growth factor-beta binding proteins (LTBPs)—structural extracellular matrix proteins for targeting TGF-beta action. Cytokine Growth Factor Rev. 1999;10:99–117. doi: 10.1016/S1359-6101(99)00010-6. [DOI] [PubMed] [Google Scholar]
- 74.Oklü R., Hesketh R. The latent transforming growth factor beta binding protein (LTBP) family. Biochem. J. 2000;352:601–610. doi: 10.1042/bj3520601. [DOI] [PMC free article] [PubMed] [Google Scholar]
- 75.Cao H., Mok A., Miskie B., Hegele R.A. Single-nucleotide polymorphisms of the proprotein convertase subtilisin/ kexin type 5 (PCSK5) gene. J. Hum. Genet. 2001;46:730–732. doi: 10.1007/s100380170008. [DOI] [PubMed] [Google Scholar]
- 76.Dittmer J., Vetter M., Blumenthal S.G., Lindemann R.K., Kölbl H. Importance of ets1 proto-oncogene for breast cancer progression. Zent. Gynakol. 2004;126:269–271. doi: 10.1055/s-2004-822758. [DOI] [PubMed] [Google Scholar]
- 77.Han B., Bai X.H., Lodyga M., Xu J., Yang B.B., Keshavjee S., Post M., Liu M. Conversion of mechanical force into biochemical signaling. J. Biol. Chem. 2004;279:54793–54801. doi: 10.1074/jbc.M406880200. [DOI] [PubMed] [Google Scholar]
- 78.Kobayashi N., Kostka G., Garbe J.H., Keene D.R., Bächinger H.P., Hanisch F.G., Markova D., Tsuda T., Timpl R., Chu M.L., et al. A comparative analysis of the fibulin protein family. Biochemical characterization, binding interactions, and tissue localization. J. Biol. Chem. 2007;282:11805–11816. doi: 10.1074/jbc.M611029200. [DOI] [PubMed] [Google Scholar]
- 79.Bielenberg D.R., Shimizu A., Klagsbrun M. Semaphorin-induced cytoskeletal collapse and repulsion of endothelial cells. Methods Enzymol. 2008;443:299–314. doi: 10.1016/S0076-6879(08)02015-6. [DOI] [PubMed] [Google Scholar]
- 80.Khoshnoodi J., Pedchenko V., Hudson B.G. Mammalian collagen IV. Microsc. Res. Tech. 2008;71:357–370. doi: 10.1002/jemt.20564. [DOI] [PMC free article] [PubMed] [Google Scholar]
- 81.Gaur P., Bielenberg D.R., Samuel S., Bose D., Zhou Y., Gray M.J., Dallas N.A., Fan F., Xia L., Lu J., et al. Role of class 3 semaphorins and their receptors in tumor growth and angiogenesis. Clin. Cancer Res. 2009;15:6763–6770. doi: 10.1158/1078-0432.CCR-09-1810. [DOI] [PubMed] [Google Scholar]
- 82.Nievergall E., Janes P.W., Stegmayer C., Vail M.E., Haj F.G., Teng S.W., Neel B.G., Bastiaens P.I., Lackmann M. PTP1B regulates Eph receptor function and trafficking. J. Cell Biol. 2010;191:1189–1203. doi: 10.1083/jcb.201005035. [DOI] [PMC free article] [PubMed] [Google Scholar]
- 83.Paule S., Aljofan M., Simon C., Rombauts L.J., Nie G. Cleavage of endometrial α-integrins into their functional forms is mediated by proprotein convertase 5/6. Hum. Reprod. 2012;27:2766–2774. doi: 10.1093/humrep/des203. [DOI] [PubMed] [Google Scholar]
- 84.Ye K., Ouyang X., Wang Z., Yao L., Zhang G. SEMA3F Promotes Liver Hepatocellular Carcinoma Metastasis by Activating Focal Adhesion Pathway. DNA Cell Biol. 2020;39:474–483. doi: 10.1089/dna.2019.4904. [DOI] [PubMed] [Google Scholar]
- 85.Zhou L., Zhang S.R., Yue B.Y. Adhesion of human trabecular meshwork cells to extracellular matrix proteins. Roles and distribution of integrin receptors. Investig. Ophthalmol. Vis. Sci. 1996;37:104–113. [PubMed] [Google Scholar]
- 86.Acott T.S., Kelley M.J. Extracellular matrix in the trabecular meshwork. Exp. Eye Res. 2008;86:543–561. doi: 10.1016/j.exer.2008.01.013. [DOI] [PMC free article] [PubMed] [Google Scholar]
- 87.Zhong Y., Wang J., Luo X. Integrins in trabecular meshwork and optic nerve head: Possible association with the pathogenesis of glaucoma. Biomed. Res. Int. 2013;2013:202905. doi: 10.1155/2013/202905. [DOI] [PMC free article] [PubMed] [Google Scholar]
- 88.Acott T.S., Vranka J.A., Keller K.E., Raghunathan V., Kelley M.J. Normal and glaucomatous outflow regulation. Prog. Retin. Eye Res. 2021;82:100897. doi: 10.1016/j.preteyeres.2020.100897. [DOI] [PMC free article] [PubMed] [Google Scholar]
- 89.Liton P.B., Gonzalez P. Stress response of the trabecular meshwork. J. Glaucoma. 2008;17:378–385. doi: 10.1097/IJG.0b013e31815f52a8. [DOI] [PMC free article] [PubMed] [Google Scholar]
- 90.WuDunn D. Mechanobiology of trabecular meshwork cells. Exp. Eye Res. 2009;88:718–723. doi: 10.1016/j.exer.2008.11.008. [DOI] [PubMed] [Google Scholar]
- 91.Lakk M., Križaj D. TRPV4-Rho signaling drives cytoskeletal and focal adhesion remodeling in trabecular meshwork cells. Am. J. Physiol. Cell Physiol. 2021;320:C1013–C1030. doi: 10.1152/ajpcell.00599.2020. [DOI] [PMC free article] [PubMed] [Google Scholar]
- 92.Nakatsuka H., Sokabe T., Yamamoto K., Sato Y., Hatakeyama K., Kamiya A., Ando J. Shear stress induces hepatocyte PAI-1 gene expression through cooperative Sp1/Ets-1 activation of transcription. Am. J. Physiol. Gastrointest. Liver Physiol. 2006;291:G26–G34. doi: 10.1152/ajpgi.00467.2005. [DOI] [PubMed] [Google Scholar]
- 93.Milkiewicz M., Uchida C., Gee E., Fudalewski T., Haas T.L. Shear stress-induced Ets-1 modulates protease inhibitor expression in microvascular endothelial cells. J. Cell Physiol. 2008;217:502–510. doi: 10.1002/jcp.21526. [DOI] [PMC free article] [PubMed] [Google Scholar]
- 94.Feng W., Chumley P., Allon M., George J., Scott D.W., Patel R.P., Litovsky S., Jaimes E.A. The transcription factor E26 transformation-specific sequence-1 mediates neointima formation in arteriovenous fistula. J. Am. Soc. Nephrol. 2014;25:475–487. doi: 10.1681/ASN.2013040424. [DOI] [PMC free article] [PubMed] [Google Scholar]
- 95.Yang J.H., Briggs W.H., Libby P., Lee R.T. Small mechanical strains selectively suppress matrix metalloproteinase-1 expression by human vascular smooth muscle cells. J. Biol. Chem. 1998;273:6550–6555. doi: 10.1074/jbc.273.11.6550. [DOI] [PubMed] [Google Scholar]
- 96.Wang P., Yang L., You X., Singh G.K., Zhang L., Yan Y., Sung K.L. Mechanical stretch regulates the expression of matrix metalloproteinase in rheumatoid arthritis fibroblast-like synoviocytes. Connect. Tissue Res. 2009;50:98–109. doi: 10.1080/03008200802348625. [DOI] [PubMed] [Google Scholar]
- 97.Colorado P.C., Torre A., Kamphaus G., Maeshima Y., Hopfer H., Takahashi K., Volk R., Zamborsky E.D., Herman S., Sarkar P.K., et al. Anti-angiogenic cues from vascular basement membrane collagen. Cancer Res. 2000;60:2520–2526. [PubMed] [Google Scholar]
- 98.Lelièvre E., Lionneton F., Soncin F., Vandenbunder B. The Ets family contains transcriptional activators and repressors involved in angiogenesis. Int. J. Biochem. Cell Biol. 2001;33:391–407. doi: 10.1016/S1357-2725(01)00025-5. [DOI] [PubMed] [Google Scholar]
- 99.Sato Y. Role of ETS family transcription factors in vascular development and angiogenesis. Cell Struct. Funct. 2001;26:19–24. doi: 10.1247/csf.26.19. [DOI] [PubMed] [Google Scholar]
- 100.Oike Y., Yasunaga K., Suda T. Angiopoietin-related/angiopoietin-like proteins regulate angiogenesis. Int. J. Hematol. 2004;80:21–28. doi: 10.1532/IJH97.04034. [DOI] [PubMed] [Google Scholar]
- 101.Adiguzel E., Hou G., Mulholland D., Hopfer U., Fukai N., Olsen B., Bendeck M. Migration and growth are attenuated in vascular smooth muscle cells with type VIII collagen-null alleles. Arterioscler. Thromb. Vasc. Biol. 2006;26:56–61. doi: 10.1161/01.ATV.0000194155.96456.b7. [DOI] [PubMed] [Google Scholar]
- 102.Hotchkiss K.A., Basile C.M., Spring S.C., Bonuccelli G., Lisanti M.P., Terman B.I. TEM8 expression stimulates endothelial cell adhesion and migration by regulating cell-matrix interactions on collagen. Exp. Cell Res. 2005;305:133–144. doi: 10.1016/j.yexcr.2004.12.025. [DOI] [PubMed] [Google Scholar]
- 103.Turner N.J., Murphy M.O., Kielty C.M., Shuttleworth C.A., Black R.A., Humphries M.J., Walker M.G., Canfield A.E. Alpha2(VIII) collagen substrata enhance endothelial cell retention under acute shear stress flow via an alpha2beta1 integrin-dependent mechanism: An in vitro and in vivo study. Circulation. 2006;114:820–829. doi: 10.1161/CIRCULATIONAHA.106.635292. [DOI] [PubMed] [Google Scholar]
- 104.Plaisier E., Gribouval O., Alamowitch S., Mougenot B., Prost C., Verpont M.C., Marro B., Desmettre T., Cohen S.Y., Roullet E., et al. COL4A1 mutations and hereditary angiopathy, nephropathy, aneurysms, and muscle cramps. N. Engl. J. Med. 2007;357:2687–2695. doi: 10.1056/NEJMoa071906. [DOI] [PubMed] [Google Scholar]
- 105.Nyberg P., Xie L., Sugimoto H., Colorado P., Sund M., Holthaus K., Sudhakar A., Salo T., Kalluri R. Characterization of the anti-angiogenic properties of arresten, an alpha1beta1 integrin-dependent collagen-derived tumor suppressor. Exp. Cell Res. 2008;314:3292–3305. doi: 10.1016/j.yexcr.2008.08.011. [DOI] [PMC free article] [PubMed] [Google Scholar]
- 106.Plaisier E., Chen Z., Gekeler F., Benhassine S., Dahan K., Marro B., Alamowitch S., Paques M., Ronco P. Novel COL4A1 mutations associated with HANAC syndrome: A role for the triple helical CB3[IV] domain. Am. J. Med. Genet. A. 2010;152:2550–2555. doi: 10.1002/ajmg.a.33659. [DOI] [PubMed] [Google Scholar]
- 107.Staton C.A. Class 3 semaphorins and their receptors in physiological and pathological angiogenesis. Biochem. Soc. Trans. 2011;39:1565–1570. doi: 10.1042/BST20110654. [DOI] [PubMed] [Google Scholar]
- 108.Rosenquist R., Epstein D., Melamed S., Johnson M., Grant W.M. Outflow resistance of enucleated human eyes at two different perfusion pressures and different extents of trabeculotomy. Curr. Eye Res. 1989;8:1233–1240. doi: 10.3109/02713688909013902. [DOI] [PubMed] [Google Scholar]
- 109.Carreon T., van der Merwe E., Fellman R.L., Johnstone M., Bhattacharya S.K. Aqueous outflow—A continuum from trabecular meshwork to episcleral veins. Prog. Retin. Eye Res. 2017;57:108–133. doi: 10.1016/j.preteyeres.2016.12.004. [DOI] [PMC free article] [PubMed] [Google Scholar]
- 110.Gonzalez J.M., Jr., Ko M.K., Hong Y.K., Weigert R., Tan J.C.H. Deep tissue analysis of distal aqueous drainage structures and contractile features. Sci. Rep. 2017;7:17071. doi: 10.1038/s41598-017-16897-y. [DOI] [PMC free article] [PubMed] [Google Scholar]
- 111.Waxman S., Wang C., Dang Y., Hong Y., Esfandiari H., Shah P., Lathrop K.L., Loewen R.T., Loewen N.A. Structure-Function Changes of the Porcine Distal Outflow Tract in Response to Nitric Oxide. Investig. Ophthalmol. Vis. Sci. 2018;59:4886–4895. doi: 10.1167/iovs.18-24943. [DOI] [PMC free article] [PubMed] [Google Scholar]
- 112.Patel P., Harris A., Toris C., Tobe L., Lang M., Belamkar A., Ng A., Verticchio Vercellin A.C., Mathew S., Siesky B. Effects of Sex Hormones on Ocular Blood Flow and Intraocular Pressure in Primary Open-angle Glaucoma: A Review. J. Glaucoma. 2018;27:1037–1041. doi: 10.1097/IJG.0000000000001106. [DOI] [PubMed] [Google Scholar]
- 113.Sator M.O., Joura E.A., Frigo P., Kurz C., Metka M., Hommer A., Huber J.C. Hormone replacement therapy and intraocular pressure. Maturitas. 1997;28:55–58. doi: 10.1016/S0378-5122(97)00060-1. [DOI] [PubMed] [Google Scholar]
- 114.Sator M.O., Akramian J., Joura E.A., Nessmann A., Wedrich A., Gruber D., Metka M., Huber J.C. Reduction of intraocular pressure in a glaucoma patient undergoing hormone replacement therapy. Maturitas. 1998;29:93–95. doi: 10.1016/S0378-5122(97)00091-1. [DOI] [PubMed] [Google Scholar]
- 115.Sorrentino C., Affinito P., Mattace Raso F., Loffredo M., Merlino P., Loffredo A., Palomba S., Nappi C. Effect of hormone replacement therapy on postmenopausal ocular function. Minerva Ginecol. 1998;50:19–24. [PubMed] [Google Scholar]
- 116.Lang Y., Lang N., Ben-Ami M., Garzozi H. The effects of hormone replacement therapy (HRT) on the human eye. Harefuah. 2002;141:287–291. [PubMed] [Google Scholar]
- 117.Altintas O., Caglar Y., Yuksel N., Demirci A., Karabas L. The effects of menopause and hormone replacement therapy on quality and quantity of tear, intraocular pressure and ocular blood flow. Ophthalmologica. 2004;218:120–129. doi: 10.1159/000076148. [DOI] [PubMed] [Google Scholar]
- 118.Uncu G., Avci R., Uncu Y., Kaymaz C., Develioğlu O.J.G.E. The effects of different hormone replacement therapy regimens on tear function, intraocular pressure and lens opacity. Gynecol. Endocrinol. 2006;22:501–505. doi: 10.1080/09513590600917919. [DOI] [PubMed] [Google Scholar]
- 119.Wojtowiec A., Wojtowiec P., Misiuk-Hojto M. The role of estrogen in the development of glacoma tous optic neuropathy. Klin. Oczna. 2016;117:275–277. [PubMed] [Google Scholar]
- 120.Harris A., Harris M., Biller J., Garzozi H., Zarfty D., Ciulla T.A., Martin B. Aging affects the retrobulbar circulation differently in women and men. Arch. Ophthalmol. 2000;118:1076–1080. doi: 10.1001/archopht.118.8.1076. [DOI] [PubMed] [Google Scholar]
- 121.Yucel I., Akar M.E., Dora B., Akar Y., Taskin O., Ozer H.O. Effect of the menstrual cycle on standard achromatic and blue-on-yellow visual field analysis of women with migraine. Can. J. Ophthalmol. 2005;40:51–57. doi: 10.1016/S0008-4182(05)80117-6. [DOI] [PubMed] [Google Scholar]
- 122.Green K., Phillips C.I., Cheeks L., Slagle T. Aqueous humor flow rate and intraocular pressure during and after pregnancy. Ophthalmic Res. 1988;20:353–357. doi: 10.1159/000266751. [DOI] [PubMed] [Google Scholar]
- 123.Centofanti M., Migliardi R., Bonini S., Manni G., Bucci M.G., Pesavento C.B., Amin C.S., Harris A. Pulsatile ocular blood flow during pregnancy. Eur. J. Ophthalmol. 2002;12:276–280. doi: 10.1177/112067210201200404. [DOI] [PubMed] [Google Scholar]
- 124.Bahadir Kilavuzoglu A.E., Cosar C.B., Bildirici I., Cetin O., Ozbasli E. Estrogen- and Progesterone-Induced Variation in Corneal Parameters According to Hormonal Status. Eye Contact Lens. 2018;44:S179–S184. doi: 10.1097/ICL.0000000000000376. [DOI] [PubMed] [Google Scholar]
- 125.Sekhar G.C., Nagarajan R. Ocular toxicity of tamoxifen. Indian J. Ophthalmol. 1995;43:23–26. [PubMed] [Google Scholar]
- 126.Centofanti M., Zarfati D., Manni G.L., Bonini S., Migliardi R., Oddone F., Harris A., Bucci M.G. The influence of oestrogen on the pulsatile ocular blood flow. Acta Ophthalmol. Scand. Suppl. 2000;232:38–39. doi: 10.1111/j.1600-0420.2000.tb01094.x. [DOI] [PubMed] [Google Scholar]
- 127.Kosior-Jarecka E., Sagan M., Wróbel-Dudzińska D., Łukasik U., Aung T., Khor C.C., Kocki J., Żarnowski T. Estrogen receptor gene polymorphisms and their influence on clinical status of Caucasian patients with primary open angle glaucoma. Ophthalmic Genet. 2019;40:323–328. doi: 10.1080/13816810.2019.1639201. [DOI] [PubMed] [Google Scholar]
- 128.Jansson I., Stoilov I., Sarfarazi M., Schenkman J.B. Effect of two mutations of human CYP1B1, G61E and R469W, on stability and endogenous steroid substrate metabolism. Pharmacogenetics. 2001;11:793–801. doi: 10.1097/00008571-200112000-00007. [DOI] [PubMed] [Google Scholar]
- 129.Pasquale L.R., Loomis S.J., Weinreb R.N., Kang J.H., Yaspan B.L., Bailey J.C., Gaasterland D., Gaasterland T., Lee R.K., Scott W.K., et al. Estrogen pathway polymorphisms in relation to primary open angle glaucoma: An analysis accounting for gender from the United States. Mol. Vis. 2013;19:1471–1481. [PMC free article] [PubMed] [Google Scholar]
- 130.Chen X., Liu Y., Zhang Y., Kam W.R., Pasquale L.R., Sullivan D.A. Impact of aromatase absence on murine intraocular pressure and retinal ganglion cells. Sci. Rep. 2018;8:3280. doi: 10.1038/s41598-018-21475-x. [DOI] [PMC free article] [PubMed] [Google Scholar]
- 131.Kobayashi K., Kobayashi H., Ueda M., Honda Y. Estrogen receptor expression in bovine and rat retinas. Investig. Ophthalmol. Vis. Sci. 1998;39:2105–2110. [PubMed] [Google Scholar]
- 132.Kumar D.M., Perez E., Cai Z.Y., Aoun P., Brun-Zinkernagel A.M., Covey D.F., Simpkins J.W., Agarwal N. Role of nonfeminizing estrogen analogues in neuroprotection of rat retinal ganglion cells against glutamate-induced cytotoxicity. Free Radic. Biol. Med. 2005;38:1152–1163. doi: 10.1016/j.freeradbiomed.2004.12.007. [DOI] [PubMed] [Google Scholar]
- 133.Russell-Randall K.R., Dortch-Carnes J. Kappa opioid receptor localization and coupling to nitric oxide production in cells of the anterior chamber. Investig. Ophthalmol. Vis. Sci. 2011;52:5233–5239. doi: 10.1167/iovs.10-6613. [DOI] [PMC free article] [PubMed] [Google Scholar]
- 134.Bucolo C., Campana G., Di Toro R., Cacciaguerra S., Spampinato S. Sigma1 recognition sites in rabbit iris-ciliary body: Topical sigma1-site agonists lower intraocular pressure. J. Pharmacol. Exp. Ther. 1999;289:1362–1369. [PubMed] [Google Scholar]
- 135.Bucolo C., Drago F. Effects of neurosteroids on ischemia-reperfusion injury in the rat retina: Role of sigma1 recognition sites. Eur. J. Pharmacol. 2004;498:111–114. doi: 10.1016/j.ejphar.2004.06.067. [DOI] [PubMed] [Google Scholar]
- 136.Delafontaine P., Song Y.H., Li Y. Expression, regulation, and function of IGF-1, IGF-1R, and IGF-1 binding proteins in blood vessels. Arterioscler. Thromb. Vasc. Biol. 2004;24:435–444. doi: 10.1161/01.ATV.0000105902.89459.09. [DOI] [PubMed] [Google Scholar]
- 137.Kanda S., Miyata Y., Kanetake H. T-cell factor-4-dependent up-regulation of fibronectin is involved in fibroblast growth factor-2-induced tube formation by endothelial cells. J. Cell Biochem. 2005;94:835–847. doi: 10.1002/jcb.20354. [DOI] [PubMed] [Google Scholar]
- 138.Hofmann J.J., Luisa Iruela-Arispe M. Notch expression patterns in the retina: An eye on receptor-ligand distribution during angiogenesis. Gene Expr Patterns. 2007;7:461–470. doi: 10.1016/j.modgep.2006.11.002. [DOI] [PMC free article] [PubMed] [Google Scholar]
- 139.Kume T. Novel insights into the differential functions of Notch ligands in vascular formation. J. Angiogenes Res. 2009;1:8. doi: 10.1186/2040-2384-1-8. [DOI] [PMC free article] [PubMed] [Google Scholar]
- 140.Xie L., Frank P.G., Lisanti M.P., Sowa G. Endothelial cells isolated from caveolin-2 knockout mice display higher proliferation rate and cell cycle progression relative to their wild-type counterparts. Am. J. Physiol. Cell Physiol. 2010;298:C693–C701. doi: 10.1152/ajpcell.00401.2009. [DOI] [PMC free article] [PubMed] [Google Scholar]
- 141.Kume T. Ligand-dependent Notch signaling in vascular formation. Adv. Exp. Med. Biol. 2012;727:210–222. doi: 10.1007/978-1-4614-0899-4_16. [DOI] [PubMed] [Google Scholar]
- 142.Napp L.C., Augustynik M., Paesler F., Krishnasamy K., Woiterski J., Limbourg A., Bauersachs J., Drexler H., Le Noble F., Limbourg F.P. Extrinsic Notch ligand Delta-like 1 regulates tip cell selection and vascular branching morphogenesis. Circ. Res. 2012;110:530–535. doi: 10.1161/CIRCRESAHA.111.263319. [DOI] [PubMed] [Google Scholar]
- 143.Panneerselvam M., Patel H.H., Roth D.M. Caveolins and heart diseases. Adv. Exp. Med. Biol. 2012;729:145–156. doi: 10.1007/978-1-4614-1222-9_10. [DOI] [PubMed] [Google Scholar]
- 144.Melincovici C.S., Boşca A.B., Şuşman S., Mărginean M., Mihu C., Istrate M., Moldovan I.M., Roman A.L., Mihu C.M. Vascular endothelial growth factor (VEGF)—Key factor in normal and pathological angiogenesis. Rom. J. Morphol. Embryol. 2018;59:455–467. [PubMed] [Google Scholar]
- 145.Sáinz-Jaspeado M., Claesson-Welsh L. Cytokines regulating lymphangiogenesis. Curr. Opin. Immunol. 2018;53:58–63. doi: 10.1016/j.coi.2018.04.003. [DOI] [PubMed] [Google Scholar]
- 146.Arnal J.F., Fontaine C., Billon-Galés A., Favre J., Laurell H., Lenfant F., Gourdy P. Estrogen receptors and endothelium. Arterioscler. Thromb. Vasc. Biol. 2010;30:1506–1512. doi: 10.1161/ATVBAHA.109.191221. [DOI] [PubMed] [Google Scholar]
- 147.Brambilla E., Constantin B., Drabkin H., Roche J. Semaphorin SEMA3F localization in malignant human lung and cell lines: A suggested role in cell adhesion and cell migration. Am. J. Pathol. 2000;156:939–950. doi: 10.1016/S0002-9440(10)64962-0. [DOI] [PMC free article] [PubMed] [Google Scholar]
- 148.Scimone C., Donato L., Alibrandi S., Vadalà M., Giglia G., Sidoti A., D’Angelo R. N-retinylidene-N-retinylethanolamine adduct induces expression of chronic inflammation cytokines in retinal pigment epithelium cells. Exp. Eye Res. 2021;209:108641. doi: 10.1016/j.exer.2021.108641. [DOI] [PubMed] [Google Scholar]
- 149.Donato L., Abdalla E.M., Scimone C., Alibrandi S., Rinaldi C., Nabil K.M., D’Angelo R., Sidoti A. Impairments of Photoreceptor Outer Segments Renewal and Phototransduction Due to a Peripherin Rare Haplotype Variant: Insights from Molecular Modeling. Int. J. Mol. Sci. 2021;22:3484. doi: 10.3390/ijms22073484. [DOI] [PMC free article] [PubMed] [Google Scholar]
- 150.Murata A., Okuyama K., Sakano S., Kajiki M., Hirata T., Yagita H., Zúñiga-Pflücker J.C., Miyake K., Akashi-Takamura S., Moriwaki S., et al. A Notch ligand, Delta-like 1 functions as an adhesion molecule for mast cells. J. Immunol. 2010;185:3905–3912. doi: 10.4049/jimmunol.1000195. [DOI] [PubMed] [Google Scholar]
- 151.Aga M., Bradley J.M., Wanchu R., Yang Y.F., Acott T.S., Keller K.E. Differential effects of caveolin-1 and -2 knockdown on aqueous outflow and altered extracellular matrix turnover in caveolin-silenced trabecular meshwork cells. Investig. Ophthalmol. Vis. Sci. 2014;55:5497–5509. doi: 10.1167/iovs.14-14519. [DOI] [PMC free article] [PubMed] [Google Scholar]
- 152.Zhang J.P., Li N., Bai W.Z., Qiu X.C., Ma B.A., Zhou Y., Fan Q.Y., Shan L.Q. Notch ligand Delta-like 1 promotes the metastasis of melanoma by enhancing tumor adhesion. Braz. J. Med. Biol. Res. 2014;47:299–306. doi: 10.1590/1414-431X20143368. [DOI] [PMC free article] [PubMed] [Google Scholar]
- 153.Van Sinderen M., Oyanedel J., Menkhorst E., Cuman C., Rainczuk K., Winship A., Salamonsen L., Edgell T., Dimitriadis E. Soluble Delta-like ligand 1 alters human endometrial epithelial cell adhesive capacity. Reprod. Fertil. Dev. 2017;29:694–702. doi: 10.1071/RD15313. [DOI] [PubMed] [Google Scholar]
- 154.Yang P., Yang Y., Sun P., Tian Y., Gao F., Wang C., Zong T., Li M., Zhang Y., Yu T., et al. βII spectrin (SPTBN1): Biological function and clinical potential in cancer and other diseases. Int. J. Biol. Sci. 2021;17:32–49. doi: 10.7150/ijbs.52375. [DOI] [PMC free article] [PubMed] [Google Scholar]
- 155.Wiggs J.L., Kang J.H., Yaspan B.L., Mirel D.B., Laurie C., Crenshaw A., Brodeur W., Gogarten S., Olson L.M., Abdrabou W., et al. Common variants near CAV1 and CAV2 are associated with primary open-angle glaucoma in Caucasians from the USA. Hum. Mol. Genet. 2011;20:4707–4713. doi: 10.1093/hmg/ddr382. [DOI] [PMC free article] [PubMed] [Google Scholar]
- 156.Nelson B.R., Reh T.A. Relationship between Delta-like and proneural bHLH genes during chick retinal development. Dev. Dyn. 2008;237:1565–1580. doi: 10.1002/dvdy.21550. [DOI] [PubMed] [Google Scholar]
- 157.Stone E.M., Lotery A.J., Munier F.L., Héon E., Piguet B., Guymer R.H., Vandenburgh K., Cousin P., Nishimura D., Swiderski R.E., et al. A single EFEMP1 mutation associated with both Malattia Leventinese and Doyne honeycomb retinal dystrophy. Nat. Genet. 1999;22:199–202. doi: 10.1038/9722. [DOI] [PubMed] [Google Scholar]
- 158.Cheng L., Chen C., Guo W., Liu K., Zhao Q., Lu P., Yu F., Xu X. EFEMP1 Overexpression Contributes to Neovascularization in Age-Related Macular Degeneration. Front. Pharmacol. 2020;11:547436. doi: 10.3389/fphar.2020.547436. [DOI] [PMC free article] [PubMed] [Google Scholar]
- 159.Gauthier A.C., Wiggs J.L. Childhood glaucoma genes and phenotypes: Focus on FOXC1 mutations causing anterior segment dysgenesis and hearing loss. Exp. Eye Res. 2020;190:107893. doi: 10.1016/j.exer.2019.107893. [DOI] [PMC free article] [PubMed] [Google Scholar]
- 160.Khaled M.L., Bykhovskaya Y., Yablonski S.E.R., Li H., Drewry M.D., Aboobakar I.F., Estes A., Gao X.R., Stamer W.D., Xu H., et al. Differential Expression of Coding and Long Noncoding RNAs in Keratoconus-Affected Corneas. Investig. Ophthalmol. Vis. Sci. 2018;59:2717–2728. doi: 10.1167/iovs.18-24267. [DOI] [PMC free article] [PubMed] [Google Scholar]
- 161.Su G., Morris J.H., Demchak B., Bader G.D. Biological network exploration with Cytoscape 3. Curr. Protoc. Bioinform. 2014;47:8–13. doi: 10.1002/0471250953.bi0813s47. [DOI] [PMC free article] [PubMed] [Google Scholar]
- 162.Stamer W.D., Seftor R.E., Williams S.K., Samaha H.A., Snyder R.W. Isolation and culture of human trabecular meshwork cells by extracellular matrix digestion. Curr. Eye Res. 1995;14:611–617. doi: 10.3109/02713689508998409. [DOI] [PubMed] [Google Scholar]
- 163.Keller K.E., Bhattacharya S.K., Borrás T., Brunner T.M., Chansangpetch S., Clark A.F., Dismuke W.M., Du Y., Elliott M.H., Ethier C.R., et al. Consensus recommendations for trabecular meshwork cell isolation, characterization and culture. Exp. Eye Res. 2018;171:164–173. doi: 10.1016/j.exer.2018.03.001. [DOI] [PMC free article] [PubMed] [Google Scholar]
- 164.Trapnell C., Pachter L., Salzberg S.L. TopHat: Discovering splice junctions with RNA-Seq. Bioinformatics. 2009;25:1105–1111. doi: 10.1093/bioinformatics/btp120. [DOI] [PMC free article] [PubMed] [Google Scholar]
Associated Data
This section collects any data citations, data availability statements, or supplementary materials included in this article.
Supplementary Materials
Data Availability Statement
The RNA-Seq data is in the process of being deposited into the NCBI GEO database. This will be updated once the deposit is completed with the GEO accession number.