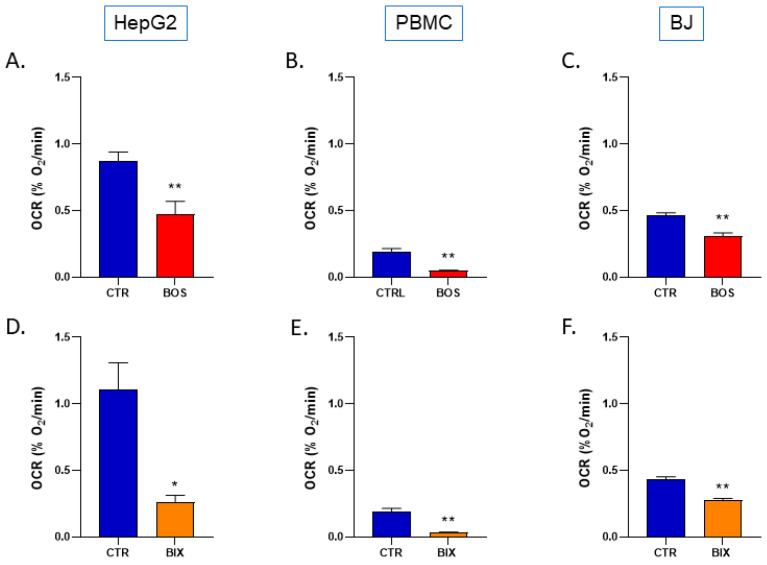
Figure 2.
Oxygen consumption rate of control (DMSO 0.1%) and SDHIs-exposed human cells (1µM for 2 h). Top row: Boscalid-treated cells. (A): HepG2 liver cells, (B): PBMCs, (C): BJ-fibroblasts. Bottom row: Bixafen-treated cells. (D): HepG2 liver cells, (E): PBMCs, (F): BJ-fibroblasts. Bars represent mean ± SEM (%O2/min). N = 3, (*): p < 0.05, (**): p < 0.01.

