Abstract
The measurement of electrical activity across systems of excitable cells underlies current progress in neuroscience, cardiac pharmacology, and neurotechnology. However, bioelectricity spans orders of magnitude in intensity, space, and time, posing substantial technological challenges. The development of methods permitting network-scale recordings with high spatial resolution remains key to studies of electrogenic cells, emergent networks, and bioelectric computation. Here, we demonstrate single-shot and label-free imaging of extracellular potentials with high resolution across a wide field-of-view. The critically coupled waveguide-amplified graphene electric field (CAGE) sensor leverages the field-sensitive optical transitions in graphene to convert electric potentials into the optical regime. As a proof-of-concept, we use the CAGE sensor to detect native electrical activity from cardiac action potentials with tens-of-microns resolution, simultaneously map the propagation of these potentials at tissue-scale, and monitor their modification by pharmacological agents. This platform is robust, scalable, and compatible with existing microscopy techniques for multimodal correlative imaging.
Keywords: graphene, photonics, bioelectricity, electrophysiology, voltage sensing, imaging, microscopy
Graphical Abstract
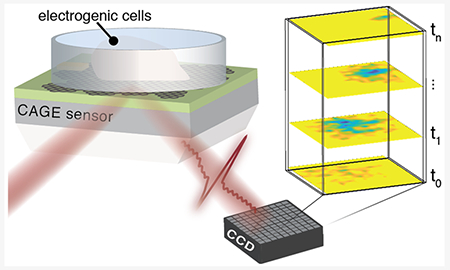
For the past three decades, new technologies that detect electrophysiological signals have driven research spanning medical interventions for cardiac arrhythmias, to connectomics of neuronal networks, to neurotechnologies at the brain–machine interface.1 Traditional semiconductor technologies gave rise to complementary metal-oxide semiconductor multielectrode arrays (MEAs) and field effect transistors that couple to nearby electrophysiological signals.2–6 Robust and mature, high density electrode-based techniques permit recordings over large fields-of-view but require complex circuit design, individual amplification, and are limited by crosstalk and fabrication techniques.7–11 These challenges can be largely circumvented by working in the optical regime where imaging naturally permits highly parallel detection and spatiotemporal resolution. For example, voltage sensitive dyes leverage small-molecule fluorescence to transduce bioelectric signals into optical signals.12–14 By offering both lower cost and compatibility with a wide range of microscopies, voltage sensitive dyes overcome some of the challenges of electrode-based techniques; however, limitations remain from cytotoxicity, photobleaching, nonquantitative readout, and perturbation due to chemo-sensitivity.15 The pursuit of label-free imaging of bioelectric activity has driven a number of novel approaches spanning surface plasmon resonance16 to nitrogen vacancy centers.17 However, these imaging techniques remain limited by low sensitivity and require extended averaging.
In this Letter, we demonstrate that a critically coupled waveguide-amplified graphene electric field (CAGE) sensor18 permits quantitative, label-free, and real time recording of bioelectric signals with tens of micrometers spatial resolution, retaining the advantages of both optical and electrical modalities. The CAGE sensor pairs the unique field-dependent optical absorption of graphene with a critically coupled optical amplification scheme to achieve high-speed voltage sensitivity of microvolts and spatial resolution down to few microns. (Figure 1a,b). In this proof-of-principle, we demonstrate label-free detection of native electrical activity from primary cardiomyocytes and monitor their modification by small molecule inhibitors. Further, we show that the CAGE platform permits spatiotemporally resolved quantitative determination of electrophysiological behavior across electrically active cardiac cells at tissue-scales. Uniquely capable of imaging electric fields in real time, the CAGE sensor enables quantitative imaging of the propagation of bioelectric activity through single shot recordings with continuous high spatial resolution across a large field of view.
Figure 1.
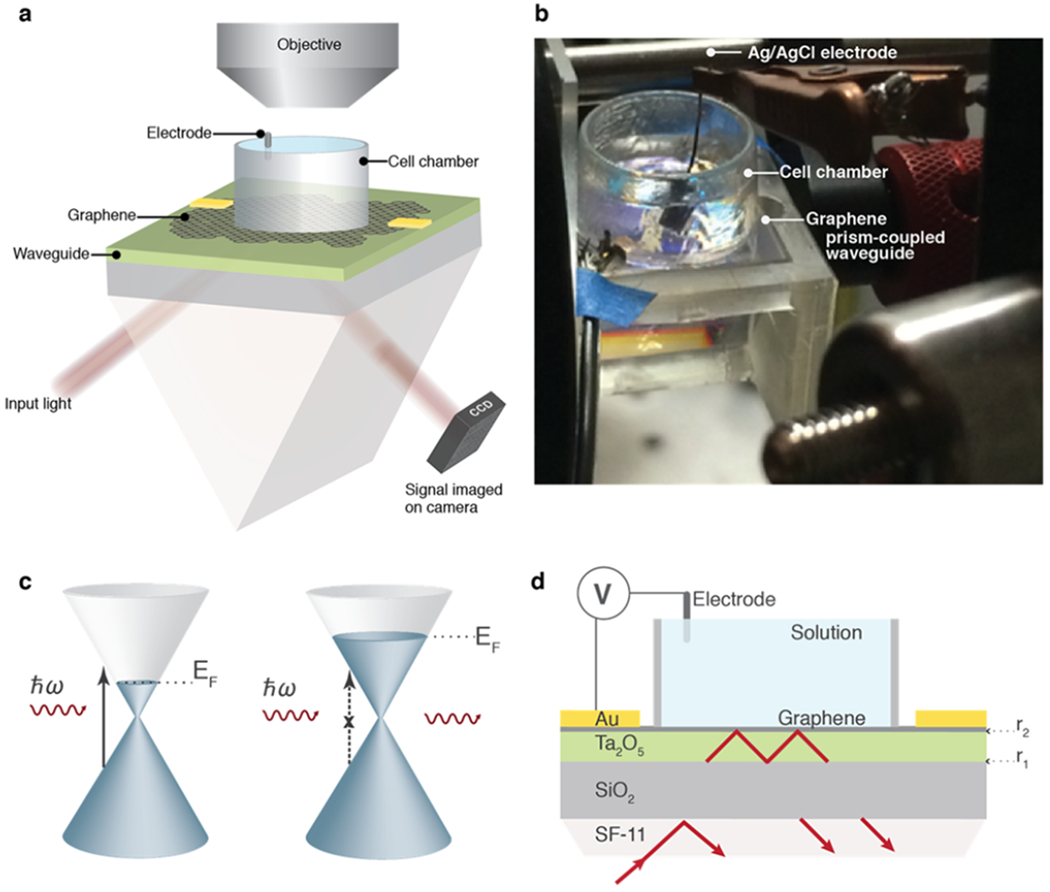
Operating principles of the CAGE platform. (a) Schematic of the critically coupled waveguide-amplified graphene sensor paired with a microscope objective for complementary white light or fluorescence imaging. (b) Optical micrograph of the CAGE sensor. (c) Graphene interband transitions where the Fermi energy of graphene shifts under an electrostatic gate. Optical modulation is strongest near the Fermi surface, where an external field can shift the Fermi energy and prohibit optical absorption due to Pauli blocking. (d) Cross-section of the CAGE imaging sensor. Interfaces r1 and r2 form a cavity with critical coupling modulated by r2.
Atomically thin, monolayer graphene is supremely sensitive to its local environment. In addition, the optical absorption of monolayer graphene can be dramatically modulated by an electrostatic potential, which shifts the Fermi energy and forbids specific optical transitions through the Pauli blocking effect (Figure 1c). While the unique electronic properties of graphene permit an ~1% change in transmitted light under a 200 mV gate voltage,18 several orders of magnitude improvement are necessary to detect extracellular field potentials from electrogenic cells and cell networks.
In our previous work, we demonstrated that by leveraging a critically coupled waveguide amplification scheme, the CAGE sensor realizes over 2 orders of magnitude improvement over graphene’s intrinsic voltage sensitivity.18 The working principle of the device is outlined in Figure 1d. The device is fabricated from a prism-coupled high refractive index planar waveguide coated with large area graphene (Figure 1d). A collimated, s-polarized, 1.55 μm incident beam couples into the transverse electric mode of the slab waveguide at an oblique angle, satisfying the condition for total internal reflection inside the waveguide cavity. The waveguide itself can be described as a Fabry–Perot cavity with reflection , where and are the reflection coefficients at the top and bottom interfaces of the planar waveguide, respectively. The absorption of graphene and the amplitude of are controlled by applying an electrostatic potential from an Ag/AgCl electrode. At critical coupling, , the background reflectivity is minimized (Supporting Information (SI) Figure S4); near critical coupling, the optical modulation per change in local potential is maximized.
The operation of the CAGE sensor is demonstrated in Figure 2. We applied a periodic square waveform through the external Ag/AgCl electrode with peak-to-peak voltages (μVpp) of 500, 200, and 100 μVpp and recorded the optical response with a wide 10 Hz to 10 kHz bandpass filter (Figure 2a,b). During measurement, the device is biased near critical coupling for the highest voltage sensitivity (0.47 V). We observed a 0.32%, 0.13%, and 0.07% relative change in reflectivity under 500, 200, and 100 μVpp voltage modulations, respectively, consistent with the device sensitivity (SI Section V). At 100 μV, the clear modulation has a signal-to-noise ratio (SNR) of ~5 corresponding to a ~20 μV voltage sensitivity, limited by optomechanical and laser source stabilities.
Figure 2.
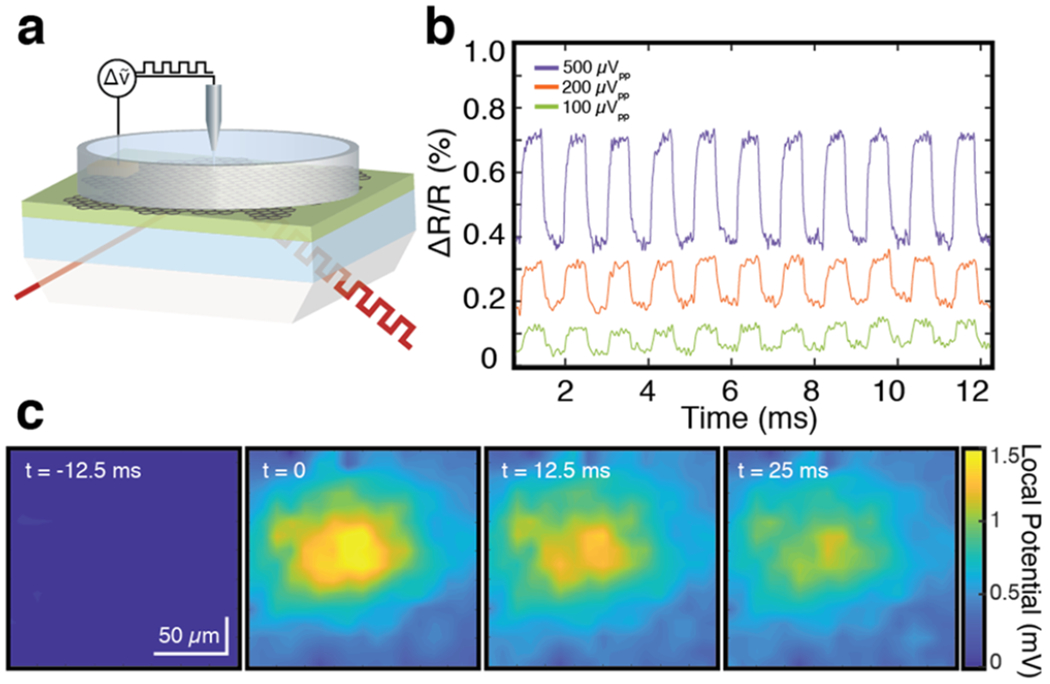
Demonstration of the CAGE working principle. (a) Schematic of the experimental setup in which a periodic square waveform is applied to the external electrode. The CAGE response is read out optically. (b) Optical CAGE detection of (a). Periodic peak-to-peak modulations of 500, 200, and 100 μVpp, are applied with a 10 Hz to 10 kHz bandpass filter. (c) CAGE 2D imaging. The application of a voltage pulse to the microelectrode creates a local electrical field that varies in both space and time. To form this spatially defined local potential distribution, a 10 mVpp 200 ms voltage pulse is applied to a platinum/iridium microelectrode with a 2 μm tip placed in solution 5 μm above the graphene surface of the detector. This spatially distributed electric field is optically captured by the graphene reflectivity. Spatially resolved field images are obtained by projecting the optical signal onto a 2D 80 Hz InGaAs camera. The reflectivity in each image is normalized to a frame without stimulation. Frames are separated by 12.5 ms.
By imaging the optical signal reflected across the continuous sheet of graphene, the CAGE sensor permits the spatiotemporal dynamics of the local field distribution to be directly resolved in real time (Figure 2c). To demonstrate this, we generated a spatially varying local field distribution by applying 10 mV electrical pulse to a platinum/iridium microelectrode with a 2 μm tip radius positioned 5 μm above the sensor at the critical coupling condition. In imaging mode, the spatially resolved reflection is projected with a long working distance near-infrared objective to the image plane of a 2D InGaAs camera with an 80 Hz frame rate. The spatial resolution of the CAGE sensor is ~10 μm, set by the propagation distance of the waveguide (SI Section VI). Under application of a local potential, a region of high optical reflectivity will emerge corresponding to the presence of a positive transient voltage that subsequently dissipates. This behavior is captured by frames 1–4 in Figure 2c. At t = 0, a positive voltage emerges as a region of high optical reflectivity that is spatially coincident with the microelectrode tip. Over the subsequent 25 ms, this local potential diffuses over the imaging field-of-view. The signal across each frame is normalized by a frame without stimulation. These data demonstrate that the critically coupled planar waveguide CAGE sensor enables two-dimensional time-resolved imaging across the entire surface of the waveguide/graphene interface with voltage sensitivity below 20 μV and spatial resolution of ~10 μm and continuously across a wide field-of-view.18
Through quantitative mapping of the local potentials into the optical regime, the CAGE sensor enables real time label-free imaging of extracellular field potentials across native cardiac cells with high spatial resolution. When an electrogenic cell fires an action potential, a local extracellular potential is generated at the position of the cell. At the surface of graphene, this local extracellular potential appears as a local electrostatic gate at the position of the cell, modulating graphene’s optical absorption at the position of the cell in real time. This change in absorption generates a change of reflectivity in the light coupled out of the device and has a one-to-one spatiotemporal correlation to the sample. The bioelectric optical signal is subsequently collected by a single photodiode or imaged by a 2D charge-coupled array (CCD), respectively (SI Section III).
As a proof of principle, we demonstrate this label-free optical detection of local field potentials from primary chicken cardiac tissue (Figure 3a-b). In response to the spontaneous firing of the cardiac cells, the sensor detects a signal with two components: a fast extracellular signal from the action potentials (pulse width ~50 ms) and a slowly varying signal which peaks 500 ms later (Figure 3c). While the former is generated by the local extracellular potential from firing cells, the latter is due to the mechanical contraction of the cardiac cells following the action potentials.
Figure 3.
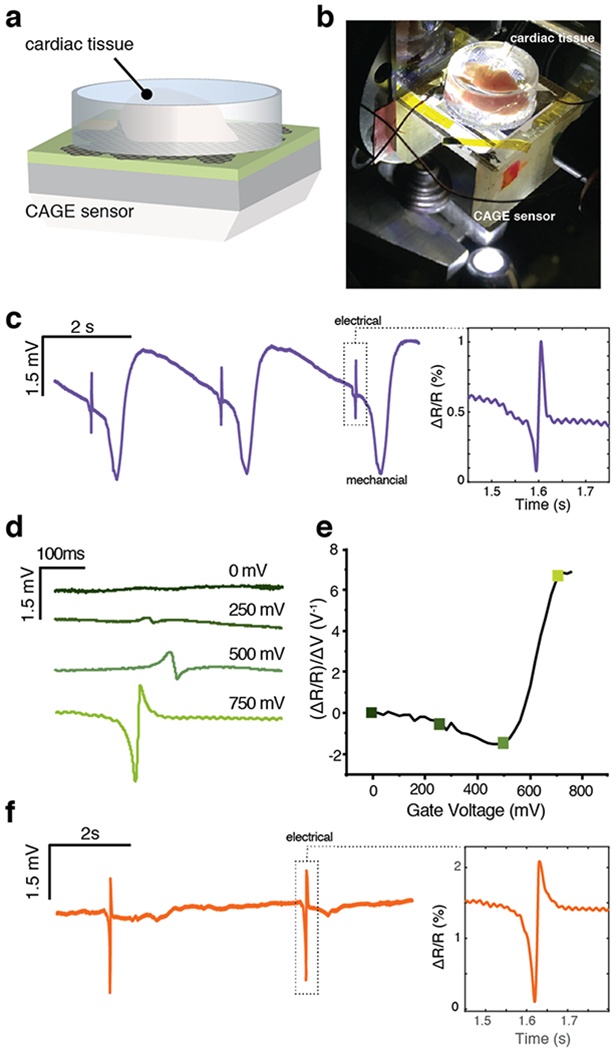
Detection of the extracellular field potentials from primary cardiac tissue. (a) Schematic of the cardiac tissue in the sample chamber above the CAGE sensor. (b) Optical micrograph of the cardiac tissue in the sample chamber above the CAGE sensor. White light illumination from below permits simultaneous white light optical imaging through the objective (out of view). (c) Time traces of the optical response to cardiac tissue beating with well-resolved electrical and mechanical components. Inset: narrow time window around electrical signal. Reflection contrast (ΔR/R) corresponds to an extracellular potential of 1.36 mV. (d) Polarity change in optical response to the extracellular potential with varying graphene gate voltage. (e) The polarity of the detected extracellular potential follows graphene’s responsivity, demonstrating both responsivity to the electrical signal and the high sensitivity achieved with critical coupling. (f) After the measurement in (c), the addition of blebbistatin inhibits the mechanical beating of the cardiac tissue, while the electrical signal remains strong. Inset: narrow time window around electrical signal. Reflection contrast (ΔR/R) corresponds to an extracellular potential of 2.9 mV.
CAGE detection of the mechanical signal has its origins in the sensor’s sensitivity to both local potential and local refractive index. When a cardiomyocyte fires an action potential, the fast electrical impulse also initiates a biochemical cascade that triggers myofilament contraction, inducing cellular motion relative to the detector surface.19 This relative motion modifies the local refractive index at the position of the firing cell and changes the reflectivity of the top interface of the planar waveguide. The resulting perturbation of the critical coupling condition is captured by the CAGE sensor, permitting simultaneous detection of electrical and mechanical signals. As a result, the CAGE detection scheme is uniquely sensitive both to changes in the local electric potential and to modulations of the local refractive index. In the context of cardiomyocytes, the simultaneous measurement of the electrical and mechanical response can address a challenge in quantitatively studying excitation–contraction coupling as a single-shot measurement without requiring correlative methods20,21 and permit readout of real time cardiac responses to pharmacological inputs.
The firing of an action potential produces a well-defined local electric field at the graphene/solution interface, which can be quantitatively measured with the CAGE sensor without labels or dyes (Figure 3c, inset). The optical response to this local electric field is directly dependent on the gating voltage and will quantitatively follow the gate dependence of the CAGE sensor. To demonstrate this phenomenon, we monitor the electrical signal as a function of increasing gate voltage (Figure 3d). With increasing gate voltage, the waveguide approaches the critical coupling condition corresponding to the highest sensitivity to the local field. Far from critical coupling (Vg = 0 mV), the electrical signal is absent from the optical readout (Figure 3d, dark green). The CAGE optical detection resolves the extracellular potential starting at Vg = 250 mV. As the sensor approaches critical coupling, the amplitude of the optical detection of the electrical peak increases dramatically at the maximum sensitivity point, clearly resolving the bioelectric signal. The measured reflection amplitudes of the electrical peak follow the sensitivity curve of the CAGE device (Figure 3e), including the expected change in polarity, underscoring the quantitative nature of this direct optical readout of local potentials. At 750 mV gate voltage, the extracellular potential drives a 0.93% change in reflectivity (ΔR/R) collected by the CAGE detector, which corresponds to an extracellular potential of 1.36 mV (SI Section V). These measurements boast a signal-to-noise ratio of >30 and are in excellent agreement with MEA-recorded signal amplitudes (SI Section XI) and previously reported values22.
Noninvasive and noncytotoxic, the CAGE platform is compatible with small molecule drug delivery and detection. To demonstrate this, we introduced blebbistatin, a small molecule inhibitor of the motor protein responsible for cellular contraction, myosin23 (Figure 3f, SI Section X). Following infusion and incubation with blebbistatin, the optical signal attributed to the mechanical beating is entirely suppressed while the electrical signal retains its intensity. Taken together, these measurements demonstrate that the CAGE sensor can simultaneously detect both the electrical and mechanical signals and permits real time detection of cardiac response to small molecule pharmaceuticals.
Free from raster scanning or time averaging, imaging with the CAGE sensor enables the measurement of the propagation of a cardiac local field potential wave with high resolution across large fields of view (Figure 4). In imaging mode, the spatiotemporal dynamics of local electric fields generated by spontaneously firing cardiomyocytes cause a spatially resolved modulation of graphene’s absorption (Figure 4a), similar to the microelectrode-generated modulation demonstrated in Figure 2. As an action potential propagates between cells, the optical contrast of graphene will propagate with one-to-one correspondence to the electrical signal. This 2D optical signal is amplified by the critically coupled waveguide, directly imaged onto a 2D CCD array, and saved as time-series image stacks as illustrated in Figure 4b.
Figure 4.
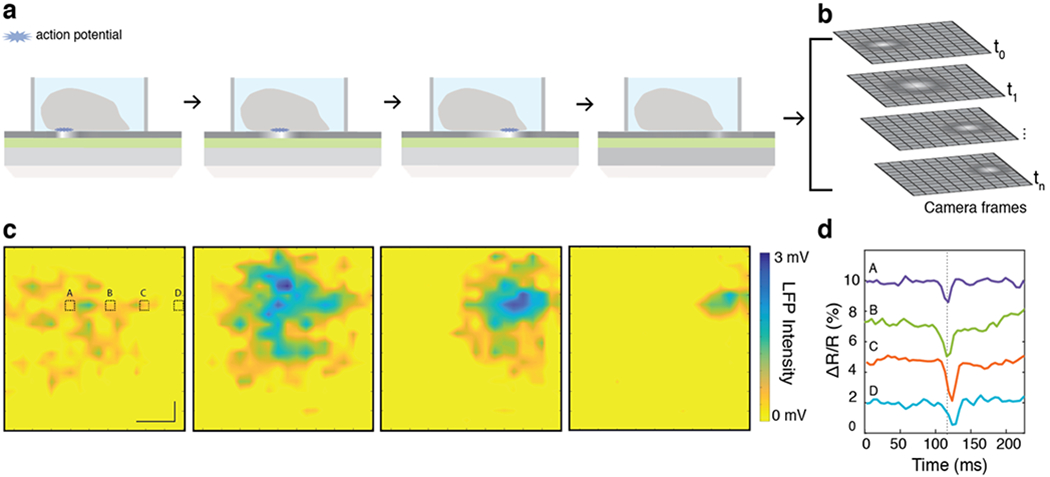
Label-free imaging of the extracellular potential wave. (a) Illustration of the experimental setup. Electrogenic cells or tissue are loaded into the sample chamber. When a cell fires an action potential (blue star), the optical absorption of graphene is locally modulated, resulting in an increase in the light reflected from that spatial position. (b) The response of the graphene sensor surface is imaged onto a 2D array, where time-series data maps the action potential propagation across the network. (c) CAGE imaging data maps the extracellular field potential propagation from spontaneously beating cardiac tissue across an ~2 mm2 field of view. The color axis maps the local field potential from 0 to 3 mV. From sequential frames, the action potential propagation is readily observed moving from left to right across the cardiac tissue. Time lapse between frames = 5 ms. Scale bar = 400 μm. (d) Signals (A–D) from areas outlined in (a) are plotted as time traces and resolve the time-delayed electrical response as it propagates across the tissue. The dashed line serves to guide the eye. Parameters, like the velocity of the signal propagation can be quantitatively determined (here, 14 cm/s, propagating left-to-right).
To demonstrate this, we illuminate a large ~2 mm2 area through the CAGE sensor and image the electro-optical readout onto a 2D InGaAs array with a 186 Hz frame rate (SI Section IV). As the spontaneous action potentials propagate across the cells, graphene’s absorption is locally modulated by the extracellular potential and the increased reflectivity is captured by the CCD camera. This data is plotted as frames of the spatially resolved reflection contrast (ΔR/R) time series (Figure 4c and SI Video). Each frame is normalized by an image taken with no cardiomyocyte activity. The spatial resolution of the CAGE sensor is ~10 μm set by the waveguide propagation distance with a spatio-voltaic resolution down to ~25 μm set by our InGaAs camera array, and the temporal resolution is ~5 ms, set by the frame rate of our InGaAs camera array (SI Sections IV and VI). Higher SNR could be obtained by improving optomechanical and laser stabilities, increasing the charge homogeneity of graphene, and increased temporal resolution in imaging mode could be achieved by using a CCD detector array capable of a higher frame rate and dynamic range.
CAGE image detection enables facile and direct measurement of several important electrophysiological parameters that span spatiotemporal scales. Signals from selected positions or regions of interest can be isolated and plotted as time traces of the local field potentials. To isolate time traces corresponding to cell-sized areas, we bin pixels on the CCD array to correspond to ~50 × 100 μm on the sensor surface (Figure 4d, time traces (a–d) from areas outlined in the first frame of Figure 3c and SI Section VI). Other parameters, like the velocity (speed and direction) of the action potential propagation, can be important to studies of cardiac arrhythmias but difficult to measure directly. With CAGE imaging, we can directly extract the velocity of the action potential propagation across the cells from the arrival time of the electrical pulse to be ~14 cm/s left-to-right, consistent with physiological cardiac action potential propagation velocity24 (Figure S7). Together, these data demonstrate that in addition to the strength and frequency of the electrogenic potentials, dynamic and parallel parameters like the direction and speed of propagating signals across bioelectric cells can be obtained with ease.
In this work, we demonstrate that the CAGE sensor enables scalable, label-free, and high-speed optical imaging of bioelectric potentials across large fields of view with high spatial, temporal, and voltaic resolution, by leveraging the unique optical properties of graphene coupled to a photonic waveguide. Noninvasive and noncytotoxic, the CAGE sensor benefits from the advantages of both electrode array recordings and optical microscopy, without the need for fluorescent tags, chemical labels, or complex circuitry. In contrast to traditional electrode arrays that rely on low-noise electrical amplification, there is no increase in cost or complexity with a large field of view or additional data acquisition. The results presented here demonstrate that the CAGE sensor can image extracellular field potentials, permits real-time 2D imaging of network-scale behavior, and can be compatible with pharmacological research.
Optically transparent and chemically inert, the CAGE sensor easily integrates with complementary measurement techniques such as white light or fluorescence microscopy. Simultaneous bioelectric imaging would enable the correlation of multiple modalities in real-time and with one-to-one correspondence of network-scale behavior with cell-specific spatial resolution. In addition, the CAGE sensor could be built on transparent and flexible substrates for applications spanning flexible devices to electronic skin. These measurements promise new opportunities for correlative studies of bioelectric, biochemical, and biophysical processes. Future applications of the CAGE sensor with these complementary techniques could probe how electrical signaling and spatial organization of electrogenic cells contribute to the formation of cellular networks or how electrical activity emerges during stem cell differentiation.
Supplementary Material
ACKNOWLEDGMENTS
The authors thank Felix Alfonso for helpful discussions and Peter Schmehl for 3D printing resources. This work was funded by the U.S. Department of Energy, Office of Science, Office of Basic Energy Sciences, Materials Sciences and Engineering Division under Contract No. DE-AC02-05-CH11231 Nanomachine program KC1203 (graphene fabrication), the National Institutes of Health (1R01NS121934), and the National Science Foundation Grant DMR-1344302 (optical measurements, simulations, device fabrication). H.B.B. acknowledges support from the NSF Graduate Research Fellowship (Grant DGE 1106400). A.F.M. acknowledges support from a Stanford Bowes Bio-X Graduate Fellowship.
Footnotes
Supporting Information
The Supporting Information is available free of charge at https://pubs.acs.org/doi/10.1021/acs.nanolett.1c00543.
Methods: prism fabrication, sensor design, data acquisition, voltage sensitivity, spatial resolution, data analysis. Biological preparation and measurements: tissue dissection, electrophysiology, contraction decoupling, MEA measurements, gate-dependent measurements, discussion of waveform polarity; additional references (PDF)
Video of frames of from the CAGE sensor capturing the propagation of the action potential wave; plotted as a spatially resolved reflection contrast (ΔR/R) time series (MOV)
The authors declare the following competing financial interest(s): H.B.B., J.H., and F.W. are authors on patent US20180106724A1, for the CAGE sensor, assigned to the University of California.
Complete contact information is available at: https://pubs.acs.org/10.1021/acs.nanolett.1c00543
Contributor Information
Halleh B. Balch, Department of Physics, University of California Berkeley, Berkeley, California 94720, United States; Kavli Energy NanoSciences Institute at the University of California Berkeley and the Lawrence Berkeley National Laboratory, Berkeley, California 94720, United States; Materials Sciences Division, Lawrence Berkeley National Laboratory, Berkeley, California 94720, United States.
Allister F. McGuire, Department of Chemistry, Stanford University, Stanford, California 94305, United States.
Jason Horng, Department of Physics, University of California Berkeley, Berkeley, California 94720, United States; Kavli Energy NanoSciences Institute at the University of California Berkeley and the Lawrence Berkeley National Laboratory, Berkeley, California 94720, United States; Materials Sciences Division, Lawrence Berkeley National Laboratory, Berkeley, California 94720, United States; Present Address: (J.H.) Department of Physics, University of Michigan, Ann Arbor, Michigan 48109, U.S.A..
Hsin-Zon Tsai, Department of Physics, University of California Berkeley, Berkeley, California 94720, United States.
Kevin K. Qi, Department of Physics, University of California Berkeley, Berkeley, California 94720, United States
Yi-Shiou Duh, Department of Physics, University of California Berkeley, Berkeley, California 94720, United States.
Patrick R. Forrester, Department of Physics, University of California Berkeley, Berkeley, California 94720, United States
Michael F. Crommie, Department of Physics, University of California Berkeley, Berkeley, California 94720, United States; Kavli Energy NanoSciences Institute at the University of California Berkeley and the Lawrence Berkeley National Laboratory, Berkeley, California 94720, United States; Materials Sciences Division, Lawrence Berkeley National Laboratory, Berkeley, California 94720, United States.
Bianxiao Cui, Department of Chemistry, Stanford University, Stanford, California 94305, United States.
Feng Wang, Department of Physics, University of California Berkeley, Berkeley, California 94720, United States; Kavli Energy NanoSciences Institute at the University of California Berkeley and the Lawrence Berkeley National Laboratory, Berkeley, California 94720, United States; Materials Sciences Division, Lawrence Berkeley National Laboratory, Berkeley, California 94720, United States.
REFERENCES
- (1).Chiappalone M; Pasquale V; Frega M In Vitro Neuronal Networks From Culturing Methods to Neuro-Technological Applications; Springer International Publishing: Cham, 2019. [Google Scholar]
- (2).Ronchi S; Fiscella M; Marchetti C; Viswam V; Muller J; Frey U; Hierlemann A Single-Cell Electrical Stimulation Using CMOS-Based High-Density Microelectrode Arrays. Front. Neurosci 2019, 13, 208. [DOI] [PMC free article] [PubMed] [Google Scholar]
- (3).Hutzler M; et al. High-Resolution Multitransistor Array Recording of Electrical Field Potentials in Cultured Brain Slices. J. Neurophysiol 2006, 96, 1638–1645. [DOI] [PubMed] [Google Scholar]
- (4).Santoro F; et al. Interfacing Electrogenic Cells with 3D Nanoelectrodes: Position, Shape, and Size Matter. ACS Nano 2014, 8, 6713–6723. [DOI] [PubMed] [Google Scholar]
- (5).Spira ME; Hai A neuroscience and cardiology. Nat. Nanotechnol 2013, 8, 83–94. [DOI] [PubMed] [Google Scholar]
- (6).Abbott J; et al. CMOS nanoelectrode array for all-electrical intracellular electrophysiological imaging. Nat. Nanotechnol 2017, 12, 460–466. [DOI] [PubMed] [Google Scholar]
- (7).Iniewski K CMOS Biomicrosystems: Where Electronics Meet Biology; John Wiley & Sons, 2011. [Google Scholar]
- (8).Abbott J; et al. A nanoelectrode array for obtaining intracellular recordings from thousands of connected neurons. Nature Biomedical Engineering 2020, 4, 232–241. [DOI] [PMC free article] [PubMed] [Google Scholar]
- (9).Zeck G; Jetter F; Channappa L; Bertotti G; Thewes R Electrical imaging: Investigating cellular function at high resolution. Adv. Biosyst. 2017, 1, No. 1700107. [DOI] [PubMed] [Google Scholar]
- (10).Yuan C; Zhou Y; Zhu Y; Liang J; Wang S; Peng S; Li Y; Cheng S; Yang M; Hu J; Zhang B; Zeng R; He J; Li Q Versatile live-cell activity analysis platform for characterization of neuronal dynamics at single-cell and network level. Nat. Commun 2020, 11, 1–14. [DOI] [PMC free article] [PubMed] [Google Scholar]
- (11).Dragas J; et al. A Multi-Functional Microelectrode Array Featuring 59760 Electrodes, 2048 Electrophysiology Channels, Stimulation, Impedance Measurement and Neurotransmitter Detection Channels. IEEE J. Solid-State Circuits 2017, 52, 1576–1590. [DOI] [PMC free article] [PubMed] [Google Scholar]
- (12).Huang Y-L; Walker AS; Miller EW A Photostable Silicon Rhodamine Platform for Optical Voltage Sensing. J. Am. Chem. Soc 2015, 137, 10767–10776. [DOI] [PMC free article] [PubMed] [Google Scholar]
- (13).Vogt N A bright future for voltage imaging. Nat. Methods 2019, 16, 1076–1076. [DOI] [PubMed] [Google Scholar]
- (14).Abdelfattah AS; et al. Bright and photostable chemigenetic indicators for extended in vivo voltage imaging. Science 2019, 365, 699–704. [DOI] [PubMed] [Google Scholar]
- (15).Yang HH; St-Pierre F Genetically Encoded Voltage Indicators: Opportunities and Challenges. J. Neurosci 2016, 36, 9977–9989. [DOI] [PMC free article] [PubMed] [Google Scholar]
- (16).Liu X-W; et al. Plasmonic-Based Electrochemical Impedance Imaging of Electrical Activities in Single Cells. Angew. Chem., Int. Ed 2017, 56, 8855–8859. [DOI] [PMC free article] [PubMed] [Google Scholar]
- (17).Barry JF; et al. Optical magnetic detection of single-neuron action potentials using quantum defects in diamond. Proc. Natl. Acad. Sci. U. S. A 2016, 113, 14133–14138. [DOI] [PMC free article] [PubMed] [Google Scholar]
- (18).Horng J; Balch HB; McGuire AF; Tsai H-Z; Forrester PR; Crommie MF; Cui B; Wang F Imaging electric field dynamics with graphene optoelectronics. Nat. Commun. 2016, 7, 13704. [DOI] [PMC free article] [PubMed] [Google Scholar]
- (19).Bers DM Cardiac excitation-contraction coupling. Nature 2002, 415, 198–205. [DOI] [PubMed] [Google Scholar]
- (20).Pölönen RP; Swan H; Aalto-Setälä K Mutation-specific differences in arrhythmias and drug responses in CPVT patients: simultaneous patch clamp and video imaging of iPSC derived cardiomyocytes. Mol. Biol. Rep 2020, 47, 1067–1077. [DOI] [PubMed] [Google Scholar]
- (21).Rapila R; Korhonen T; Tavi P Excitation-contraction coupling of the mouse embryonic cardiomyocyte. J. Gen. Physiol 2008, 132, 397–405. [DOI] [PMC free article] [PubMed] [Google Scholar]
- (22).Hayes P; Jovicevic Klug M; Toxværd S; Durdaut P; Schell V; Teplyuk A; Burdin D; Winkler A; Weser R; Fetisov Y; Hoft M; Knochel R; McCord J; Quandt E Novel method for action potential measurements from intact cardiac monolayers with multiwell microelectrode array technology. Sci. Rep 2019, 9, 11893. [DOI] [PMC free article] [PubMed] [Google Scholar]
- (23).Kovács M; Tóth J; Hetényi C; Málnási-Csizmadia A; Sellers JR Mechanism of blebbistatin inhibition of myosin II. J. Biol. Chem 2004, 279, 35557–35563. [DOI] [PubMed] [Google Scholar]
- (24).Bressan M; et al. Reciprocal myocardial-endocardial interactions pattern the delay in atrioventricular junction conduction. Development 2014, 141, 4149–4157. [DOI] [PMC free article] [PubMed] [Google Scholar]
Associated Data
This section collects any data citations, data availability statements, or supplementary materials included in this article.


