

ABSTRACT
The effect of hydrophobicity on antibody aggregation is well understood, and it has been shown that charge calculations can be useful for high-concentration viscosity and pharmacokinetic (PK) clearance predictions. In this work, structure-based charge descriptors are evaluated for their predictive performance on recently published antibody pI, viscosity, and clearance data. From this, we devised four rules for therapeutic antibody profiling which address developability issues arising from hydrophobicity and charged-based solution behavior, PK, and the ability to enrich for those that are approved by the U.S. Food and Drug Administration. Differences in strategy for optimizing the solution behavior of human IgG1 antibodies versus the IgG2 and IgG4 isotypes and the impact of pH alterations in formulation are discussed.
KEYWORDS: Structure-based, antibody, developability, aggregation, viscosity, isoelectric point, clearance, pharmacokinetics, biophysical property prediction
Introduction
Substantial efforts to avoid developability risks are now more often being made during the candidate discovery, engineering, and lead optimization phases of biotherapeutic development. Several small-scale biophysical and cell-based assays are now available as surrogates for late-stage development issues such as aggregation, viscosity, polyspecificity, and thermostability.1 Antibody discovery groups are more commonly performing such tests to help select lead antibody candidates and optimize them for improved biophysical properties. In fact, a broad range of experimental methods to assess the many facets of developability for antibody drug candidates are under continuous development, and more experimental data has become publicly available.1,2
The results of the developability experiments, whose underlying driver is hydrophobicity of the molecular surfaces, such as hydrophobic interaction chromatography (HIC), cross interaction chromatography (CIC), size exclusion chromatography (SEC), aggregation, and solubility, often correlate strongly with one another and are coarsely predictable by computational methods.3 The general trend observed in these studies is that increasing the concentration of hydrophobic patch surface area at the complementarity-determining region (CDR) generally leads to decreasing developability for the antibody drug candidates.4–8
Charge is another important property, as it has been shown that charge descriptors can be used to predict high-concentration viscosity and can sometimes play a role in aggregation. The impact of charge change mutations on optimizing viscosity is well summarized by Apgar et al.,9 who provide viscosity measurements for 38 IgG1 variants and compare various viscosity prediction methods. It has generally been observed that removing negatively charged residues or adding positively charged residues to the CDRs can reduce viscosity for IgG1 antibodies and this most recent dataset is consistent with that observation, as a clear trend is seen where the higher the Fv charge, the lower the viscosity.9–13 The methods developed for computational viscosity prediction in these studies generally demonstrate this same premise. For example, Agrawal et al.13 devised the spatial charge map (SCM), which showed that having larger negatively charged patches on the CDRs leads to higher viscosity. The SCM score is calculated using the atom forcefield charges, and the greater the extent of the negatively charged patches on the Fv molecular surface, the greater the predicted viscosity. Sharma et al.11 also illustrated with a simple Fv charge calculation that the more negative the charge, the higher the viscosity. In addition, the authors comment that more intricate charge analysis may be needed to predict viscosity, as their charge symmetry parameter, FvCSP, can improve the prediction. FvCSP represents the similarity in the net charge states between the VL and VH and it correlates to viscosity likely since charge asymmetry in the Fv creates self-complementing attractive forces. FvCSP improves the viscosity prediction when used in conjunction with Fv charge in a multi-parameter regression model. Tomar et al.14 built multi-parameter scoring functions for viscosity and Apgar et al.9 illustrated that all of the methods above are predictive for viscosity to varying degrees for IgG1 mAbs. A recent study of the viscosity and colloidal stability of 59 diverse mAbs indicates that those with higher charge and pI values exhibit better solution behavior and reduced viscosity.15 Lastly, Lai et al.16 published viscosity measurements for 27 antibodies for which both the net charge and SCM methods were demonstrated to be predictive in a manner similar to that in the reports mentioned above. The authors also devised a decision tree viscosity predictor applying mAb net charge and the overrepresentation of hydrophilic residues.
Charge can also have an effect on pharmacokinetic (PK) clearance. It has been observed that charge-mediated interactions impair FcRn release and that extremes in Fv charge and high-hydrophobicity can be used to filter antibodies having short half-lives in cynomolgus monkeys while a similar finding has also recently been reported for antibodies in humans.11,17,18 In summary, there is substantial evidence for reducing CDR surface hydrophobicity to improve developability and a growing number of examples demonstrating that avoiding negative charge on the CDR surface for IgG1 antibodies, as well as extremes in charge, can be beneficial for viscosity and PK, respectively.
Computational therapeutic antibody profiling (TAP) was recently performed by Raybould et al.19 who identified five rules derived from descriptors for clinical-stage therapeutic antibodies (CSTs), two of which enrich for CSTs versus arbitrary human antibodies. In this work, a revised set of rules is introduced which combines elements from the five TAP rules together with observed correlations to developability experiments. The names of the CSTs included in the analysis and the calculated results of the revised rules are available in supplementary Table 1.
Results
Antibody pI calculations
pI values determined by imaged capillary isoelectric focusing (icIEF) for 23 CSTs were published in 2017.20 Full-length antibody models were created for 22 of these for which the full sequences were provided and their pI values were calculated by three different methods: a sequence-based method (pI_seq), the PROPKA 3D method (pI_3D), and by forcefield charge (ens_pI).21 The models were sampled for sidechain conformations and protonation states over a pH value range from 4.4 to 10.4. The pI_3D descriptor was calculated by averaging the PROPKA based pI_3D values over this ensemble of 300 conformations, and the ens_pI descriptor is calculated by determining the pH at which the forcefield charge (ens_charge) of the full antibody model is zero on average, after sampling conformations and protonation states over the range of pH values. The correlations between the predictions and the experiments are shown in Figure 1(a,b). The pI_seq and pI_3D descriptors have equally high Pearson correlations (0.97, matching the performance of the pI calculations performed in the work), but pI_3D has a lower standard error (0.07 in exp_pI units). It is important to note that this set of antibodies has variations in the constant region, and it is crucial that they are modeled in order to generate accurate pI predictions. For this reason, modeling the Fv or antigen-binding fragment (Fab) alone was not sufficient for making absolute or relative pI predictions in this case, and modeling the full-length antibody tetramer was needed.
Figure 1.
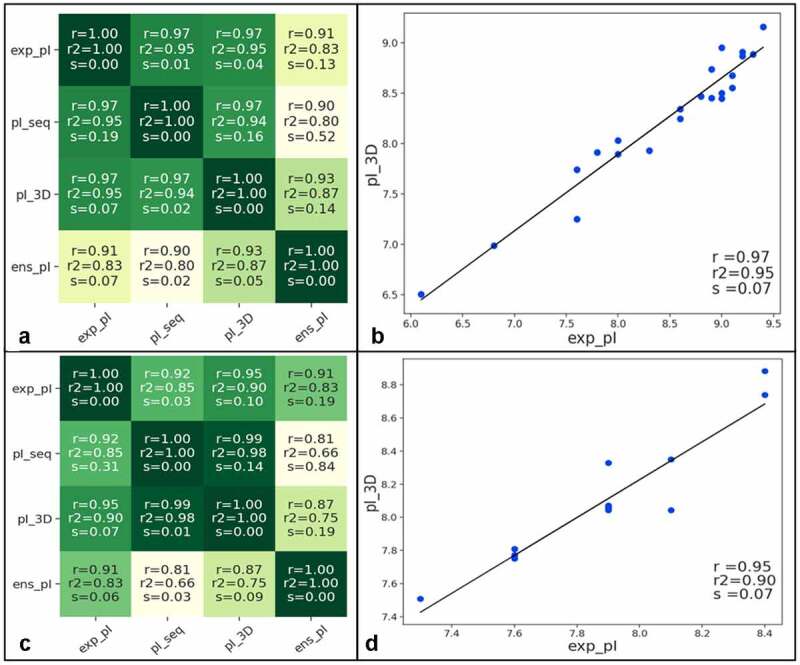
(a) Correlation matrix of experimental pI values with three different pI calculations for 22 CSTs (r is the Pearson correlation and s is the standard error). (b) Scatter plot of the relationship between the pI_3D predictions and the experimental pI values.20 (c) Correlation matrix of experimental pI values with three different pI calculations for 17 related IgG4 antibodies. (d) Scatter plot of the relationship between the pI_3D prediction and the experimental pI values.3 The lines drawn on the scatter plots are the result of a least-squares polynomial fit
HzATNP is a humanized anti-trinitrophenyl IgG4 antibody that forms large amounts of aggregates upon storage, and thus was optimized for improved developability.3,22 In addition to developability experiments such as HIC and CIC, pI measurements are also provided in the work. We created full-length antibody models for the 17 IgG4 antibodies studied and the correlations between the pI values and predictions are shown in Figure 1(c,d). The pI_3D descriptor has the highest correlation (r = 0.95) and a relatively low standard error (s = 0.07).
Antibody viscosity calculations
An antibody viscosity dataset containing 38 variants of an IgG1 antibody, with viscosity data in the form of concentration (mg/mL) that leads to a viscosity of 20 cP, has recently been made available.9 The variable domains of each antibody were modeled and various 3D descriptors were calculated. The ens_charge descriptor has the highest correlation to the viscosity measurements, with a Pearson coefficient of 0.72. A scatter plot of this relationship is shown in Figure 2; the ens_charge calculated on Fv models at neutral pH is henceforth called ens_charge_Fv. The correlation illustrates that distinct charge change mutants form two clusters where those in the lower charge group have more severe viscosity, but there is no correlation within the two individual groups. The relationship between ens_charge_Fv and the viscosity measurements is similar to that of the predictions described by Apgar et al.9 including SCM, and the viscosity predictions from Sharma et al.11 and Tomar et al.14 The patch_cdr_pos and pI_3D descriptors also have a similar correlation to these predictions. The experiments were performed at pH 5.8, and there is no improvement to the correlation when ens_charge_Fv is calculated at pH 5.8 (rather than the default pH of 7.4). This dataset can be classified by the ens_charge_Fv descriptor with 87% overall accuracy if 102 mg/mL is used as the cutoff for viscosity at 20 cP (see Table 1). Well-behaved variants have an ens_charge_Fv of +2 or higher, therefore, having a more positively charged variable domain is critical for improved viscosity for these 38 IgG1 variants.
Figure 2.
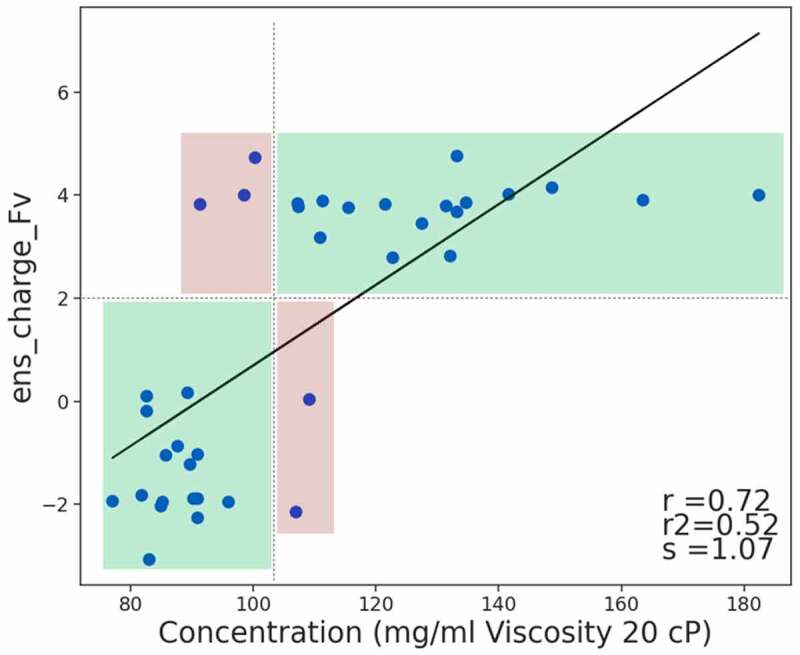
Relationship between the Fv charge (ens_charge_Fv) and viscosity measurements of 38 IgG1 antibody variants.9 Using a cutoff of +2 for ens_charge_Fv, correct prediction zones are colored green and false predictions in red if 102 mg/mL is used as the cutoff for viscosity at 20 cP. There is an overall correlation (Pearson coefficient of 0.72), however, the data separates into two distinct clusters within each of which there is no correlation
Table 1.
Confusion matrix and accuracy of ens_charge_Fv viscosity classification
| Viscosity 20 cP > 102 mg/ml | True pos | True neg | All |
|---|---|---|---|
| Pred. pos/non-viscous | 17 | 3 | |
| Pred. neg/viscous | 2 | 16 | |
| Accuracy | 89% | 84% | 87% |
Using a cutoff of 102 mg/ml at 20 cP, 19 antibodies fall in the non-viscous category (true pos), 17 of which are correctly predicted by ens_charge_Fv. 16 of the 19 viscous antibodies are correctly predicted as true negatives, giving an overall accuracy of 87%.
Viscosity measurements for an additional 27 antibodies approved by the U.S. Food and Drug Administration (FDA) have recently been published.16 This dataset consists of 21 IgG1, four IgG2, and two IgG4 antibodies with viscosity measurements at several concentrations for each. In this study, the Fv region of each antibody was modeled and the ens_charge_Fv was calculated and compared to the viscosity (cP) reported at 150 mg/ml. Once again, the lower the ens_charge_Fv, the more viscous the antibody, with a Pearson coefficient of 0.55. Furthermore, removing the IgG2 and IgG4 antibodies improves the correlation to 0.63 (see Figure 3), since two of the non-IgG1 antibodies have low viscosity despite having a neutral Fv region. The cutoff of +2 for ens_charge_Fv established within the example above eliminates 2 of the 5 highly viscous antibodies (40%) while retaining 15 of the 16 non-viscous antibodies (94%). The correlation reported in Figure 3, having an r2 value of 0.40, is the lowest deemed to be significant in this work, and contains relatively few (21) datapoints. A two-tailed paired t-test on this relationship returns a p-value of 0.0085 and the leave-one-out cross-validation r2 is 0.21. The data corresponding to Figures 2 and 3 is provided in supplementary Tables 2 and 3, respectively.
Figure 3.

Relationship between the Fv charge (ens_charge_Fv) and viscosity measurements at 150 mg/mL for 21 FDA-approved IgG1 antibodies.16
Antibody PK predictions
Kraft et al.17 proposed heparin as a surrogate for highly negatively charged glycocalyx components on endothelial cells and heparin chromatography as a method to measure potential pinocytotic uptake and degradation. The authors provided heparin retention times in minutes for 130 antibodies which, in this study, were modeled in similar fashion to the viscosity datasets above. The ens_charge_Fv descriptor correlates to the heparin retention times with a Pearson coefficient of 0.72 (see Figure 4) where the higher the charge, the longer the retention time in the negatively charged heparin lined column.
Figure 4.
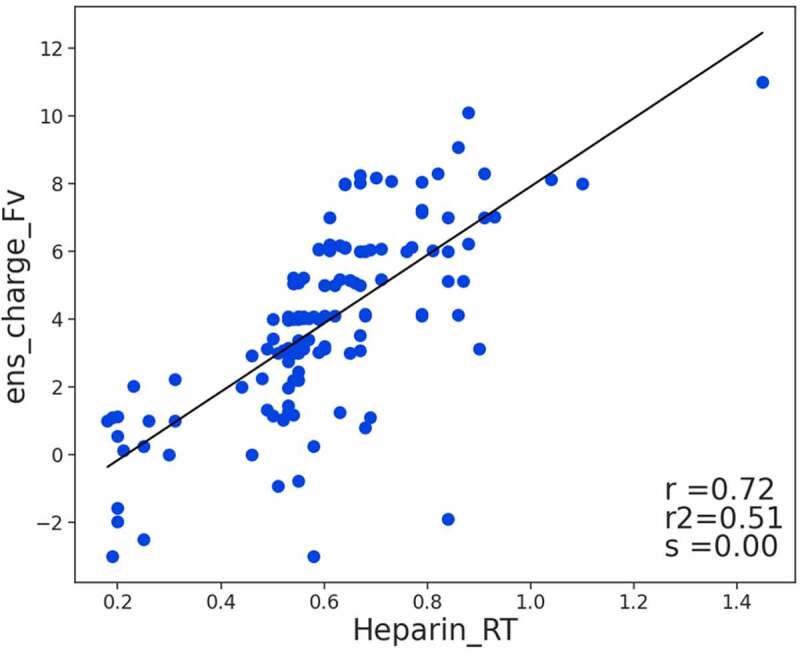
Relationship between the Fv charge (ens_charge_Fv) of 130 antibodies and their heparin chromatography retention times
The clearance values of 64 CSTs in humans were calculated and recently published by Grinshpun et al.18 In that study, the Fv domains were modeled and 3D properties were calculated for each in similar fashion to the datasets presented here. The calculated property with the highest linear correlation to the data is pI_3D, with a Pearson coefficient of 0.32. The pI_3D descriptor alone is able to modestly enrich for slow versus fast clearance if a cutoff window of 6.7 to 9.05 is applied. These cutoffs retain 66% of the antibodies while retaining 85% of those that are slow-clearing (less than 2.5 mL/d/Kg) and only 38% of the fast-clearing (more than 5.4 mL/d/Kg) antibodies. The patch_cdr_hyd descriptor is able to filter out an additional fast-clearing antibody with the cutoff set to 530 A2 and retains 100% of the slow-clearing antibodies. If both descriptors are used simultaneously with these cutoffs, 75% of the antibodies are retained, including 85% of the slow-clearing antibodies and only 31% of those that clear faster than 5.4 mL/d/Kg. The confusion matrix for this prediction is shown in Table 2, where a 67% overall accuracy is observed for the classification of slow versus normal clearance.
Table 2.
Accuracy of slow clearance classification using pI_3D and patch_cdr_hyd
| Clearance ≤ 5.4 mL/d/Kg | True pos | True neg | All |
|---|---|---|---|
| Pred. pos/normal | 32 | 5 | |
| Pred. neg/fast | 16 | 11 | |
| Accuracy | 67% | 69% | 67% |
Using a cutoff of 5.4 mL/d/Kg, 48 antibodies fall in the normal clearance category (true pos), 32 of which are correctly predicted by the pI_3D and patch_cdr_hyd cutoffs. 11 of the 16 fast-clearing antibodies (> 5.4 mL/d/Kg) are correctly predicted as true negatives, giving an overall accuracy of 67%.
Antibody CST profiling
A total of 629 CSTs available from the Therapeutic Structural Antibody Database (Thera-SAbDab) at the time of this work were modeled.23 The patch_cdr_hyd, ens_charge_Fv, and the CDR length (cdr_len) descriptors were used to profile the CSTs. This covers hydrophobicity, charge, and size in similar fashion to the TAP rules from Raybould et al.19 but the patches of positive charge (PPC) and negative charge (PNC) are replaced by ens_charge_Fv since ens_charge_Fv is a single parameter shown to correlate to viscosity measurements and because it is strongly correlated to pI_3D, which has proven useful for distinguishing antibodies with better PK.18
The fifth TAP rule is based on charge separation using a descriptor called SFvCSP, which takes the product of the individual VL and VH surface charges. It is a structural surface-adapted version of FvCSP that has been shown to correlate to viscosity measurements, and it has a similar correlation to ens_charge_Fv (Pearson coefficient of 0.63, values available in supplementary Table 1).11 However, there are detrimental effects associated with taking the product of the VL charge and the VH charge to calculate charge separation. For example, two antibodies with large differences in VL and VH charge separation can have the same value when multiplying the VL and VH charges together: a value of +9 could either be from an antibody with a VL charge of +1 and VH charge of +9 or from an antibody with VL and VH charges both being +3. Furthermore, an antibody with a neutral VL charge of zero and a VH charge of −9 would result in a value of zero, even though the antibody arguably has a high level of VL VH charge separation and would be expected to have poor solution behavior. Instead, charge separation in this work is calculated by taking the difference between the VH and VL charges, or “Fv charge heavy minus light” (Fv_chml = VH charge – VL charge). A large positive value means that the VH has a much more positive charge than the VL and a large negative value means that the VL has a much more positive charge than the VH. The Fv_chml, which will be used as the fourth profiling rule, correlates to the viscosity data from Apgar et al.9 and Lai et al.16 with Pearson coefficients of 0.61 and 0.37, respectively (data not shown). In both cases, the higher the value representing charge separation, the more severe the viscosity.
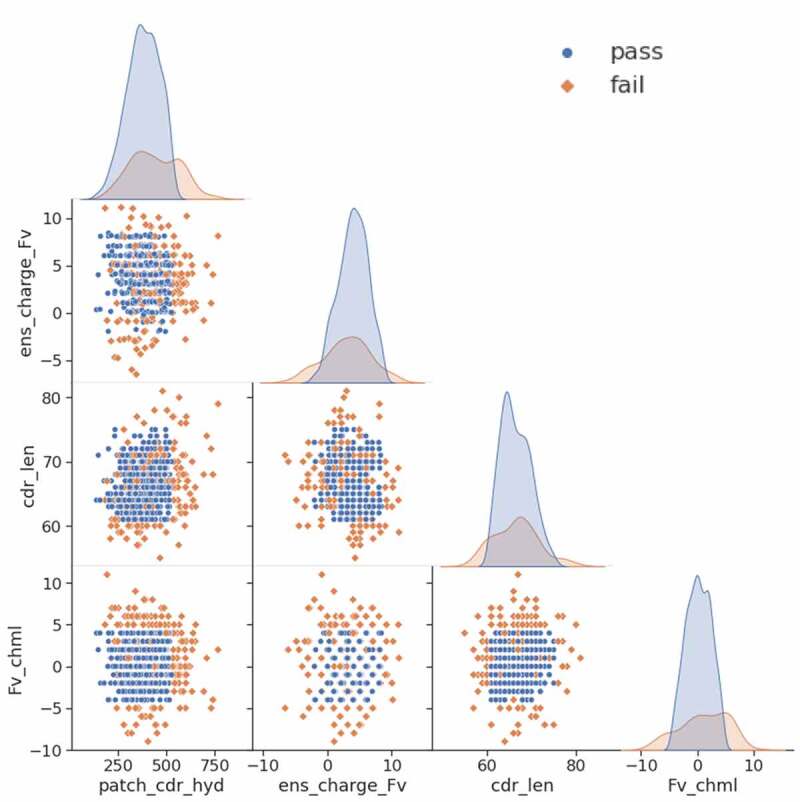
As shown in Table 3, 114 of the 629 CSTs have been approved by the FDA (18.1%). For patch_cdr_hyd, a cutoff of 530 Å2 is applied, since that value was useful with human PK data, which filters roughly 10% of the candidates. A second rule using an ens_charge_Fv range from −2.5 to 8.5 is used, which filters about 5% of the CSTs. Using a cdr_len window from 61 to 75 filters 41 antibodies of which only five have been approved. For Fv_chml charge separation, a window from −4 to +4 is used, which filters out 83 antibodies, only 11 of which are approved, and this represents the best enrichment for approved antibodies of the four rules. If the cutoffs of all four rules are applied, only 25 of the 184 antibodies that break at least one rule are approved (13.6%), while 18.1% of the overall set of 629 antibodies are approved. Therefore, an antibody that breaks one of the rules is less likely to fall in the approved subset. As shown in Figure 5, the four descriptors do not correlate to one another and each of them has a distribution where proportionately fewer approved antibodies lie at the tails of their distributions. The overlapping distributions in Figure 6 demonstrate visually the number of CSTs each rule filters out.
Table 3.
Data corresponding to the four proposed CST profiling rules
| Set | # CSTs which pass | approved |
|---|---|---|
| All CSTs | 629 | 114 (18.1%) |
| patch_cdr_hyd ≤ 530 | 569 | 106 (18.6%) |
| −2.5 ≤ ens_charge_Fv ≤ 8.5 | 595 | 109 (18.3%) |
| 61 ≤ cdr_len ≤ 75 | 588 | 109 (18.5%) |
| −4 ≤ Fv_chml ≤ 4 | 546 | 103 (18.9%) |
| Pass all 4 rules | 445 | 89 (20.0%) |
| Don’t pass all 4 rules | 184 | 25 (13.6%) |
Of the 629 CSTs modeled, 114 were approved by the FDA as of April 2021. The Fv_chml rule filters the most antibodies and has the highest enrichment for FDA approval. Of the 184 CSTs that fail at least one of the four rules, only 25 have been approved.
Figure 5.
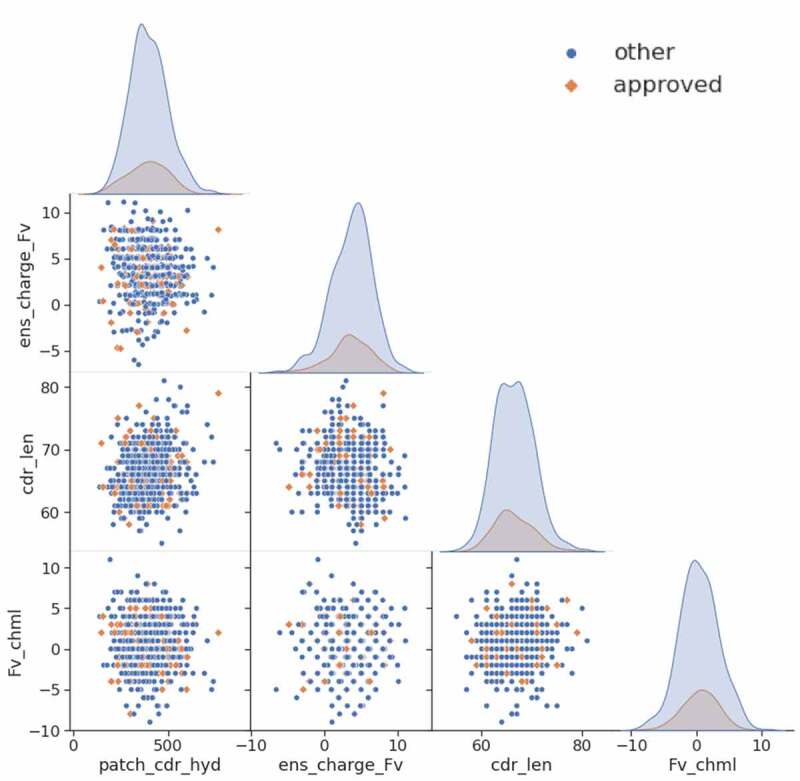
Matrix of scatter plots and distributions of the four proposed CST profiling rules. 629 CSTs are included; FDA-approved products are colored orange while those at any other clinical-stage are colored blue
Figure 6.
Matrix of scatter plots and distributions of the four proposed CST profiling rules. 629 CSTs are included and those which pass all four rules are colored blue while those which fail at least one rule are colored orange
mAb isotype charge differences
The majority of published data for aggregation, viscosity, and PK pertains to antibodies expressed as the human IgG1 isotype. In order to determine if concepts learned from such data can be transferred across isotypes, it is important to understand the charge differences of the constant regions of IgG1, IgG2, and IgG4. For this, full-length antibody models were built and domain net charges were calculated by taking the forcefield charge of the atoms comprising the region, protonated at pH 7, the results of which are summarized in Table 4.
Table 4.
The net charges of the constant domains for human IgG isotypes
| IgG1 | IgG2 | IgG4 | |
|---|---|---|---|
| Constant region | +4 | −6 | −6 |
| CH1 | +4 (+2 x2) | −2 (−1 x2) | 0 |
| Hinge | −2 (−1 x2) | 0 | 0 |
| Fc | +2 (+1 x2) | −4 (−2 x2) | −6 (−3 x2) |
The constant region is made up of the CH1 domains, hinge regions, and Fc domain, which itself consists of the CH2 and CH3 domains.
The constant region of IgG1 is positively charged, whereas the constant regions of IgG2 and IgG4 are negatively charged. The positive charge on the IgG1 constant region is the result of a + 2 charge on each CH1 domain for a total charge of +4. The IgG2 scaffold gets its negative charge from the CH1 domains and the Fc domain while IgG4 has neutral CH1 domains and a substantially negative Fc domain. The charge of the Fv varies depending on the antibody's germline and on the epitope targeted by the CDRs. The median IgG1 ens_charge_Fv of the 629 CSTs is +4, which is similar to the charge on the C1 domains, preventing the creation of a strong intramolecular dipole. The median ens_charge_Fv of the IgG2 and IgG4 CSTs are +4 and +3, respectively. The N-termini contribute +2 to the ens_charge_Fv, forming a substantial portion of the positive charge observed on the Fv region. Likewise, the C-termini of the light chains contribute a charge of −1 to each C1 domain and the C-termini of the heavy chains contribute a charge of −2 to the Fc domains. The charges mapped onto the 3D models are shown in Figure 7.
Figure 7.
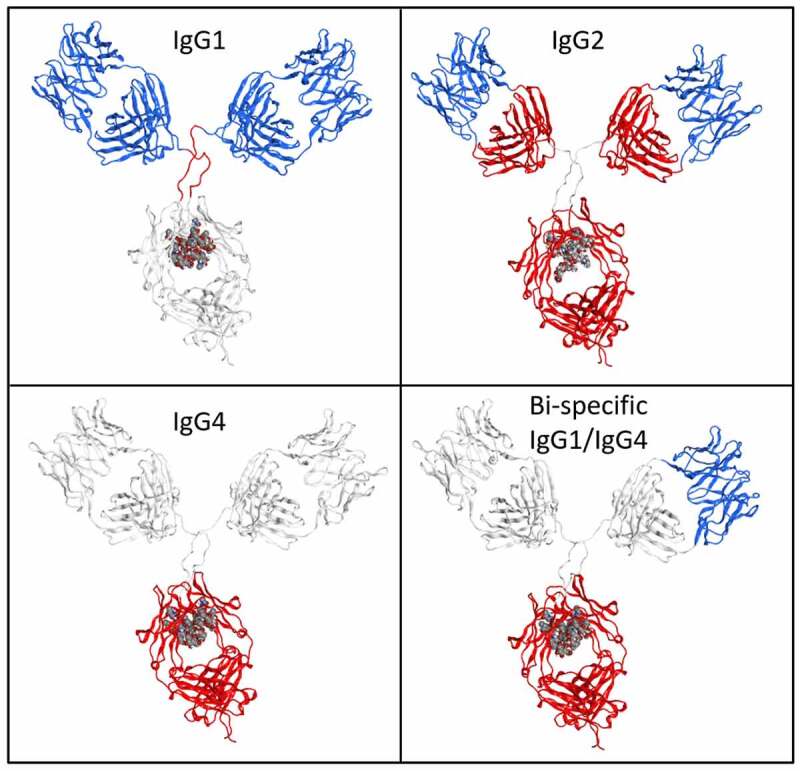
Full-length models of human IgG1, IgG2, IgG4 and a bispecific antibody. The IgG1 antibody binds to IL-17, the IgG4 antibody binds to IL-13 and the bispecific construct contains the anti-IL-13 IgG4 antibody with one of its Fv domains replaced by that from the anti-IL-17 IgG1 antibody. Positively charge regions are blue, neutral regions are white, and negatively charged regions are red
Tilegenova et al.24 reported that when combining an anti-IL-13 IgG4 antibody and an anti-IL-17 IgG1 antibody, each having good solution behavior in terms of viscosity, into a bispecific construct where the Fv domain from the IgG1 antibody is grafted in place of one Fv domain of the IgG4 antibody, the resulting bispecific antibody exhibits severe viscosity (also shown in Figure 7). This result is an indication that positive charge requirements for the Fv domain may apply only to IgG1 antibodies, since grafting a positively charged Fv in place of a neutral Fv resulted in an increased viscosity for this IgG4 antibody.
When investigating the four properties identified for profiling by isotype, no major differences in the medians of the property values between IgG1, IgG2, and IgG4 antibodies are observed (supplementary Table 4). This is expected because the values are obtained on Fv models, and the majority of the differences among isotypes are found on the constant region. Of the 629 CSTs studied, 85% belong to the kappa light chain subclass; therefore, the rules we derived contain bias for kappa antibodies. The lambda subset of antibodies have a median cdr_len of 69, which is three residues more than that of the kappa subclass, and this likely arises from the shorter CDR 1 commonly present in VK germlines. The lambda antibodies have a median ens_charge_Fv of +2.4, and patch_cdr_hyd of 441 Å2, while the respective medians for kappa antibodies are +4.0 and 382 Å2. Therefore, the lambda antibodies generally have more hydrophobic surface area and less positive charge on the Fv than the kappa antibodies. The nearest matching VH germline family was determined for each of the 629 CSTs by identifying the family of the human germline sequence with the highest amino acid identity for the framework region, excluding the CDRs. The three most prominent VH germline families are IGVH1-69, IGHV3-66, and IGVH3-23, and their median deviations for the four properties from the overall dataset is smaller than that observed for the lambda subset (data summarized in supplementary Table 1, and in supplementary Figures 1 and 2).
Discussion
Our results demonstrate that sequence and structure-based pI calculations can accurately predict experimental values for human IgG1 and IgG4 antibodies. If there are mutations in the constant region, then incorporating these regions of the sequence/structure, rather than using Fv alone, is required for relative pI calculations, and if full-length sequences/models are used, accurate absolute pI value predictions can be made. The pI_3D descriptor, which is structure-based, has the highest correlation to the experimental measurements, but its correlation is not significantly higher than that of the sequence-based method tested. We also observe that calculating pI by titrating and sampling homology model conformations using a forcefield and implicit solvent model to determine the pH at which the protein is neutral (has an average forcefield charge of zero) delivers accurate predictions on recently published antibody pI data. The results do not suggest that this method is preferred over established sequence and structure-based methods for calculating pI, rather, they provide evidence that the method produces accurate charge calculations on antibodies.
The ens_charge_Fv descriptor is predictive of viscosity for two independent sets of IgG1 antibodies, where the lower the ens_charge_Fv, the higher the viscosity. This single value parameter describing the charge of the Fv is as predictive for the set of 38 antibodies as the multi-parameter models tested in the study.9,11,14 The SCM parameter is also a single descriptor with similar performance to ens_charge_Fv on this data and on the more recent set of 21 IgG1 antibodies.13,16 The six non-IgG1 antibodies were removed from the Lai et al.16 dataset in Figure 3 because the constant region is not being modeled and because they make up only a small portion of the data. On the IgG1 Fv models, ens_charge_Fv has a similar performance to SCM and to the net charges calculated by Lai et al.16 using PROPKA. The authors also trained a decision tree classifier model applying mAb net charge and the overrepresentation of hydrophilic residues on the Fv to accurately classify the 27 mixed isotype antibodies for viscosity. They tested this decision tree classifier on the Apgar et al.9 set and the best accuracy reported at three concentrations is 87%, which is similar to the result we obtain using a single descriptor, ens_charge_Fv, with a cutoff of +2 and without the need to model the full Ig tetramer. Therefore, ens_charge_Fv can serve as a coarse predictor of IgG1 mAb viscosity, while a more elaborate model, such as that proposed by Lai et al.16 is needed when working with other isotypes or formats.
Sharma et al.11 reported their viscosity predictions using the Fv charge calculated at pH 5.5 in order to match experimental conditions. When calculating ens_charge_Fv, lowering the pH from the neutral default to the experimental pH generally shifts the charge values higher and does not improve the predictions on the Apgar et al.9 dataset or the Lai et al.16 dataset. There is therefore likely no need to adjust the pH setting when such calculations are performed unless it is shown in a validation that such an adjustment improves the prediction. Another ambiguity is whether the N-terminal backbone charges are included: having pKa values ranging from just above 7 up to 9, they are generally positively charged at neutral and lower pH values and including them in the calculation shifts the resulting charges up by two units. Therefore, ens_charge_Fv does generally include the +2 resulting from the charged N-terminal backbone amine groups and this effect alone represents about half of the median +4 positive charge that is needed on the IgG1 Fv domain to prevent high viscosity. The C-termini are amidated and capped with methyl groups in order to represent peptide bonds to the hypothetical continuation of the protein chains and eliminate the spurious negative charges of the unrealistic C-termini resulting from cleaving the C1 domains from the Fv. The N and C-termini do not necessarily cancel out since the charge of a chemical moiety depends both on the pH and the 3D environment. Although the N-termini generally add two charge units, there are exceptions where the N-terminal backbone amine group can be neutralized by a nearby positive charge, and this effect should be incorporated into the models to best represent the structure for net charge and pI calculations. Likewise, histidines do not have constant charges since their imidazole groups have protonation states that also vary considerably depending on pH and 3D environment. The sampling method used in this work accounts for these effects and it should be made clear how such groups are dealt with during antibody modeling and charge calculations. This subtlety, however, does not necessarily need to be modeled for broad predictive performance, as we do not observe that doing so improves results for the datasets studied.
In terms of PK, ens_charge_Fv correlates to the heparin chromatography retention times; therefore, antibodies with an extremely high value for ens_charge_Fv have a high likelihood of undergoing pinocytotic uptake and degradation. Using a human clearance dataset consisting of 64 antibodies, restricting the pI_3D to a window from 6.7 to 9.05 for the Fv models was shown to modestly select for fast-clearing antibodies and retain slow-clearing antibodies.18 A patch_cdr_hyd cutoff off 530 Å2 retains all slow-clearing antibodies and filters out three fast-clearing antibodies. This confirms that extremes in hydrophobicity and charge are to be avoided in order to reduce the likelihood of having poor PK. These cutoffs are more sensitive than those applied for the viscosity prediction accuracy, as one can see from the scatter plot in Grinshpun et al.’s Figure 6(c)18 that small changes in the cutoffs will affect the accuracy. In short, the computational clearance predictions are less reliable, but are nonetheless useful if applied carefully and provide further evidence justifying the use of Fv charge and hydrophobicity descriptors in antibody profiling. pI_3D correlates strongly to ens_charge_Fv (Pearson r ~ 0.97), and pI_3D cutoffs of 6.7 and 9.05 roughly correspond to ens_charge_Fv cutoffs of 3 and 7. However, since many approved CSTs have ens_charge_Fv values lower than 3, the cutoff used for the rule was lowered to −2.5. It should be noted that experimental methods can often provide more useful information. For example, the polyspecificity reagent binding assay was shown to provide better enrichment for normal human clearance than any computational descriptor and the computational predictions described are only 67% accurate and have cutoffs applied that are sensitive to small changes.18 It was also reported that experimental diffusion interaction parameter measurements are predictive for antibody viscosity, while the computed TAP parameters were not helpful for predicting solution behavior.15,16
Four CST profiling rules derived from the patch_cdr_hyd, ens_charge_Fv, cdr_len, and Fv_chml descriptors are proposed. cdr_len was shown to separate CSTs from a large set of human antibody sequences, but since PPC and PNC do not appear to distinguish CSTs from that set of arbitrary antibodies and since there appears to be limited evidence of their consistent utility in predicting solution behavior, there is rationale to replace them with ens_charge_Fv.19 patch_cdr_hyd and ens_charge_Fv are included because they are useful for aggregation, solution behavior, and PK predictions; however, other useful parameters such as SAP, CamSOL, SCM or validated charge and pI calculators could potentially serve as substitutes.5,7,13 SFvCSP (and FvCSP) has been shown to be predictive for viscosity, but it correlates to the ens_charge_Fv descriptor, which already accounts for viscosity risk.11 Also, certain inconsistencies arise from taking the product of the VL and VH charges, therefore it is justified to take the difference between the VH and VL charge (Fv_chml) and use it as the fourth rule, especially since Fv_chml provides the best enrichment for FDA-approved CSTs. Each rule individually still only provides a trace preference for approved antibodies but, when taken together, they provide a modest enrichment. patch_cdr_hyd is likely the most important descriptor, due to its consistent role in aggregation, chromatography behavior, and PK. Given that patch_cdr_hyd and ens_charge_Fv do not provide a strong enrichment for approved CSTs, it would appear that a number of antibodies with relatively poor biophysical properties have been approved by the FDA.
At neutral pH, the median VH charge of the 629 CSTs is +3 and the median VL charge is +2 (data not shown) and, as can be seen in Figure 5, the Fv_chml follows a normal distribution with most of the approved antibodies falling between −4 and +4. In this respect, there is no apparent regular charge separation observed between the VL and VH domains of CSTs. Interestingly, there is a general charge separation observed within the CDRs of the 629 CSTs: when annotated using the Kabat scheme, the light chain CDRs have a median CDR charge of +1 while the heavy chain CDRs have a median charge of −1. However, when annotating using the Kabat scheme, CDR H2 and CDR H3 both have a conserved arginine adjacently connected in the sequence, and this alone adds two units to the VH CDR charge and cancels out the observed CDR charge separation. Furthermore, when annotating with the IMGT scheme, the adjacent Arg residue actually becomes part of the CDR H3, and eliminates the perceived charge separation. Authors should therefore be cautious when reporting CDR-specific findings and provide precise details. patch_cdr_hyd applies the CCG annotation scheme, but is averaged over a conformational ensemble and is not sensitive to the CDR definition used.
It is possible during formulation to mitigate non-ideal biophysical properties. When a negatively charged Fv is used with a positively charged IgG1 Fc, lowering the storage pH neutralizes the Fv domain, which circumvents the dipole creation and leads to improved solution behavior. Lowering the formulation pH can likewise neutralize the negatively charged Fc of IgG2 and IgG4 making it possible for those isotypes to tolerate positively charged Fv domains.24,25 However, aggregation-prone antibodies having undesirable hydrophobic and/or charged binding epitopes present a greater risk for fast clearance and immunogenicity.26 Therefore, there is rationale for selecting candidates that pass the CST profiling rules and for optimizing them toward passing the rules. If an IgG1 scaffold will be used, it would be best if the Fv domain were positively charged, and with relatively lower hydrophobicity and CDR length. IgG2 and IgG4 CSTs have median ens_charge_Fv values of +4 and +3, respectively, but their constant regions are negatively charged at neutral pH. Two of the six IgG2/IgG4 antibodies reported had acceptable viscosity despite having a lower charge (neutral) Fv domains, and it has been shown that an IgG4 antibody with a neutral Fv exhibits low viscosity, but becomes viscous when a positively charged Fv is grafted.16,24 Therefore, it could be possible that IgG2 and IgG4 antibodies are safer with neutral or negatively charged Fv regions or, if negatively charged Fv domains appear in the antibodies from target affinity screening, a strategy could be to use IgG2 or IgG4 as the scaffold to prevent dipole induced poor solution behavior, but more work is needed to verify this. In addition to formulation pH alterations, various buffers or excipients can also serve to mitigate poor biophysical properties. The methods presented for property calculations apply an implicit solvent model that can be tuned for a specific pH or salt concentration, but cannot explicitly model excipients. The results provide a possible explanation for the pH-dependent solution behavior of mAbs, but thus far these methods have not been evaluated for their ability to predict biophysical properties measured experimentally at different pH values or salt concentrations.
The number of FDA-approved antibodies will continue increasing, as will the overall number of CSTs. With 114 antibodies already approved to date, we do not expect major changes to their property profiles in the near future, but the cutoffs used to enrich for approved antibodies may need adjusting as more CSTs are approved. With respect to isotypes, more clinical data and full antibody modeling are likely needed in order to perform isotype-specific profiling, as Fv model profiling does not capture isotype differences. One can expect an increase in patch_cdr_hyd and cdr_len values when working with lambda antibodies, while the VH germline family appears to play a smaller role. However, a potential strategy could be to avoid germlines that lead to more hydrophobic Fv models. Overall, we believe that there is sufficient data to use predictive performance on experiments and the ability to enrich for antibodies that have progressed further in the clinic when determining CST profiling rules. The four rules proposed here describe the antibodies in terms of Fv hydrophobicity, charge, CDR length, and charge separation and are justified for coarse filtering of candidates because of their usefulness in reducing aggregation, viscosity and clearance, as well as their ability to modestly enrich for FDA-approved antibodies, all while not correlating to one another. Only a modest enrichment is expected because approved CSTs are not easily distinguished from other candidates that have been optimized for improved biophysical properties and because some antibodies with relatively poor biophysical properties have been approved by the FDA. Of course, an antibody not passing these rules can still be approved by the FDA; therefore, it is not advised to apply them as completely rigid filters. Instead, they can be used to create awareness of the risk associated with an antibody that falls outside them, thereby potentially avoiding expensive bioprocessing and formulation methods that might later be required.
Materials and methods
CST data preparation
The entire Thera-SAbDab dataset,23 consisting of 651 antibodies, was downloaded in April 2021. Mouse, canine, feline and single-domain antibodies were removed, as were nanobodies. This resulted in a set of 629 therapeutics predominantly composed of whole mAbs but also containing antibody-drug conjugates, scFvs, Fabs, bispecifics and some fusion formats. In the case of bispecifics, only the first Fv sequence was used. Of the 629 CSTs, 114 have been approved by the FDA, 22 have had license applications submitted after completing late-stage clinical trials, and the remaining antibodies have entered Phase 1, 2, or 3 clinical studies.
Antibody homology model generation
Homology models of the variable regions of the antibodies for all datasets were created using the Antibody Modeler application in MOE 2020.0901.27 Using the method described by Maier & Labute,28 a homology search of the antibodies in the Protein Data Bank was performed to identify the best matching framework and CDR templates for both chains. These were grafted together to produce high-quality chimeric templates for homology modeling. On average, the chimeric light chain template percent amino acid identity for the 629 CSTs was 95%, and that for the chimeric heavy chain templates was 91% (93% overall), all having 100% coverage due to the fact that they are chimeric templates resulting from CDR grafting. Fv sequences were input to the Antibody Modeler, which was run in seq mode, guaranteeing that the sequence of the model contains the entire variable domain, including capping groups that neutralize the Fv C-termini. In the case of the pI calculations, full antibody models were generated using the Ig mode of the Antibody Modeler application, whereby the Fv domain is built as described above and the constant region is modeled from a solvated MD snapshot of the 1HZH structure for IgG1, and the 5DK3 structure for IgG4.
Property calculations on 3D models
The descriptors were calculated using the Protein Properties application of MOE 2020.0901 with the Sample feature toggled on. This produced 100 conformations of each model where the framework is restrained and sidechains are free to move using LowModeMD and alternate protonation states are sampled from pH 6.4 to 8.4 (centered at pH 7.4) using the Protonate 3D method.29,30 The conformational sampling applies tethers to the backbone atoms allowing 0.25 Å of free movement for the framework, 1 Å of free movement for the canonical CDRs, and 2 Å of free movement for the CDR H3 backbone, while sidechains are unrestricted. This scheme is designed to help compensate for the error common in antibody modeling. Hydrophobic patches consist of regions where a hydrophobic potential equal to or greater than that of a methyl group persists over a surface area greater than 50 Å2. The hydrophobic potential is determined using the SLogP method for each atom and mapping the result onto the surface. The patch_cdr_hyd descriptor is the sum of the surface areas of the hydrophobic patches involving at least one CDR atom as annotated by the CCG CDR definitions, averaged over the 100 samples using a Boltzmann weight centered at the target pH of the calculation (7.4). Taking the 38 antibody Fv models of the Apgar et al.9 dataset as an example, the standard deviation of patch_cdr_hyd within the 100 samples, on average, is 95 Å2. Charged patches are formed where there is excess forcefield charge (Amber10:EHT) sustained over a surface area of 40 Å2 and both the patch_cdr_pos and patch_cdr_neg descriptors are calculated in similar fashion to patch_cdr_hyd. The pI_seq descriptor is the sequence-based pI as described by Ribeiro et al.31 and the pI_3D descriptor is calculated using the PROPKA method to determine residue pKa values which are then used in the sequence-based pI formula mentioned above.21 The ens_pI descriptor is obtained by calculating the forcefield charge (ens_charge) of conformations over a range of pH values and determining the pH where the average ens_charge is zero. ens_charge_Fv is calculated at neutral pH and is the forcefield charge averaged over an ensemble of 100 conformations modeled at pH 6.4 to 8.4. These descriptors were calculated on Fv models generated with the Antibody Modeler in MOE 2020.0901 having both C-termini amidated and capped with a methyl group to neutralize the effect of producing spurious negative charges from clipping the Fv domain from the full structure. Within the ensembles generated, the standard deviation of ens_charge_Fv for each antibody is, on average, 0.93, as calculated for the Apgar et al.9 dataset. We have determined that 100 samples is adequate for ensuring that correlations to experiments are reproducible when modeling Fv regions on different OS and chipsets. Furthermore, taking a random n = 50 subset of the 100 samples was found to reproduce the results. More samples may be needed to ensure reproducibility when working with larger structures. The cdr_len descriptor is the total number of CDR residues when annotating the antibody sequences with the CCG scheme, which is identical to the Kabat scheme except for CDR H1, which includes five additional residues in the N-terminal direction. The Fv_chml descriptor takes the forcefield charge of the VH minus the forcefield charge of the VL applied to the original antibody Fv models generated at pH 7 without use of the conformational ensembles.
Supplementary Material
Acknowledgments
The authors would like to thank Matthew I. J. Raybould and the Oxford Protein Informatics Group for providing additional details about the Therapeutic Structural Antibody Database.
Funding Statement
The author(s) reported there is no funding associated with the work featured in this article.
Abbreviations and symbols
| Å | Angstrom |
| CCG | Chemical Computing Group |
| cdr_len | Total number of CDR residues annotated with CCG scheme |
| CIC | Cross interaction chromatography |
| cP | Centipoise |
| CST | Clinical-stage therapeutic antibody |
| ens_charge_Fv | Forcefield charge of the Fv averaged on a structural ensemble |
| Fv | Fragment, variable domain of the antibody |
| Fc | Fragment, crystalizable domain of the antibody |
| FcRn | Neonatal Fc receptor |
| FvCSP | Charge separation between light and heavy chain of the Fv |
| Fv_chml | Fv charge heavy minus light |
| HIC | Hydrophobic interaction chromatography |
| MD | Molecular Dynamics |
| patch_cdr_hyd | Surface area of the hydrophobic patches near the CDRs |
| pI | Isoelectric point |
| pI_3D | Structure-based isoelectric point descriptor |
| PK | Pharmacokinetics |
| PPC | Patches of positive charge |
| PPN | Patches of negative charge |
| SCM | Spatial charge map |
| SEC | Size exclusion chromatography |
| TAP | Therapeutic antibody profiler |
| VH | Heavy chain portion of the Fv |
| VK | Kappa light chain portion of the Fv |
| VL | Light chain portion of the Fv |
Disclosure statement
No potential conflict of interest was reported by the author(s).
Supplementary material
Supplemental data for this article can be accessed on the publisher’s website
References
- 1.Jarasch A, Koll H, Regula JT, Bader M, Papadimitriou A, Kettenberger H.. Developability assessment during the selection of novel therapeutic antibodies. J Pharm Sci. 2015;104(6):1885–11. doi: 10.1002/jps.24430. [DOI] [PubMed] [Google Scholar]
- 2.Jain T, Sun T, Durand S, Hall A, Houston NR, Nett JH, Sharkey B, Bobrowicz B, Caffry I, Yu Y, et al. Biophysical properties of the clinical-stage antibody landscape. Proc Natl Acad Sci. 2017;114(5):944–49. doi: 10.1073/pnas.1616408114. [DOI] [PMC free article] [PubMed] [Google Scholar]
- 3.Wolf Pérez AM, Sormanni P, Andersen JS, Sakhnini LI, Rodriguez-Leon I, Bjelke JR, Gajhede AJ, De Maria L, Otzen DE, Vendruscolo M, et al. In vitro and in silico assessment of the developability of a designed monoclonal antibody library. mAbs. 2019;11(2):388–400. doi: 10.1080/19420862.2018.1556082. [DOI] [PMC free article] [PubMed] [Google Scholar]
- 4.Salgado JC, Rapaport I, Asenjo JA. Predicting the behavior of proteins in hydrophobic interaction chromatography 1: using the hydrophobic inbalance (HI) to describe their surface amino acid distribution. J Chromatography A. 2006;1107:110–19. doi: 10.1016/j.chroma.2005.12.032. [DOI] [PubMed] [Google Scholar]
- 5.Chennamsetty N, Voynov V, Kayser V, Helk B, Trout BL. Design of therapeutic proteins with enhanced stability. Proc Natl Acad Sci. 2009;106:11937–42. doi: 10.1073/pnas.0904191106. [DOI] [PMC free article] [PubMed] [Google Scholar]
- 6.Sankar S, Krystek SR Jr., Carl SM, Day T, Maier JKX. Prediction of aggregation-prone regions in proteins based on the distribution of surface patches. Proteins. 2018;86(11):1147–56. doi: 10.1002/prot.25594. [DOI] [PubMed] [Google Scholar]
- 7.Sormanni P, Aprile FA, Vendruscolo M. The CamSol method of rational design of protein mutants with enhanced solubility. J Mol Biol. 2015;427(2):478–90. doi: 10.1016/j.jmb.2014.09.026. [DOI] [PubMed] [Google Scholar]
- 8.Jetha A, Thorsteinson N, Jmeian Y, Jeganathan A, Giblin P, Fransson J. Homology modeling and structure-based design improve hydrophobic interaction chromatography behavior of integrin binding antibodies. mAbs. 2018;10(2):890–900. doi: 10.1080/19420862.2018.1475871. [DOI] [PMC free article] [PubMed] [Google Scholar]
- 9.Apgar JR, Tam ASP, Sorm R, Moesta S, King AC, Kelleher K, Murphy D, Yan G, Zhong X, Rodriguez L, et al. Modeling and mitigation of high-concentration antibody viscosity through structure-based computer-aided protein design. PLOS ONE. 2020;15(5):e0232713. doi: 10.1371/journal.pone.0232713. [DOI] [PMC free article] [PubMed] [Google Scholar]
- 10.Yadav S, Shire JS, Kalonia DS. Factors affecting the viscosity in high concentration solutions of different monoclonal antibodies. J Pharm Sci. 2010;99(3):1152–68. doi: 10.1002/jps.21898. [DOI] [PubMed] [Google Scholar]
- 11.Sharma VK, Patapoff TW, Kabakoff B, Pai S, Hilario E, Zhang B, Li C, Borisov O, Kelley RF, Chorny I, et al. In silico selection of therapeutic antibodies for development: viscosity, clearance, and chemical stability. PNAS. 2014;111(52):18601–06. doi: 10.1073/pnas.1421779112. [DOI] [PMC free article] [PubMed] [Google Scholar]
- 12.Nichols P, Li L, Kumar S, Buck P, Singh SK, Goswami S, Balthazor B, Conley TR, Sek D, Allen MJ. Rational design of viscosity reducing mutants of a monoclonal antibody: hydrophobic versus electrostatic inter-molecular interactions. mAbs. 2015;7(1):212–30. doi: 10.4161/19420862.2014.985504. [DOI] [PMC free article] [PubMed] [Google Scholar]
- 13.Agrawal NJ, Helk B, Kumar S, Mody N, Sathish HA, Samra HS, Buck PM, Li L, Trout BL. Computational tool for the early screening of monoclonal antibodies for their viscosities. mAbs. 2016;8(1):43–48. doi: 10.1080/19420862.2015.1099773. [DOI] [PMC free article] [PubMed] [Google Scholar]
- 14.Tomar DS, Li L, Broulidakis MP, Luksha NG, Burns CT, Singh SK, Kumar S. In-silico prediction of concentration-dependent viscosity curves for monoclonal antibody solutions. mAbs. 2017;9(3):476–89. doi: 10.1080/19420862.2017.1285479. [DOI] [PMC free article] [PubMed] [Google Scholar]
- 15.Kingsbury JS, Saini A, Auclair SM, Fu L, Lantz MM, Halloran KT, Calero-Rubio C, Schwenger W, Airiau CY, Zhang J, et al. A single molecular descriptor to predict solution behavior of therapeutic antibodies. Sci Adv. 2020;6(32):eabb0372. doi: 10.1126/sciadv.abb0372. [DOI] [PMC free article] [PubMed] [Google Scholar]
- 16.Lai PK, Fernando A, Cloutier TK, Gokam Y, Zhang J, Schwenger W, Chari R, Calero-Rubio C, Trout BL. Machine learning applied to determine the molecular descriptors responsible for the viscosity behavior of concentrated therapeutic antibodies. Mol Pharmaceutics. 2021;18(3):1167–75. doi: 10.1021/acs.molpharmaceut.0c01073. [DOI] [PubMed] [Google Scholar]
- 17.Kraft TE, Richter WF, Emrich T, Knaupp A, Schuster M, Wolfert A, Kettenberger H. Heparin chromatography as an in vitro predictor for antibody clearance rate through pinocytosis. MAbs. 2020;12(1):1683432. doi: 10.1080/19420862.2019.1683432. [DOI] [PMC free article] [PubMed] [Google Scholar]
- 18.Grinshpun B, Thorsteinson N, Pereira JNS, Rippmann F, Nanneman D, Sood V, Nanfack YF. Identifying biophysical assays and in silico properties that enrich for slow clearance in clinical-stage therapeutic antibodies. MAbs. 2021;13(1):1932230. doi: 10.1080/19420862.2021.1932230. [DOI] [PMC free article] [PubMed] [Google Scholar]
- 19.Raybould MIJ, Marks C, Krawczuk K, Taddese B, Nowak J, Lewis AP, Bujotzek A, Shi J, Deane CM. Five computational developability guidelines for therapeutic antibody profiling. PNAS. 2019;116(10):4025–30. doi: 10.1073/pnas.1810576116. [DOI] [PMC free article] [PubMed] [Google Scholar]
- 20.Goyon A, Excoffier M, Janin-Bussat MC, Bobaly B, Fekete S, Guillaume D, Beck A. Determination of isoelectric points and relative charge variants of 23 therapeutic monoclonal antibodies. J Chromatogr B Anal Technol Biomed Life Sci. 2017;1065-66:119–28. doi: 10.1016/j.jchromb.2017.09.033. [DOI] [PubMed] [Google Scholar]
- 21.Li H, Robertson AD, Jensen JH. Very fast empirical prediction and rationalization of protein pKa values. Proteins. 2005;61:704–21. doi: 10.1002/prot.20660. [DOI] [PubMed] [Google Scholar]
- 22.Neergaard MS, Kalonia DA, Parshad H, Nielsen AD, Møller EH, van der Weert M. Viscosity of high concentration protein formulations of monoclonal antibodies of the IgG1 and IgG4 subclass - prediction of viscosity through protein-protein interaction measurements. Eur J Pharm Sci. 2013;49(3):400–10. doi: 10.1016/j.ejps.2013.04.019. [DOI] [PubMed] [Google Scholar]
- 23.Raybould MIJ, Marks C, Lewis AP, Shi J, Bujotzek A, Taddese B, Deane CM. Thera-SAbDab: the therapeutic structural antibody database. Nucleic Acids Res. 2020;48(D1):gkz827. doi: 10.1093/nar/gkz827. [DOI] [PMC free article] [PubMed] [Google Scholar]
- 24.Tilegenova C, Izadi S, Yin J, Huang CS, Wu J, Ellerman D, Hymowitz SG, Walters B, Salisbury C, Carter PJ. Dissecting the molecular basis of high viscosity of monospecific and bispecific IgG antibodies. MAbs. 2020;12(1):1692764. doi: 10.1080/19420862.2019.1692764. [DOI] [PMC free article] [PubMed] [Google Scholar]
- 25.Heads JT, Lamb R, Kelm S, Adams R, Elliott P, Tyson K, Topia S, West S, Nan R, Turner A, et al. Electrostatic interactions modulate the differential aggregation propensities of IgG1 and IgG4P antibodies and inform charged residue substitutions for improved developability. PEDS. 2019;32:277–88. [DOI] [PMC free article] [PubMed] [Google Scholar]
- 26.Dyson MR, Masters E, Pazeraitis D, Perera RL, Syrjanen JL, Surade S, Thorsteinson N, Parthiban K, Jones PC, Sattar M, et al. Beyond affinity: selection of antibody variants with optimal biophysical properties and reduced immunogenicity from mammalian display libraries. mAbs. 2020;12(1):1829335. doi: 10.1080/19420862.2020.1829335. [DOI] [PMC free article] [PubMed] [Google Scholar]
- 27.Chemical Computing Group ULC . Montreal (QC): Molecular Operating Environment (MOE); 2019. [Google Scholar]
- 28.Maier JKX, Labute P. Assessment of fully automated antibody homology modeling protocols in molecular operating environment. Proteins. 2014;82:1599–610. doi: 10.1002/prot.24576. [DOI] [PMC free article] [PubMed] [Google Scholar]
- 29.Labute P. LowModeMD—implicit low-mode velocity filtering applied to conformational search of macrocycles and protein loops. J Chem Inf Model. 2010;50:792–800. doi: 10.1021/ci900508k. [DOI] [PubMed] [Google Scholar]
- 30.Labute P. Protonate3D: assignment of ionization states and hydrogen coordinates to macromolecular structures. Proteins. 2009;75(1):187–205. doi: 10.1002/prot.22234. [DOI] [PMC free article] [PubMed] [Google Scholar]
- 31.Ribeiro JM, Sillero A. A program to calculate the isoelectric point of macromolecules. Comp Bio Med. 1991;21(3):131–41. doi: 10.1016/0010-4825(91)90022-2. [DOI] [PubMed] [Google Scholar]
Associated Data
This section collects any data citations, data availability statements, or supplementary materials included in this article.