

Abstract
Background:
Although lifestyle modifications generally are effective in lowering blood pressure (BP) among patients with unmedicated hypertension and in those treated with 1–2 antihypertensive agents, the value of exercise and diet for lowering BP in patients with resistant hypertension (RH) is unknown.
Methods:
One hundred forty patients with RH (mean age 63 years; 48% female; 59% Black; 31% with diabetes; 21% with chronic kidney disease) were randomly assigned to a 4-month program of lifestyle modification (C-LIFE) including dietary counseling, behavioral weight management, and exercise; or a single counseling session providing standardized education and physician advice (SEPA). The primary endpoint was clinic systolic BP (SBP); secondary endpoints included 24-hour ambulatory BP and select CVD biomarkers including baroreflex sensitivity (BRS) to quantify the influence of the baroreflex on heart rate, high frequency heart rate variability (HF-HRV) to assess vagally-mediated modulation of heart rate, flow-mediated dilation (FMD) to evaluate endothelial function, pulse wave velocity (PWV) to assess arterial stiffness, and left ventricular mass (LV mass) to characterize LV structure.
Results:
Between-group comparisons revealed that the reduction in clinic SBP was greater in C-LIFE (−12.5 [95% CI: −14.9, −10.2] mm Hg) compared with SEPA (−7.1 [−95% CI: 10.4, −3.7] mm Hg) (P = .005); 24-hour ambulatory SBP also was reduced in C-LIFE (−7.0 [95% CI: −8.5, −4.0] mm Hg), with no change in SEPA (−0.3 [95% CI: −4.0, 3.4] mm Hg) (P = .001). Compared with SEPA, C-LIFE resulted in greater improvements in resting BRS (2.3 msec/mm Hg [1.3, 3.3] vs. −1.1 msec/mm Hg [95% CI: −2.5, 0.3], P <.001), HF-HRV (0.4 ln ms2 [95% CI: 0.2, 0.6] vs −0.2 ln ms2 [95% CI: −0.5, 0.1], P <.001), and FMD (0.3 % [−0.3, 1.0] vs. −1.4 % [−2.5, −0.3], P = .022). There were no between-group differences in PWV (p = .958) or LV mass (p = .596).
Conclusions:
Diet and exercise can lower BP in patients with RH. A 4-month structured program of diet and exercise as adjunctive therapy delivered in a cardiac rehabilitation setting results in significant reductions in clinic and ambulatory BP and improvement in selected CVD biomarkers.
Clinical Trial registration:
NCT02342808; https://clinicaltrials.gov › show › NCT02342808
Keywords: resistant hypertension, exercise, DASH diet, cardiac rehabilitation
INTRODUCTION
Resistant hypertension (RH) is defined as blood pressure (BP) that remains above goal (i.e., systolic blood pressure [SBP] ≥130 mm Hg and/or diastolic blood pressure [DBP] ≥80 mm Hg), despite adherence to a regimen of three or more optimally dosed antihypertensive medications of different classes, one of which is a diuretic.1 Although estimates vary, RH is believed to affect approximately 5% of the general population and 20–30% of hypertensive adults, with even higher rates among adults with risk factors for cardiovascular disease (CVD) such as diabetes or chronic kidney disease.2, 3 RH is a particularly important designation because it is associated with a higher prevalence of end-organ damage and a 50% greater risk for adverse CVD events, including stroke, myocardial infarction, and death, compared with controlled BP.4 Therefore, identifying effective treatments for lowering BP in patients with RH is timely and important.
The failure to lower BP adequately with established antihypertensive medications in RH patients has prompted the evaluation of medications not typically used for first-line therapy of hypertension, such as spironolactone and amiloride,5, 6 and the development of device-based interventions, most notably renal denervation.7–9
Surprisingly, lifestyle modification has not been rigorously evaluated in patients with RH. Several studies provided suggestive evidence that changes in diet and physical activity have the potential to lower BP substantially in these individuals.10, 11 However, these studies were small, treatment was as short as one week, the dietary modification was delivered in a clinical research unit rather than a ‘real world’ setting, and exercise and diet were studied separately. Lifestyle modifications, including both exercise training and dietary modification, particularly weight loss and the DASH eating plan, are of proven efficacy in lowering BP in unmedicated patients with hypertension and are often recommended as the first step for treating high BP12. However, recent reviews of the management of RH have noted that the efficacy of these lifestyle modifications in RH patients has not been established.13 It cannot be assumed that lifestyle modification would be effective in RH patients with a pathophysiology that renders them refractory to the most effective pharmacologic treatments. It is uncertain as to whether patients who are resistant to medications that are effective for the majority of patients with hypertension would benefit from lifestyle changes. The Treating Resistant hypertensIon Using lifestyle Modification to Promote Health (TRIUMPH) randomized clinical trial14 was designed to examine this issue by comparing a 4-month combined diet and exercise intervention, delivered in a cardiac rehabilitation setting, to a single educational session providing the same lifestyle prescription along with written guidelines to achieve specified exercise, weight loss, and nutritional goals.
METHODS
Trial Overview.
TRIUMPH was a randomized clinical trial (RCT) designed to evaluate whether an intensive, medically supervised lifestyle intervention, compared with an education and advice condition, can achieve clinically significant BP reductions in patients with RH. Enrollment began in June 2015 and ended in October 2019. The trial was approved by the institutional review board at Duke University School of Medicine and written informed consent was obtained from all participants. An independent data and safety monitoring board oversaw the conduct of the study and reviewed study progress and safety data. The study is registered at www.clinicaltrials.gov (NCT02342808) and the trial methodology has been previously reported.14 All data and a detailed description of the assessment procedures and data analyses will be made available upon reasonable request for the purpose of replicating these results. One hundred forty patients with RH were randomized with 2:1 allocation to either a Center-based Lifestyle Intervention (C-LIFE) or Standardized Education and Physician Advice (SEPA). The primary endpoint was clinic SBP; secondary endpoints included clinic DBP, 24-hour ambulatory BP, body weight, aerobic fitness, and selected markers of CVD risk including baroreflex sensitivity (BRS), high frequency heart rate variability (HF-HRV), pulse wave velocity (PWV), flow-mediated dilation (FMD) of the brachial artery, and left ventricular mass (LVM) and relative wall thickness. All end-points were measured at baseline and again after the completion of the 4-month interventions.
Participants
Patients with RH, defined as treatment for at least 6 weeks with 3 or more antihypertensive medications of different classes, including a diuretic, with clinic SBP ≥ 130 mm Hg or DBP ≥ 80 mm Hg (modified from 140/90 mm Hg in November 2017), or the need for 4 or more drugs to achieve SBP ≤ 130 mm Hg and DBP ≤ 80 mm Hg, with SBP ≥ 120 mm Hg were eligible. Additional inclusion criteria included body mass index (BMI) ≥ 25 kg/m2, lack of regular moderate or vigorous physical activity, and age 35–80 years. Exclusion criteria included known secondary hypertension, estimated glomerular filtration rate (eGFR) < 40 ml/min/1.73 m2, moderate-severe ischemic heart disease, diabetes requiring insulin, and major psychiatric disorder or substance dependence, including alcohol consumption >14 drinks/week.
Screening Procedures and Baseline Laboratory Studies
All eligible patients had a series of BP measurements performed according to JNC 7 guidelines15, as described below. Serum creatinine and eGFR (calculated by the CKD-EPI equation), electrolytes, TSH, plasma renin activity, and serum aldosterone were measured on study entry.
Medication Adherence
Treatment regimens were documented by having participants bring their BP medications to the research clinic and were verified with referring physicians. Adherence was confirmed by self-report and objectively using the Medication Event Monitoring System (or MEMS®) bottle cap for 10 days.16 The intensity of pharmacotherapy was quantified as the number of antihypertensive medications, and as the Daily Defined Dose (DDD), a measure of drug amount that takes into account both the number of medications and their doses.17
Treatment Conditions
Participants were randomized to one of two 4-month treatment arms and were encouraged to maintain their prescribed antihypertensive medications at the discretion of their physicians. The prescribed lifestyle changes were essentially the same for participants in both 4-month treatment arms, with the difference being the intensity of the delivery of the interventions.
(1). Center-based Lifestyle Intervention (C-LIFE):
Participants received instruction from a nutritionist on the DASH diet with caloric and sodium restriction (≤2300 mg/day) and underwent weekly 45-minute group counseling sessions delivered by a clinical psychologist that emphasized changes in the initiation of eating behavior, individualized problem-solving, and maintenance of long-term behavior change. Participants also exercised at a cardiac rehabilitation facility 3 times per week for 30–45 min at a level of 70–85% of their initial heart rate reserve (See Expanded Methods in Supplementary Materials for more details about the C-LIFE intervention).
(2). Medical Management with Standardized Education and Physician Advice (SEPA):
Patients received a 1-hr educational session on BP management delivered by a health educator along with a workbook in which they received an individualized diet and exercise program including instruction in the DASH diet with caloric restriction and the same exercise prescription received by C-LIFE.
Outcome measures
Blood pressure.
The primary outcome measure was clinic SBP. Clinic-measured BP was determined according to JNC-7 guidelines. After 5 minutes of quiet rest, 4 seated BP readings, each 2 minutes apart, were obtained using an Accutorr Plus BP monitor (Datascope, Mahwah, New Jersey) with the first reading discarded to provide an average of 3 clinic BP measures per session. This clinic BP measurement protocol was repeated on 3 sessions over a 3 to 4-week period and the same protocol was repeated following the 4-month interventions. In this manner, the clinic BP values represented the average of nine BP readings obtained over a 3-week period. Clinic DBP was a secondary outcome measure.
Ambulatory SBP and DBP averaged over 24 hours were secondary BP endpoints. To assess BP during a typical day, participants wore an Oscar 2 (Suntech Medical Inc, Raleigh, North Carolina) ambulatory BP monitor (ABPM).18 The Oscar 2 was programmed to record BP measurements 3 times per hour throughout the waking hours and 2 times per hour during sleep. At least 70% of planned readings were required for an ambulatory BP record to be considered acceptable.19
Nutritional and Weight Assessment.
An independent assessment of dietary and nutritional content was obtained by 2 separate self-report measures of diet: a retrospective food frequency questionnaire (FFQ) requiring participants to recall typical consumption during a 4-week period20 and a 2-day (weekend/weekday) food diary.21 The FFQ was analyzed by NutritionQuest (Berkeley, California), and the diary data were analyzed using the Automated Self-Administered 24-hour (ASA 24®) Dietary Assessment Tool (https://epi.grants.cancer.gov/asa24/). An overall DASH eating plan score was quantified using a scoring algorithm used previously.22 In addition, sodium and potassium intake were estimated from urinary excretion over a 24-hour period.23 Body weight was determined by a calibrated digital scale (Detecto; Cardinal Scale Manufacturing Co, Webb City, Missouri).
Cardiorespiratory Fitness.
Participants underwent a maximal graded exercise treadmill test in which workloads were increased at a rate of 1 metabolic equivalent per minute.24 Expired air was collected by mouthpiece for quantification of minute ventilation, oxygen consumption, and carbon dioxide production with the Parvo Medics TrueOne measurement system (model 2400; Parvo Medics, Sandy, Utah).
CVD and Metabolic Biomarkers.
Secondary outcomes included measurement of BRS to quantify the influence of the baroreflex on heart rate,25 PWV to assess arterial stiffness,26 HF-HRV to assess vagally mediated modulation of heart rate,27 FMD to evaluate endothelial function28, 29, LVM and relative wall thickness to characterize left ventricular structure,30 C-reactive protein, and blood markers reflecting metabolic function (e.g., insulin, glucose, and lipids). (See Expanded Methods for more details of the CVD biomarker assessment procedures).
Randomization
Participants were randomized to C-LIFE and SEPA in clusters of 3 to 5 participants when possible. The size of the group was determined by how many eligible participants were available to be randomized within 4–5 weeks of the completion of their baseline BP assessments. Participants were provided treatment group assignments in sealed envelopes; staff members performing assessments were blinded to participants’ group assignments.
Statistical Analysis
All analyses were conducted using SAS 9.4. To examine changes in the primary outcome, clinic SBP, general linear models were used with post-treatment SBP as the outcome (4-months), treatment group assignment (C-LIFE vs SEPA) as a between-subjects factor, and race, sex, age, diagnosis of diabetes or chronic kidney disease (CKD), baseline medication adherence, and pretreatment clinic SBP as covariates, selected a priori. An ancillary analysis was conducted to evaluate the possible role of change in BP medication on the treatment effect by adding the DDD measure as a covariate in the models testing treatment group effects. Clinic DBP, ambulatory 24-hr BP, and daytime and nighttime BPs were analyzed using a parallel approach as the primary analyses, as were analyses of lifestyle changes following treatment including body weight, aerobic capacity, and dietary intake. Changes from pre-to-post treatment are expressed as model-adjusted least squared means with the accompanying 95% confidence interval (95% CI). For secondary analyses of multiple CVD and metabolic biomarkers, a mean rank composite was used to control for type I error.31 Use of such ‘gatekeeper’ approaches also lessens the influence of any outliers by restricting the distribution of outcomes using rank values (1 to 140) separately at baseline and post-treatment. All analyses of primary and secondary outcomes were performed following the intent-to-treat principle using Markov Chain multiple imputation analyses with 100 imputations (PROC MI and PROC MIANALYZE in SAS 9.4). Missing data were infrequent, with the vast majority of assessments having ≥ 93% complete data prior to imputation and 91% of participants providing complete ambulatory BP data. Missing data were most common for vascular ultrasound assessments of FMD (16%) and BRS (26%) because of the COVID-19 pandemic during which in-person laboratory visits were not permitted. Unless otherwise indicated, all analyses represent between-group comparisons.
RESULTS
The CONSORT diagram for study participants is shown in Figure 1. As illustrated in the diagram, 506 patients were initially contacted, 266 screened, and 140 met the eligibility criteria and were randomized to one of the interventions. Of the 140 randomized participants, 67 were enrolled after the 2017 ACC/AHA BP guidelines were published and the threshold BP for inclusion was lowered to clinic SBP ≥ 130 mm Hg or DBP ≥ 80 mm Hg; 21 of these would not have qualified using the prior BP criteria. Ninety individuals were randomized to C-LIFE and 50 to SEPA. During the trial, only four patients dropped out (all from SEPA). However, due to the COVID-19 pandemic, three SEPA participants were unable to complete portions of their post-treatment assessments involving in-person laboratory biomarker measures. For these patients, clinic BPs were obtained remotely from home measurements and ambulatory BP devices were mailed to participants for self-application and monitoring. Using intention-to-treat analyses, all 140 participants were retained in the final analyses.
Figure 1:
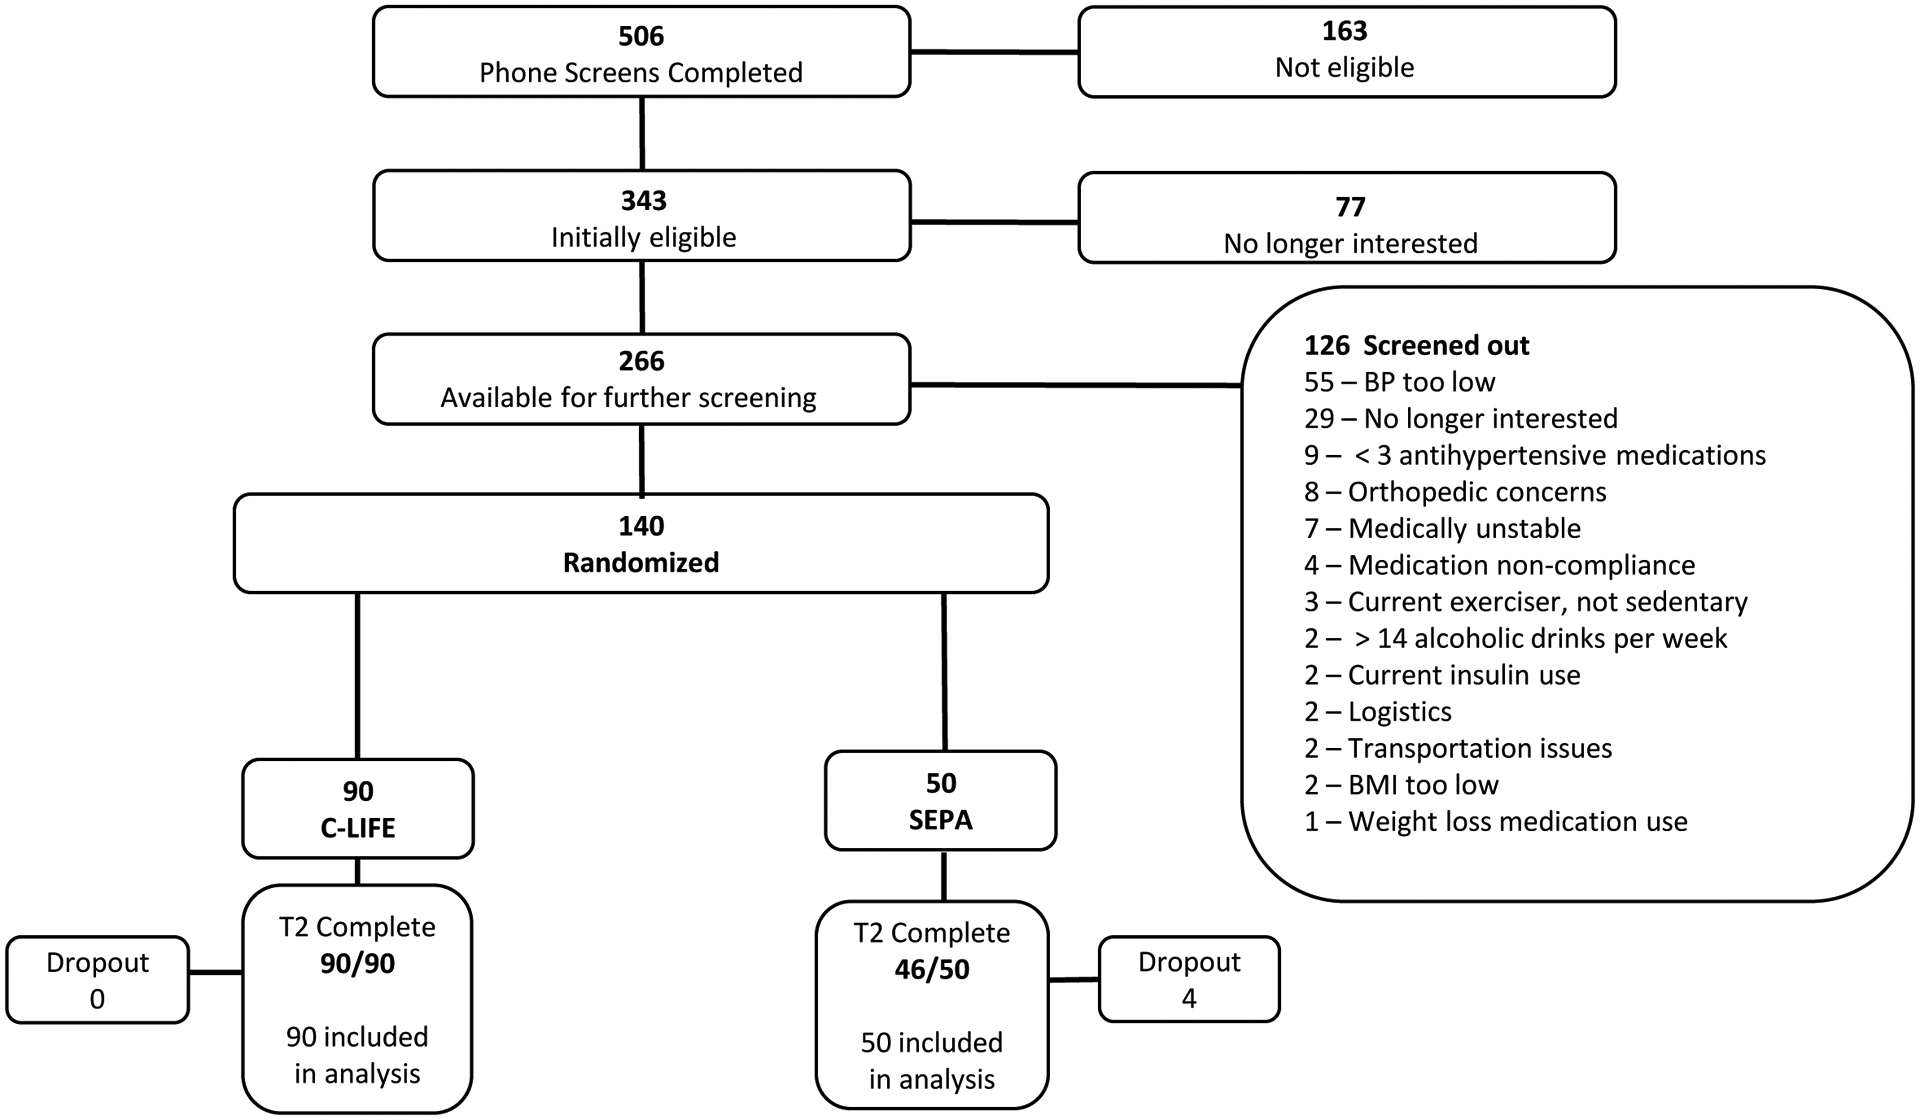
CONSORT chart of trial enrollment.
Sample Characteristics
Background and clinical characteristics of the sample are presented in Table 1. Men and women were equally represented and the sex distribution was similar in the two groups. Participants averaged 63 years of age and were more likely to be African American (59%) and obese (mean BMI = 36.0 [SD = 5.7] kg/m2). Almost a third had diabetes, and 24% had a history of CKD. No participants had evidence of clinically significant hyper- or hypothyroidism or unexplained hypokalemia. Fourteen patients had suppressed plasma renin activity and serum aldosterone > 10 ng/dl. On average, participants were prescribed 3.5 (SD = 0.7) antihypertensive medications.
Table 1.
Background and clinical characteristics of the TRIUMPH cohort.
| Variable | C-LIFE (N = 90) |
SEPA (N = 50) |
Total Cohort (N = 140) |
|---|---|---|---|
| Age (yrs) | 62 (9) | 63 (9) | 63 (9) |
| Sex (N, % Female) | 43 (48%) | 24 (48%) | 67 (48%) |
| Other | 2 (2%) | 0 (0%) | 2 (1%) |
| ≥ College Graduate | 54 (60%) | 31 (62%) | 85 (61%) |
| >200k | 7 (8%) | 5 (10%) | 12 (9%) |
| Retired / Not Employed | 46 (51%) | 24 (48%) | 70 (50%) |
| Widowed | 6 (7%) | 0 (0%) | 6 (4%) |
| Clinical Characteristics | |||
| Clinic SBP (mm Hg) | 139 (10) | 140 (10) | 139 (10) |
| Clinic DBP (mm Hg) | 79 (9) | 80 (8) | 79 (9) |
| 24-hour Ambulatory SBP (mm Hg) | 133 (11) | 133 (14) | 133 (12) |
| 24-hour Ambulatory DBP (mm Hg) | 71 (10) | 71 (11) | 71 (10) |
| Daytime Ambulatory SBP (mm Hg) | 136 (12) | 138 (15) | 137 (13) |
| Daytime Ambulatory DBP (mm Hg) | 74 (10) | 74 (11) | 74 (11) |
| Nighttime Ambulatory SBP (mm Hg) | 123 (15) | 123 (16) | 123 (15) |
| Nighttime Ambulatory DBP (mm Hg) | 64 (11) | 62 (10) | 63 (11) |
| Weight (lb) | 230 (45) | 231 (41) | 230 (44) |
| Body Mass Index (kg/m2) | 36 (6) | 36 (5) | 36 (6) |
| Diabetes | 33 (37%) | 11 (22%) | 44 (31%) |
| Current Smoker | 1 (1%) | 5 (10%) | 6 (4%) |
| History of MI | 6 (7%) | 1 (2%) | 6 (4%) |
| History of PCI | 2 (2%) | 1 (2%) | 7 (5%) |
| History of CABG | 6 (7%) | 1 (2%) | 3 (2%) |
| History of Stroke | 4 (4%) | 3 (6%) | 7 (5%) |
| History of CKD | 18 (20%) | 16 (32%) | 34(24%) |
| eGFR (mL/min/1.73m2) | 78 (17) | 76 (21) | 77 (19) |
| Total Cholesterol (mg/dL) | 174 (43) | 179 (42) | 176 (43) |
| LDL Cholesterol (mg/dL) | 98 (38) | 100 (34) | 99 (37) |
| HDL Cholesterol (mg/dL) | 50 (17) | 55 (17) | 52 (17) |
| VLDL Cholesterol (mg/dL) | 26 (14) | 24 (10) | 25 (13) |
| Triglycerides (mg/dL) | 130 (72) | 120 (51) | 127 (65) |
| Glucose (mg/dL) | 111 (22) | 110 (24) | 110 (23) |
| Insulin (mIU/L) | 17 (8) | 17 (11) | 17 (9) |
| Statins / Cholesterol Lowering Medications | 47 (52%) | 28 (56%) | 75 (54%) |
| Peak VO2 (ml/kg/min) | 17.9 (5) | 16.6 (4) | 17.4 (5) |
| ETT Duration (min) | 7.4 (2) | 6.8 (2) | 7.2 (2) |
| DASH Eating Plan | 3.7 (1) | 3.4 (1) | 3.5 (1) |
| ASCVD 10-year Risk Score (%) | 13.4 (8) | 13.2 (8) | 13.4 (8) |
| Duration of Hypertension, years | 22.2 (12.5) | 22.3 (10.6) | 22.2 (11.8) |
| Antihypertensive Medications | |||
| Antihypertensive Medication Burden, Daily Defined Dose Sum | 5.1 (2) | 4.9 (2) | 5.0 (2) |
| Number of Antihypertensive Medications | 3.5 (0.7) | 3.4 (0.8) | 3.5 (0.7) |
| Thiazide or Thiazide-Like Diuretics | 64 (71%) | 36 (72%) | 100 (71%) |
| Loop Diuretics | 11 (12%) | 6 (12%) | 17 (12%) |
| Mineralocorticoid Receptor Antagonists | 22 (24%) | 7 (14%) | 29 (21%) |
| Other Potassium Sparing Diuretics | 9 (10%) | 6 (12%) | 15 (11%) |
| Beta-Blockers | 66 (73%) | 35 (70%) | 101 (72%) |
| Angiotensin Receptor Blockers | 47 (52%) | 35 (70%) | 73 (52%) |
| Calcium Antagonists | 71 (79%) | 37 (74%) | 108 (77%) |
| ACE-Inhibitors | 33 (37%) | 23 (46%) | 56 (40%) |
| Alpha Adrenergic Receptor Blockers | 0 (0%) | 2 (4%) | 2 (1%) |
| Central Alpha Adrenergic Receptor Agonists | 3 (3%) | 4 (8%) | 7 (5%) |
| Direct Vasodilators | 9 (10%) | 2 (4%) | 11 (8%) |
Note: ASCVD = atherosclerotic cardiovascular disease; CABG = coronary artery bypass grafting; DASH = Dietary Approaches to Stop Hypertension; MI = myocardial infarction; PCI = percutaneous coronary intervention; ETT = Exercise treadmill test; VO2peak = peak oxygen consumption
Adherence to Treatment Protocol
Examination of C-LIFE participants’ attendance to exercise training and dietary classes revealed excellent adherence. Participants attended a median of 94% of their DASH diet classes (IRQ: 81%, 94%) (Mean = 88.4 [SD = 11.3]) and 89% of structured exercise sessions (IRQ: 84%, 96%) (Mean = 88.3 [SD = 11.6]), and were in their target HR training range 94% of the time (IRQ: 82%, 99%) (Mean = 86.4 [SD = 16.7]).
Adherence to Medication Regimen
Participants in both groups exhibited excellent adherence to their antihypertensive medication regimens. Examination of MEMS data demonstrated a high degree of adherence at baseline (mean percentage medications taken: C-LIFE = 97% [SD = 7], SEPA = 97% [SD = 6]; mean percent medications taken within appropriate window: C-LIFE = 94% [SD = 11], SEPA = 95% [SD = 8]). Following the completion of the intervention, MEMS documented that participants in both conditions maintained their high levels of adherence for medications taken (mean percent medications taken: C-LIFE = 95% [SD = 9], SEPA = 96% [SD = 7]; P = .309) and for medications taken within the prescribed time window, with no treatment group differences (mean percent medications taken within appropriate window: C-LIFE = 93% [SD = 12], SEPA = 93% [SD = 12]; P = .489).
Lifestyle Outcomes
Examination of changes in aerobic fitness and functional capacity revealed greater improvements in peak VO2 in the C-LIFE condition (14.8% VO2 improvement [95% CI: 11.0, 18.6]) compared with SEPA (3.4% VO2 improvement [95% CI: −2.3, 9.2]) (P = .002), as well as greater exercise duration (Table 2). Increased physical activity also was observed by actigraphy-determined total steps, with greater activity documented in C-LIFE (971 steps per day increase [95% CI: 568, 1374]) compared with minimal changes in SEPA (14 steps per day increase [95% CI: −580, 608]; P<.01).
Table 2:
Mean Changes (with 95% Confidence Intervals) from Baseline (Pre-) to Post-intervention (with 95% Confidence intervals) for Physical Activity, Aerobic Fitness, Dietary Variables and Urinary Biomarkers in C-LIFE vs. SEPA.
| Variable | C-LIFE | SEPA | Group Contrast, P-value | ||||
|---|---|---|---|---|---|---|---|
| Pre (SD) | Adjusted Post | Adjusted Δ | Pre (SD) | Adjusted Post | Adjusted Δ | ||
| Physical Activity / Aerobic Fitness/ Weight | |||||||
| Actigraphy, Total Steps | 10,157 (2450) | 11,216 (10,784, 11,648) | 971 (568, 1374) | 10,497 (2701) | 10,104 (9452, 10,756) | 14 (−580, 608) | .024 |
| ETT Peak VO2 (ml/kg/min) | 17.9 (4.5) | 20.0 (19.3, 20.6) | 2.40 (1.75, 3.05) | 16.6 (4.4) | 17.9 (16.8, 18.9) | 0.57 (−0.41, 1.54) | .002 |
| ETT Peak VO2 (L/min) | 1.9 (0.6) | 1.9 (1.9, 2.0) | 0.10 (0.05, 0.16) | 1.7 (0.6) | 1.8 (1.7, 1.9) | −0.01 (−0.10, 0.07) | .021 |
| ETT Duration (min) | 7.4 (2.1) | 9.3 (9.0, 9.6) | 2.09 (1.8, 2.4) | 6.8 (2.4) | 7.6 (7.1, 8.1) | 0.58 (0.11, 1.05) | <.001 |
| Weight (lbs) | 230 (45) | 215 (213, 217) | −15.3 (−17.2, −13.3) | 231 (41) | 221 (219, 224) | −8.5 (−11.4, −5.6) | <.001 |
| Body Mass Index (kg/m2) | 35.9 (6.0) | 33.6 (33.3, 34.0) | −2.34 (−2.65, −2.02) | 36.1 (5.2) | 34.7 (34.2, 35.1) | −1.26 (−0.80, −1.72) | <.001 |
| Dietary Data | |||||||
| Calories (kcal/day) | 1811 (480) | 1666 (1572, 1761) | −187 (−282, −92) | 1912 (589) | 1616 (751, 1482) | −226 (−377, −75) | .281 |
| Protein (g/day) | 80.6 (24) | 78.7 (74.2, 83.2) | −3.0 (−1.4, 7.5) | 83.4 (25) | 77.1 (70.7, 83.5) | −5.0 (−2.0, 12.0) | .097 |
| Carbohydrates (g/day) | 205 (61) | 195 (183, 207) | −16.2 (−28.3, 4.1) | 219 (80.2) | 179 (162, 197) | −29.0 (−47.9, −10.0) | .021 |
| Fiber (g/day) | 19.2 (7.1) | 20.9 (19.3, 22.4) | 2.3 (0.7, 3.8) | 17.3 (5.3) | 18.1 (15.8, 20.4) | 0.2 (−2.7, 2.4) | .040 |
| Magnesium (mg/day) | 306 (105) | 316 (297, 334) | 6.2 (−10.3, 22.7) | 295 (80) | 283 (256, 310) | −35.3 (−59.8, −10.9) | .008 |
| Potassium (mg/day) | 2798 (790) | 2846 (2702, 2990) | 66 (−68, 200) | 2741 (796) | 2556 (2350, 2761 | −243 (−411, −45) | .014 |
| Sodium (mg/day) | 3173 (879) | 2975 (2805, 3145) | −221 (−393, −49) | 3205 (893) | 2874 (2631, 3117) | −277 (−547, −8) | .244 |
| Calcium (mg/day) | 815 (316) | 771 (714, 828) | −41.4 (−99.2, 16.4) | 803 (311) | 751 (670, 833) | −61.1 (−158.3, 36.4) | .418 |
| DASH Eating Plan Score | 3.7 (1.2) | 4.0 (3.8, 4.3) | 0.6 (0.3, 0.8) | 3.4 (1.1) | 3.8 (3.5, 4.2) | 0.3 (−0.1, 0.6) | .262 |
| Vegetable Servings/day | 3.7 (1.8) | 4.4 (4.0, 4.8) | 0.6 (0.2, 1.1) | 4.0 (2.0) | 3.3 (2.7, 3.9) | −0.5 (−1.1, 0.0) | .004 |
| Fruit Servings/day | 3.3 (2.2) | 4.0 (3.5, 4.5) | 0.7 (0.2, 1.2) | 3.0 (1.9) | 3.4 (2.7, 4.1) | 0.2 (−0.5, 1.0) | .350 |
| Whole Grain Servings/day | 1.0 (0.9) | 1.2 (1.0, 1.4) | 0.2 (0.0, 0.4) | 0.8 (0.8) | 1.0 (0.7, 1.3) | 0.1 (−0.3, 0.4) | .251 |
| Nuts and Legumes/day | 1.8 (2.1) | 1.9 (1.3, 2.4) | 0.2 (−0.4, 0.7) | 1.4 (1.5) | 2.1 (1.3, 2.9) | 0.4 (−1.3, 0.4) | .606 |
| Sweets Servings/week | 18.5 (12.2) | 15.5 (13.2, 17.8) | −5.6 (−7.9, −3.3) | 25.6 (20.7) | 15.5 (12.1, 19.0) | −6.3 (−9.6, −3.0) | .987 |
| Total Fat (%) | 36.1 (6.2) | 34.7 (33.2, 36.1) | −1.6 (−3.0, −0.2) | 36.7 (4.4) | 35.6 (33.6, 37.7) | −0.8 (−2.8, 1.1) | .407 |
| Saturated Fat (%) | 11.3 (2.9) | 10.3 (9.7, 10.9) | −1.0 (−1.6, −0.4) | 11.2 (1.9) | 10.9 (10.0, 11.7) | −0.4 (−1.2, 0.4) | .167 |
| Phosphorus (mg/day) | 1288 (371) | 1242 (1176, 1308) | −52.6 (−117.6, 12.4) | 1299 (354) | 1209 (1113, 1303) | −90.8 (−186.9, 5.3) | .359 |
| Urinary Electrolytes | |||||||
| Urine Sodium Excretion, mg/day | 2741 (1007) | 2473 (132) | −308 (−567, −50) | 2857 (1423) | 3023 (240)) | 187 (−288, 662) | .007 |
| Urine Potassium Excretion, mg/day | 1810 (606) | 2178 (2048, 2308) | 416 (286, 546) | 1678 (742) | 2064 (1847, 2281) | 292 (96, 488) | .382 |
Note: ETT = Exercise Treadmill Test; DASH = Dietary Approaches to Stop Hypertension Diet. Dietary data were derived from the Dietary recall and Food Frequency Questionnaire.
Examination of weight changes and dietary composition revealed a similar pattern. C-LIFE participants exhibited substantial weight loss (−15.3 lbs. [95% CI: −17.2, −13.3]) compared with significant, albeit more modest, weight loss in the SEPA condition (−8.5 lbs. [95% CI: −11.4, −5.6]) (P <.001). The C-LIFE group demonstrated greater reductions in urinary sodium excretion compared with SEPA (−308 mg/day [95%CI: −567, −50] vs. −187 mg/day [95% CI: −288, 662], P = .007), whereas urinary potassium was not differentially improved between groups (C-LIFE: 416 mg/day [95% CI: 286, 546] vs. SEPA: 292 mg/day [95% CI: 96, 488], P=.382). There were modest improvements in adherence to the DASH eating plan in both C-LIFE and SEPA (0.6 DASH score increase [95% CI: 0.3, 0.8] vs. 0.3 DASH score increase [95% CI: −0.1, 0.6], respectively, P = .262). Unadjusted pre-post values of lifestyle measures are provided in Table I in the Supplement.
There was no significant change in BP medication burden, as measured by the DDD, from baseline to post-treatment (P = .627), nor any evidence to suggest differential changes between treatment groups (P = .842 for time X treatment group interaction). At baseline, participants in C-LIFE were taking an average of 5.1 (SD = 2.3) standard DDDs of BP medications compared with 4.9 (SD = 1.7) in SEPA. Following treatment, the C-LIFE group demonstrated modest reductions in BP medication burden (−0.15 DDDs [95% CI: −0.30, 0.01]) compared with no changes in the SEPA group (0.00 DDDs [95% CI: −0.22, 0.23]; P = .277). There were no post-intervention group differences in the number of antihypertensive medications (C-LIFE = 3.5 [0.8]; SEPA = 3.5 [0.8]; P = .929).
Clinic BP Outcomes
C-LIFE participants exhibited lower clinic SBP (126.8 [95% CI: 124.5, 129.1] mm Hg), the primary outcome, compared with SEPA (132.8 [95% CI: 129.5, 136.1] mm Hg, P = .005). A similar improvement was noted for clinic DBP, with C-LIFE exhibiting lower DBP (73.2 [95% CI: 71.9, 74.4] mm Hg) compared with SEPA (75.6 [95% CI: 73.8, 77.4] mm Hg, P = .034). (Figure 2) Examination of clinic BP changes revealed greater reductions in clinic SBP in C-LIFE (−12.5 [95% CI: −14.9, −10.2] mm Hg), compared with more modest reductions in SEPA (−7.1 [95% CI: −10.4, −3.7] mm Hg) (P = .005), for a net difference in SBP reductions of −5.4 (95% CI: −9.7, −1.2) mm Hg. (Figure 3) Changes in clinic SBP for individual participants in the two groups are illustrated in Figure 4. There was no evidence for treatment group interactions with age (P = .751), sex (P = .455), race (P = .281), or baseline SBP (P = .440). Similarly, treatment group effects were not differentially affected by the presence of diabetes (P = .698 for clinic SBP interaction) or CKD (P = .745 for clinic SBP interaction). Similar reductions were noted for clinic DBP, with moderate reductions in C-LIFE (−5.9 [95% CI: −7.2, −4.7] mm Hg) compared with SEPA (−3.7 [95% CI: −5.6, −1.8] mm Hg) (P = .034), for a net difference in DBP reductions of −2.2 (95% CI: −4.4, 0.0) mm Hg. (Figures 2 and 3). BP < 130/80 mmHg was achieved in 59% of C-LIFE participants, compared with 38% of SEPA participants.
Figure 2: Mean Baseline (Pre-) and Post-Treatment Clinic and 24-hour Ambulatory Blood Pressure by Treatment Group.
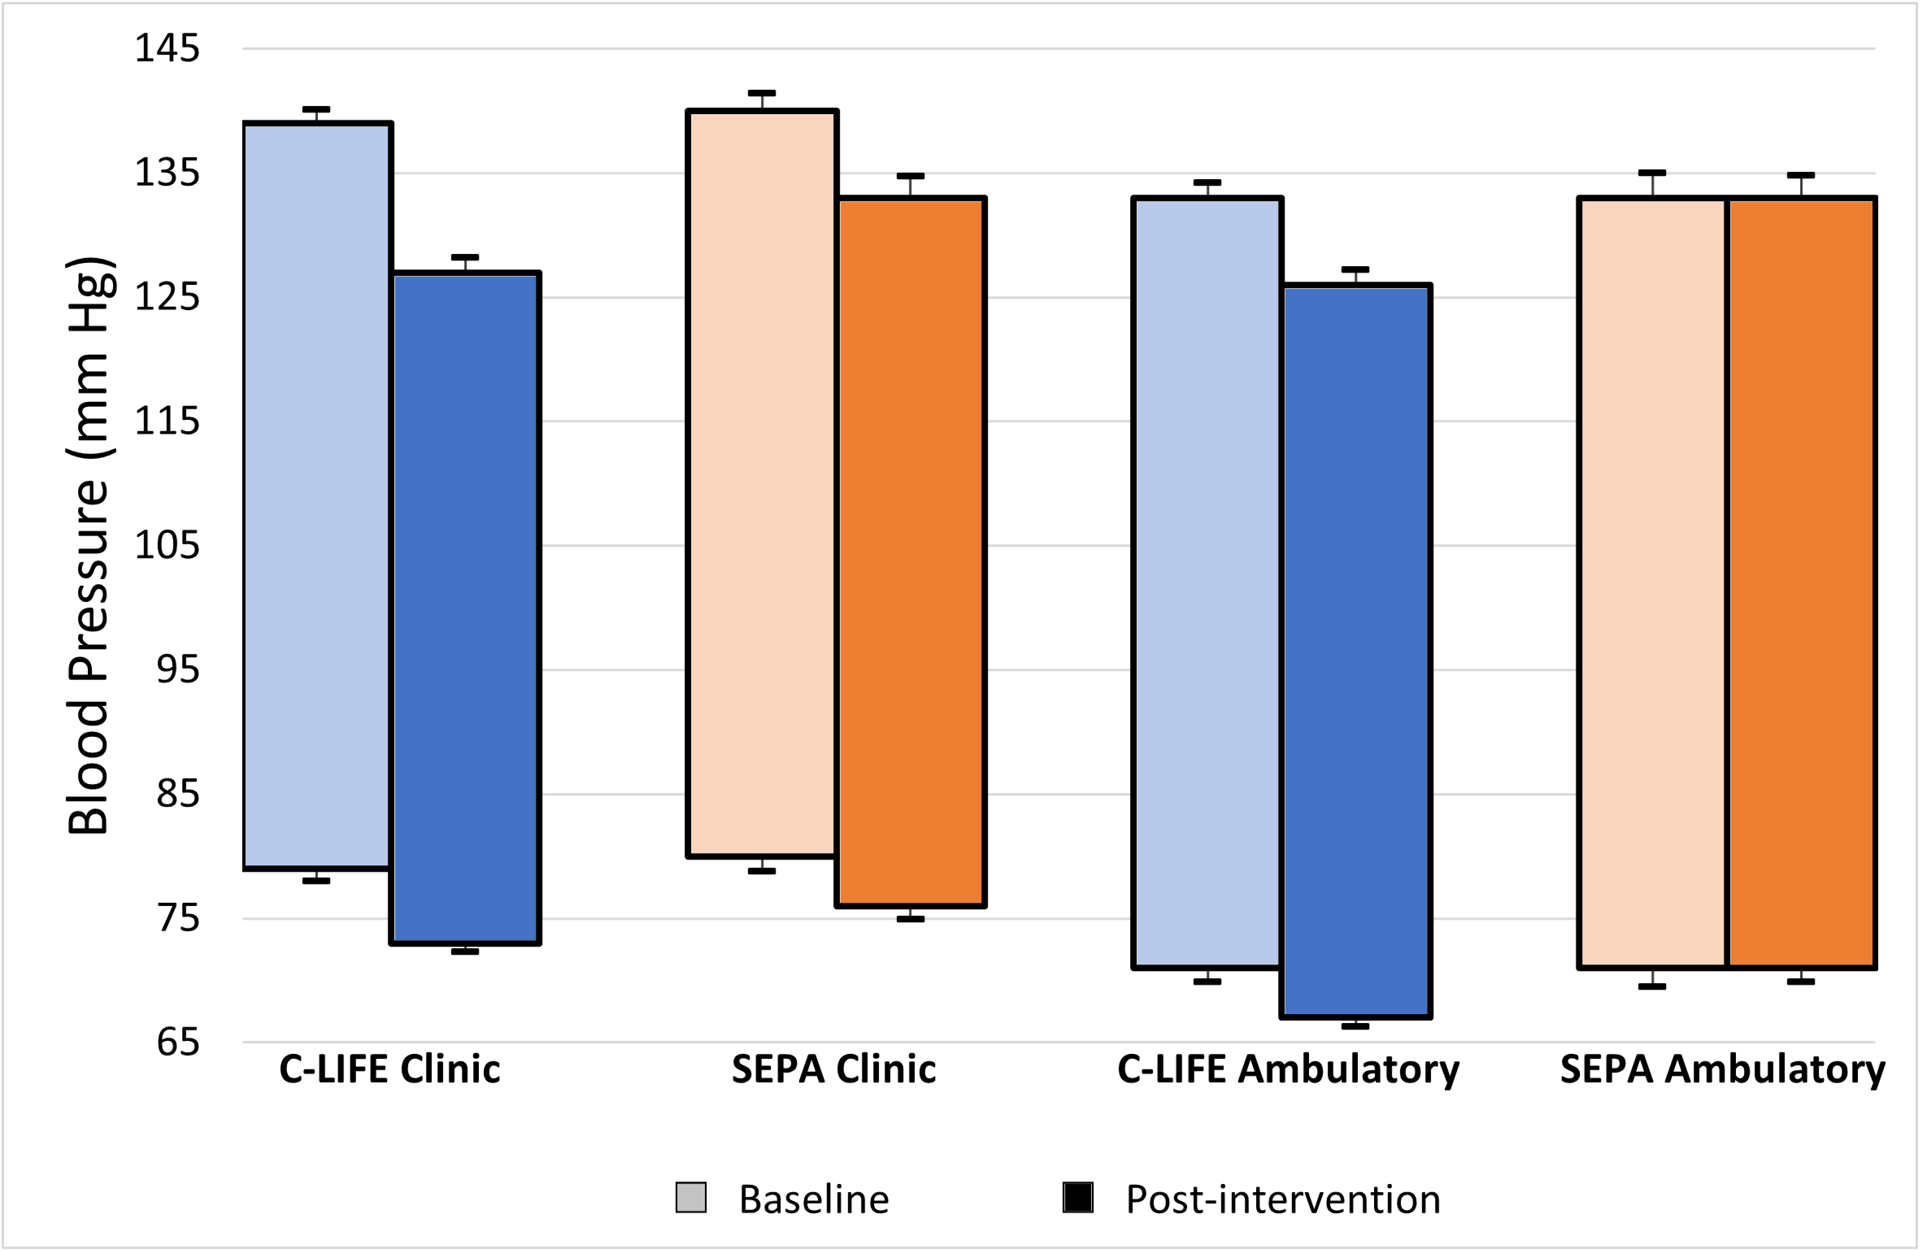
Baseline (pre-treatment) and post-treatment unadjusted systolic and diastolic clinic blood pressure (left) and systolic and diastolic ambulatory blood pressure (right) by treatment group (C-LIFE in blue; SEPA in orange). Error bars represent standard errors.
Figure 3: Mean Changes in Clinic and Ambulatory Blood Pressure from Baseline by Treatment Group.
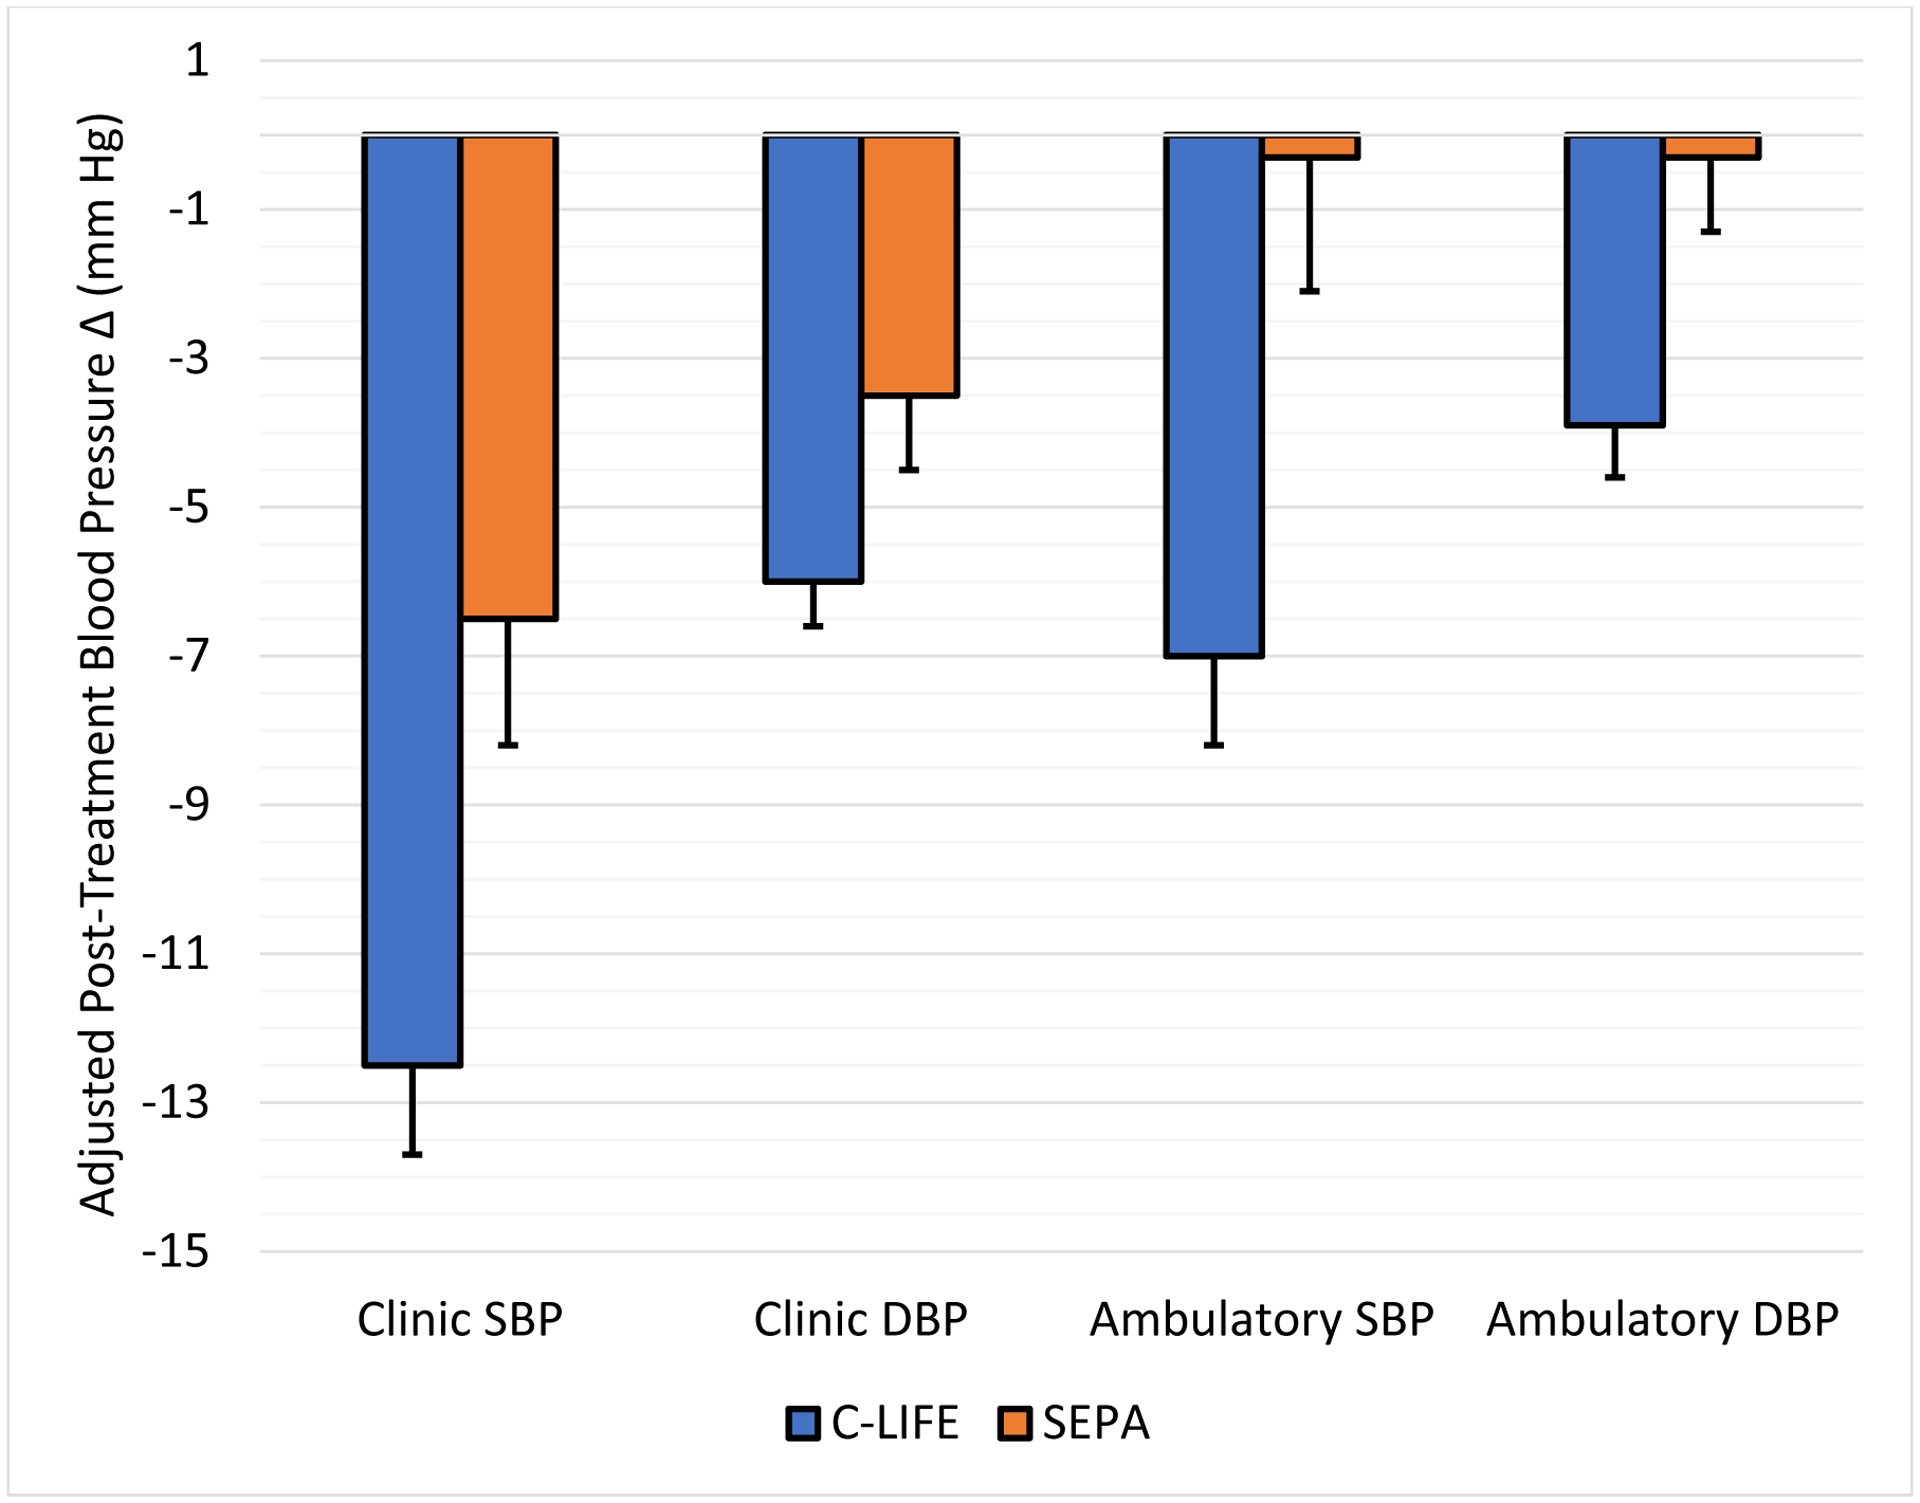
Adjusted mean systolic and diastolic blood pressure changes from baseline to post-treatment by treatment group. C-LIFE (blue) and SEPA (orange) plotted separately. Error bars represent standard errors.
Figure 4: Individual changes in Clinic and 24-hour Ambulatory SBP for C-LIFE and SEPA groups.
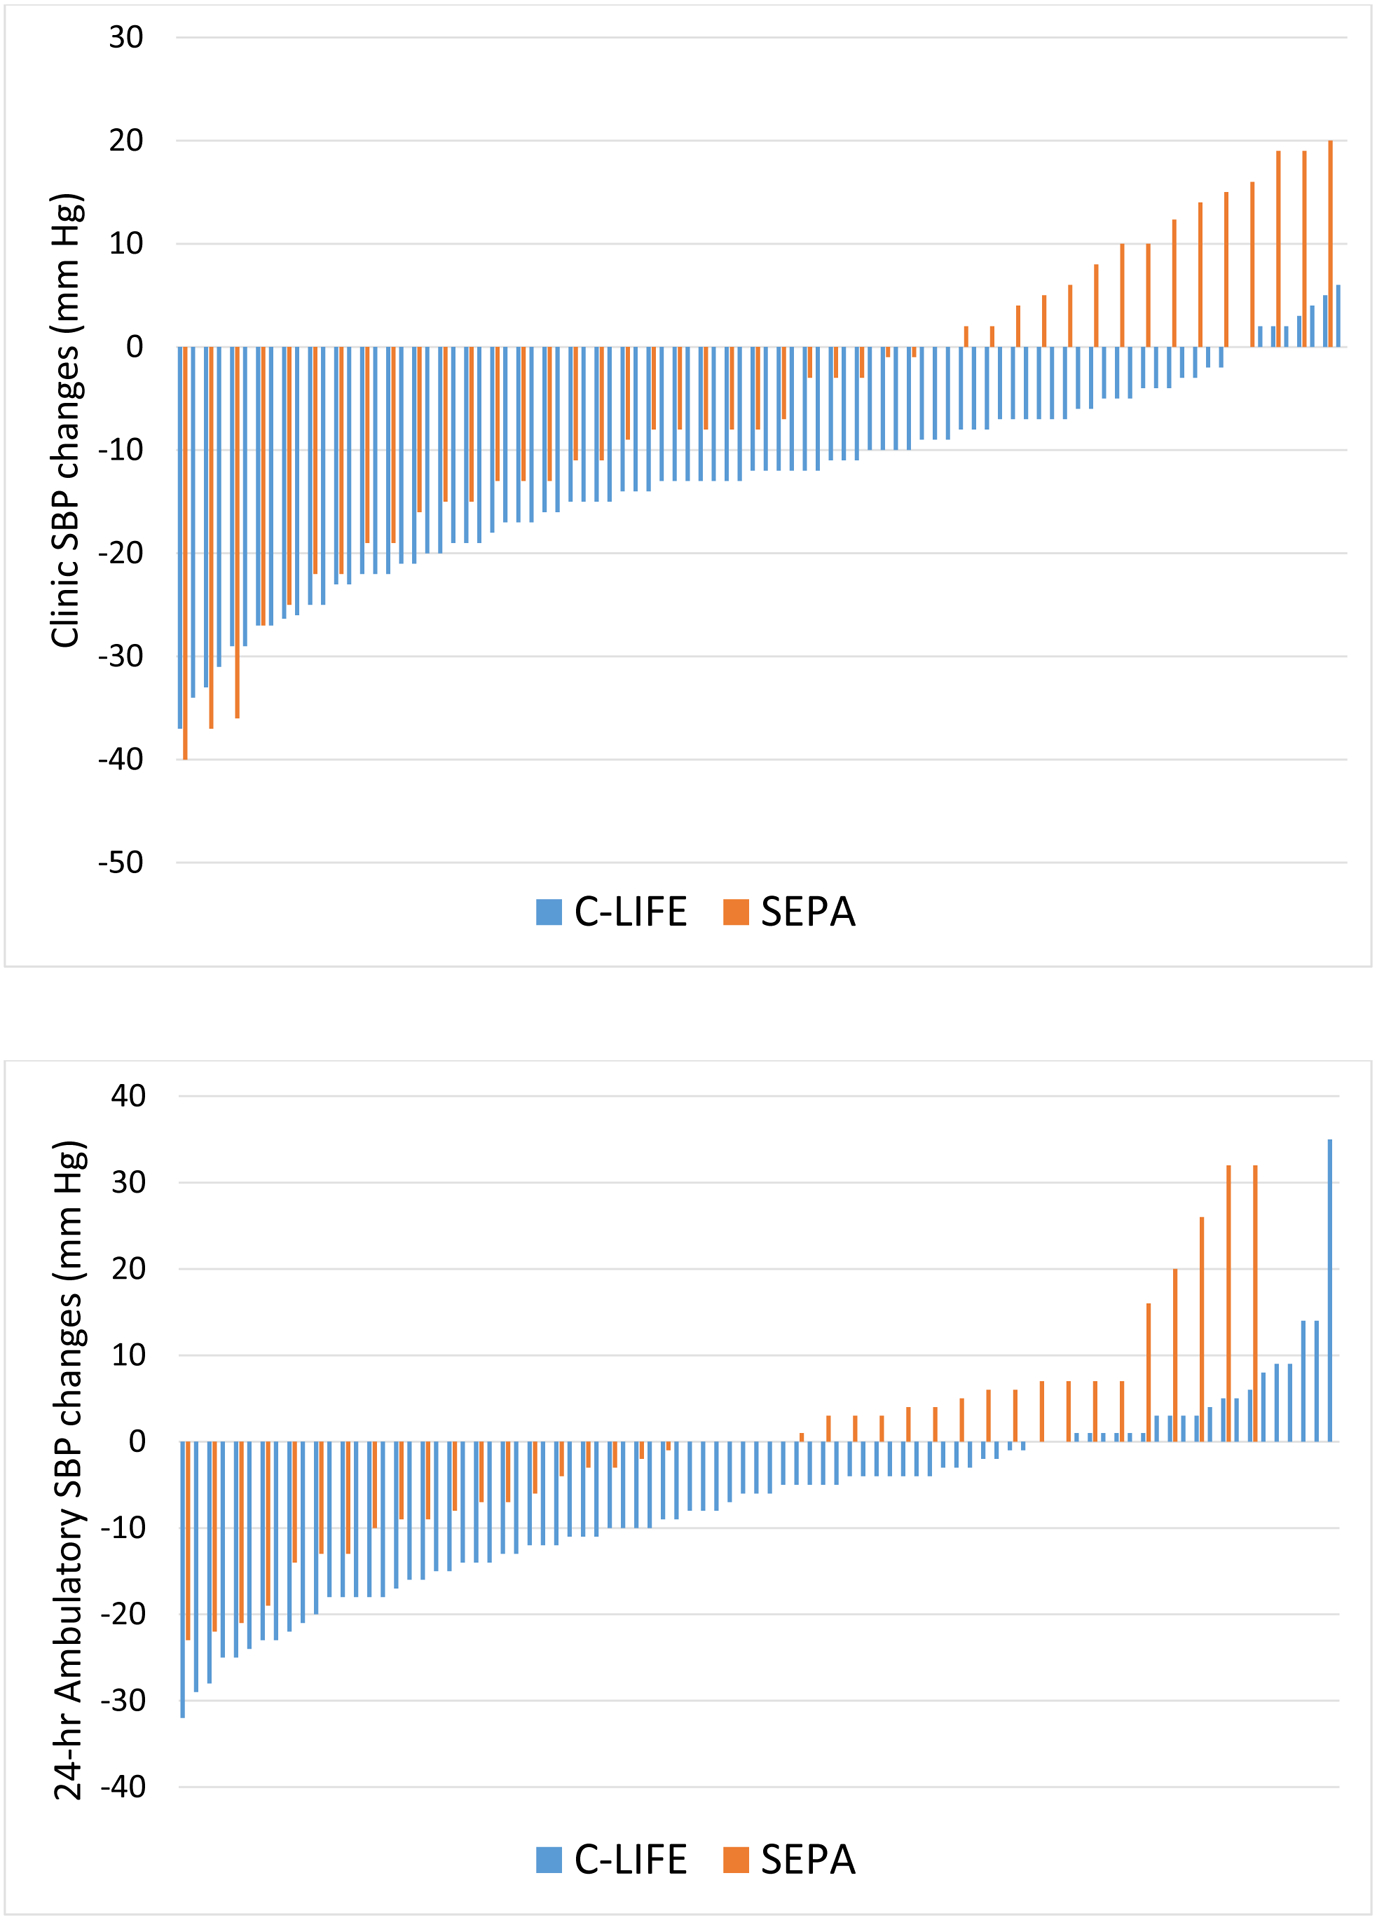
Individual systolic blood pressure (SBP) changes from baseline to post-treatment for clinic SBP (top) and ambulatory SBP (bottom) for C-LIFE (blue) and SEPA (orange).
Ambulatory BP Outcomes
Post-intervention 24-hour ambulatory BPs were significantly lower for C-LIFE (126.4 [95% CI: 124.0, 128.9] mm Hg/ 67.2 [95% CI: 65.8, 68.6] mm Hg) compared with SEPA (133.2 [95% CI: 129.4, 136.7]/ 70.8 [68.7, 72.9] mm Hg) (P = .001 for SBP and P = .002 for DBP) (Figure 2). Daytime SBP was lower in C-LIFE compared with SEPA (P = .003) (129.3 [95% CI: 126.8,131.8] v 136.5 [132.8,140.2] mm Hg) as was nighttime SBP (P = .047) (118.5 [95% CI: 115.8, 121.2] v 123.5 [95% CI: 119.2, 127.6] mm Hg). Daytime DBP also was lower for C-LIFE compared with SEPA (P = .013) (69.7 [95% CI: 68.2, 71.2] v 73.2 [95% CI: 71.1, 75.5] mm Hg]), while nighttime DBP was marginally lower for C-LIFE compared with SEPA (P = .068) (60.8 [95% CI: 59.4, 62.3] v 63.0 [95% CI: 60.7,. 65.4] mm Hg).
Examination of changes in 24-hour ambulatory SBP revealed a significant reduction in C-LIFE (−7.0 [95% CI: −8.5, −4.0] mm Hg), with no change in SEPA (−0.3 [95% CI: −4.0, 3.4] mm Hg) (P = .001). (Figure 3). Similarly, reductions in 24-hour ambulatory DBP were greater in C-LIFE (−3.9 [95% CI: −5.3, −2.5] mm Hg) compared with SEPA (0.3 [95% CI: −2.4, 2.8] mm Hg) (P = .002). Changes in 24-hour ambulatory SBP for individual participants in the two groups are illustrated in Figure 4.
CVD Biomarker Outcomes
Examination of post-intervention changes in CVD risk biomarker (mean rank) revealed more favorable CVD biomarker profiles among C-LIFE participants compared with SEPA (P = .027). Explanatory follow-up analyses revealed that these improvements were driven primarily by favorable changes in BRS, HF-HRV, and FMD. Individuals in C-LIFE demonstrated greater improvements in resting BRS (2.3 msec/mmHg [95% CI: 1.3, 3.3]) compared with SEPA (−1.1 msec/mmHg [95% CI: −2.5, 0.3]) (P = .003). Similarly, C-LIFE participants showed increased resting HF-HRV (0.4 ln ms2 [95% CI: 0.2, 0.6]) that was not observed in SEPA (−0.2 ln ms2 [95% CI: −0.5, 0.1]) (P = .025). Finally, C-LIFE participants exhibited improvements in FMD (0.3 % [−0.3, 1.0]) relative to SEPA participants (−1.4% [−2.5, −0.3], P = .022). Group differences in the other individual metabolic biomarkers were not significant (Table 3). Unadjusted pre-post CVD biomarker values are provided in Table II in the Supplement.
Table 3.
Mean Baseline to Post-treatment Changes in CVD and Metabolic Biomarker Values (with 95% Confidence Intervals) Following C-LIFE and SEPA Interventions
| Variable | C-LIFE | SEPA | Group Contrast, P-value | ||||
|---|---|---|---|---|---|---|---|
| Pre (SD) | Adjusted Post | Adjusted Δ | Pre (SD) | Adjusted Post | Adjusted Δ | ||
| CVD Biomarkers | |||||||
| BRS (msec/mmHg) | 6.0 (3.4) | 7.4 (6.4, 8.3) | 2.3 (1.3, 3.3) | 5.5 (3.2) | 5.3 (3.9, 6.7) | −1.1 (−2.5, 0.3) | .003 |
| HF-HRV (ms2) | 5.7 (1.1) | 6.1 (5.9, 6.3) | 0.4 (0.2, 0.6) | 5.7 (1.3) | 5.7 (5.4, 6.0) | −0.2 (−0.5, 0.1) | .025 |
| Flow Mediated Dilation, % | 2.1 (2.5) | 2.7 (2.1, 3.4) | 0.3 (−0.3, 1.0) | 2.0 (2.1) | 1.2 (0.1, 2.3) | −1.4 (−2.5, −0.3) | .022 |
| LVM (g/m2.7) | 47.5 (12.6) | 46.7 (44.6, 46.8) | −2.9 (−3.7, −2.0) | 49.5 (13.4) | 46.5 (45.1, 47.9) | −2.3 (−3.7, −0.8) | .596 |
| Relative Wall Thickness (g/m2) | 0.5 (0.1) | 0.44 (0.43, 0.45) | −0.03 (−0.04, −0.01) | 0.5 (0.1) | 0.45 (0.43, 0.46) | −0.01 (−0.03, 0.01) | .129 |
| PWV (m/sec) | 9.8 (4.2) | 9.7 (9.2, 10.2) | 0.16 (−0.40, 0.72) | 10.1 (2.3) | 10.1 (9.3, 10.9) | 0.14 (−0.72, 1.0) | .958 |
| Metabolic Biomarkers | |||||||
| hsCRP (mg/L) | 3.7 (3.0) | 3.0 (2.6, 3.5) | −0.72 (−1.14, −0.30) | 3.8 (2.6) | 3.5 (2.8, 4.1) | −0.23 (−0.90, 0.44) | .550 |
| Total Cholesterol (mg/dL) | 174 (43) | 168 (163, 173) | −8.4 (−14.3, −2.6) | 179 (42) | 168 (160, 176) | −9.6 (−18.6, −0.7) | .855 |
| HDL-cholesterol (mg/dL) | 50.3 (17) | 53 (51, 54) | 0.5 (−1.3, 2.3) | 55 (17) | 53 (51, 56) | 1.4 (−1.5, 4.2) | .574 |
| LDL-cholesterol (mg/dL) | 97.6 (38) | 94 (90, 98) | −4.8 (−9.5, −0.5) | 100 (34) | 92 (86, 99) | −7.8 (−15.1, −0.6) | .872 |
| VLDL-cholesterol (mg/dL) | 26 (14) | 22 (20, 23) | −3.9 (−5.6, −2.2) | 24 (10) | 22 (20, 24) | −3.5 (−6.1, −1.0) | .870 |
| Triglycerides (mg/dL) | 130 (72) | 109 (100, 117) | −19.5 (−27.9, −11.0) | 120 (51) | 110 (98, 122) | −17.7 (−30.5, −4.9) | .880 |
| Glucose (mg/dL) | 111 (22) | 104 (100, 107) | −6.8 (−10.3, −3.4) | 112 (35) | 105 (100, 110) | −7.4 (−12.6, −2.3) | .529 |
| Insulin (uIU/ml) | 17 (8) | 12 (11, 13) | −5.1 (6.5, −3.7) | 17 (11) | 13 (11, 15) | −3.6 (−5.8, −1.5) | .469 |
| HbA1c (%) | 6.2 (0.7) | 5.9 (5.8, 6.0) | −0.28 (−0.40, −0.17) | 6.2 (1.0) | 6.0 (5.8, 6.1) | −0.30 (−0.46, −0.14) | .212 |
Note: Overall intervention group contrast of CVD Biomarker global score for C-LIFE and SEPA: P = .027.
BRS = Baroreflex sensitivity; HF-HRV = high frequency heart rate variability; LVM = left ventricular mass index; PWV = pulse wave velocity; HbA1c = hemoglobin A1c
DISCUSSION
This randomized clinical trial showed a benefit of an intensive lifestyle intervention for reducing both clinic and ambulatory BP in patients with RH. Although diet and exercise are generally well-established for the treatment of hypertension,32, 33 documentation of the antihypertensive benefits of lifestyle modifications in RH patients is almost nonexistent. Hypertension Canada’s 2020 comprehensive review of the evidence regarding the treatment and management of RH noted that there were no RCTs that reported clinically relevant outcomes following health behavior modifications in RH.34 A recent review by Carey13 noted that no studies had evaluated the effect of weight loss or the DASH diet in RH patients; two small studies, with 12 and 20 patients, respectively, showed BP lowering with sodium restriction,10, 35 and only two small studies demonstrated BP lowering with walking11 or water-based exercises.36 Until TRIUMPH, no studies had evaluated the effects of comprehensive lifestyle modification in RH. The combination of exercise, weight loss, and the DASH diet with sodium restriction is not only effective for unmedicated hypertensive patients, as had been demonstrated previously,37 but also produces clinically significant BP lowering benefits in patients with RH. Moreover, the present findings provide strong support for the value of providing an intensive, structured intervention to achieve these benefits. While RH patients who received a 1-hour counseling session that included educational materials and advice for optimal BP management achieved significant clinic SBP reductions, no change was observed in ambulatory BP. The more intensive intervention delivered in a cardiac rehabilitation setting provided even greater lowering of clinic BP as well as a large reduction in ambulatory BP and an improvement in CVD biomarkers.
The BP reductions in TRIUMPH are comparable to those observed with antihypertensive medications3 and were achieved without contributing to pill burden and the risk of medication interactions and untoward side effects.37 Participants in the C-LIFE intervention achieved more than a 12 mm reduction in clinic SBP, which was more than 5 mm Hg greater than the comparison group of patients who received the same lifestyle guidelines but had to achieve the behavioral changes on their own. Importantly, the majority of C-LIFE participants (59%) achieved the goal of clinic BP < 130/80 mm Hg after 4-months. Reductions in ambulatory BP also were greater for C-LIFE participants compared with SEPA controls, with C-LIFE participants showing a nearly 7 mm Hg greater reduction in 24-hour SBP, reflecting lowering of both daytime and nighttime pressures.
BP reductions of the magnitude observed in TRIUMPH are associated with improved cardiovascular outcomes in clinical trials with antihypertensive medications.38, and are as large or larger than those observed in previous lifestyle intervention trials conducted in patients on one or two antihypertensive medications. In the TONE trial, for example, patients in the combined lifestyle condition achieved a clinic BP reduction of −5.3/−3.4 mm Hg,39 and the 4-month lifestyle intervention employed in the ADAPT trial resulted in a reduction of −4.1/−2.1 mm Hg in ambulatory BP.40 In the PATHWAY-2 study of patients with RH, patients achieved an average reduction in home SBP of − 8.7 mm Hg with spironolactone, which was superior to placebo, bisoprolol, or doxazosin.5
It is difficult to compare the present findings with results from studies of renal denervation. The SYMPLICITY HTN-2 trial generated considerable optimism by suggesting that percutaneous renal sympathetic denervation could lower clinic SBP by as much as 30 mm Hg in RH patients.7 However, a subsequent, more rigorously designed study of renal denervation proved inconclusive.8 In the recently published RADIANCE-HTN TRIO study9, among RH patients with ABPM data at baseline and after treatment, ultrasound-based renal denervation was associated with a reduction of −9.4 mm Hg in 24-hour ambulatory SBP compared with −2.9 mm Hg in the sham control group. These results are comparable to those observed in TRIUMPH (−7.0 [95% CI: −8.5, −4.0] mm Hg in C-LIFE and −0.3 [95% CI: −4.0, 3.4] mm Hg in SEPA).
In addition to evaluating the effects of lifestyle modifications on clinic and ambulatory BP, TRIUMPH examined changes in a constellation of cardiovascular biomarkers. C-LIFE participants achieved significant improvements in FMD, BRS and HF-HRV, all of which are associated with CVD risk41–47 Although TRIUMPH was not powered to assess adverse CVD events, improvement in these surrogate endpoints suggests that lifestyle modifications may result in improved clinical outcomes41, 48.
Limitations.
Because TRIUMPH was conducted at a single site, there may be concerns about the generalizability of these findings. However, the intervention was delivered at multiple cardiac rehabilitation facilities in central North Carolina, with broad representation of minorities and individuals with varied educational and cultural backgrounds. Thus, the beneficial effects of structured lifestyle interventions on BP and CVD risk factors are likely to be achieved across a broad range of patients. Only five TRIUMPH participants had SBP > 160 mm Hg, so the efficacy of lifestyle modifications in patients with severe RH or refractory hypertension could not be definitively established. However, the effects of the intervention were not moderated by baseline SBP, suggesting that lifestyle changes may be effective in patients treated with multiple medications regardless of the magnitude of BP elevation. Because only a minority of participants were prescribed mineralocorticoid receptor antagonists (e.g., spironolactone or eplerenone), it could be argued that most patients were not on “maximal” medical therapy. Because medication non-adherence can lead to misdiagnosis of RH, we assessed adherence both by self-report and objectively using MEMS technology. Medication adherence appeared excellent in both groups, both before and after the intervention, but urine levels of antihypertensive medications and their metabolites were not measured, so adherence could not be confirmed with certainty. Although ambulatory BPs were not used to rule out ‘white coat’ hypertension (e.g., participants on 3 drugs and a clinic BP ≥ 130/80 mm Hg but an average 24-hour BP < 125/75 mmHg), a post-hoc analysis revealed that only 2 patients with elevated clinic BP may have had apparent RH due to the white coat phenomenon. All TRIUMPH participants were considered to have essential hypertension by their referring physicians, but it is possible that some had unrecognized secondary hypertension, especially primary hyperaldosteronism. A recent analysis in patients with RH demonstrated a high prevalence of renin-independent aldosterone production, regardless of the aldosterone-renin ratio49. Although both groups were similar on most baseline clinical and demographic characteristics, the SEPA group included more African Americans compared with C-LIFE; however, results were unchanged when race was included as a covariate in our analyses. The 4-month intervention might have been too short to produce clinically meaningful changes in some CVD biomarkers, and the extent to which improved health behaviors can be sustained without a structured program and ongoing accountability is uncertain. While the TRIUMPH lifestyle intervention is effective in reducing BP and improving important CVD biomarkers, there is an expense to delivering the intervention within the context of established cardiac rehabilitation programs, and the cost-effectiveness of the intensive lifestyle program will need to be evaluated.
CONCLUSIONS
Among a sample of 140 patients with RH, an intensive 4-month program of exercise and dietary modification as adjunctive therapy delivered in a cardiac rehabilitation setting resulted in improved BP control in patients with RH. These findings suggest that successful lifestyle changes can best be accomplished by a comprehensive, multidisciplinary team of health professionals within the established infrastructure of cardiac rehabilitation. Results of the TRIUMPH study suggest that policymakers should consider RH as a new indication for cardiac rehabilitation with appropriate coverage by governmental agencies and private insurers.
Supplementary Material
CLINICAL PERSPECTIVE.
WHAT IS NEW?
The effect of lifestyle modifications on blood pressure in patients with resistant hypertension is not known.
This is the first study to show that a structured and supervised program of lifestyle modifications can reduce blood pressure and improve important CVD biomarkers in patients with resistant hypertension.
WHAT ARE THE CLINICAL IMPLICATIONS?
Patients with resistant hypertension can successfully adopt a healthy eating plan, lose weight, and improve their aerobic fitness by participating in a structured program delivered in a cardiac rehabilitation setting.
Lifestyle modification including adoption of the DASH diet with caloric restriction and reduced salt consumption and regular aerobic exercise can significantly lower blood pressure and improve CVD biomarkers.
ACKNOWLEDGEMENTS
We wish to express our appreciation to the members of our Data and Safety Monitoring Board, Diane Catellier Ph.D., David Sheps MD, and Robert Carney, PhD. We also want to thank Mohan Chilukuri, MD, Paula Miller MD, Dwayne Callwood, MD, and J. Stewart Jones, DO for their assistance in patient recruitment. We also thank our research staff including Nicholas Johnson MS, Margaret Deishmeister MS, Beth Drossman MS, Natalie Hamilton BA, Catherine Wu MS, Michael Ellis RDMAS, RVT, Jeanne Schwartz PA-C, and Yidan Zhu, PhD.
The corresponding author (JAB) had full access to all data and takes responsibility for the integrity of the data and for the accuracy of the data analysis.
Study concept and design: Blumenthal, Sherwood, Hinderliter.
Acquisition of data: Blumenthal, Mabe, Sherwood, Watkins, Hinderliter, Kraus, Liao
Analysis and interpretation of data: Blumenthal, Smith, Sherwood, Hinderliter, Watkins, Lin.
Drafting of the manuscript: Blumenthal, Smith, Sherwood, Hinderliter.
Critical revision of the manuscript for important intellectual content: Blumenthal, Sherwood, Smith, Hinderliter, Lin, Craighead, Ingle, Watkins, Kraus, Liao.
Statistical analysis: Smith.
Obtained funding: Blumenthal, Sherwood, Hinderliter.
Administrative, technical, or material support: Blumenthal, Sherwood, Hinderliter, Mabe, Kraus, Ingle, Liao,
Study supervision: Blumenthal, Sherwood, Hinderliter, Mabe, Craighead, Lin, Watkins, Kraus.
Funding Source:
Supported by Grants HL122836 and HL130237 from the National Heart, Lung, and Blood Institute, National Institutes of Health, Bethesda, MD.
Role of the Sponsor:
The sponsor had no role in the study design, data acquisition, data analysis, interpretation of results, or writing of this manuscript.
Abbreviations and Acronyms:
- BP
Blood pressure
- BRS
Baroreflex sensitivity
- CI
Confidence interval
- C-LIFE
Center-based lifestyle intervention
- DBP
Diastolic blood pressure
- DDD
Daily defined dose
- HF-HRV
High frequency heart rate variability
- PWV
Pulse wave velocity
- RH
Resistant hypertension
- SBP
Systolic blood pressure
- SEPA
Standard education and physician advice
Footnotes
Conflicts of Interest Disclosures: None
Supplemental Materials:
Expanded Methods
Supplemental Tables I-II
References
- 1.Carey RM, Calhoun DA, Bakris GL, Brook RD, Daugherty SL, Dennison-Himmelfarb CR, Egan BM, Flack JM, Gidding SS, Judd E, et al. Resistant Hypertension: Detection, Evaluation, and Management: A Scientific Statement From the American Heart Association. Hypertension. 2018;72:e53–e90. [DOI] [PMC free article] [PubMed] [Google Scholar]
- 2.Noubiap JJ, Nansseu JR, Nyaga UF, Sime PS, Francis I and Bigna JJ. Global prevalence of resistant hypertension: a meta-analysis of data from 3.2 million patients. Heart. 2019;105:98–105. [DOI] [PubMed] [Google Scholar]
- 3.Calhoun DA, Jones D, Textor S, Goff DC, Murphy TP, Toto RD, White A, Cushman WC, White W, Sica D, et al. Resistant hypertension: diagnosis, evaluation, and treatment. A scientific statement from the American Heart Association Professional Education Committee of the Council for High Blood Pressure Research. Hypertension. 2008;51:1403–1419. [DOI] [PubMed] [Google Scholar]
- 4.Daugherty SL, Powers JD, Magid DJ, Tavel HM, Masoudi FA, Margolis KL, O’Connor PJ, Selby JV and Ho PM. Incidence and prognosis of resistant hypertension in hypertensive patients. Circulation. 2012; 125:1635–1642. [DOI] [PMC free article] [PubMed] [Google Scholar]
- 5.Williams B, MacDonald TM, Morant S, Webb DJ, Sever P, McInnes G, Ford I, Cruickshank JK, Caulfield MJ, Salsbury J, et al. Spironolactone versus placebo, bisoprolol, and doxazosin to determine the optimal treatment for drug-resistant hypertension (PATHWAY-2): a randomised, double-blind, crossover trial. Lancet. 2015;386:2059–2068. [DOI] [PMC free article] [PubMed] [Google Scholar]
- 6.Williams B, MacDonald TM, Morant SV, Webb DJ, Sever P, McInnes GT, Ford I, Cruickshank JK, Caulfield MJ, Padmanabhan S, et al. Endocrine and haemodynamic changes in resistant hypertension, and blood pressure responses to spironolactone or amiloride: the PATHWAY-2 mechanisms substudies. Lancet Diabetes Endocrinol. 2018;6:464–475. [DOI] [PMC free article] [PubMed] [Google Scholar]
- 7.Symplicity HTN-2 Investigators, Esler MD, Krum H, Sobotka PA, Schlaich MP, Schmieder RE and Bohm M. Renal sympathetic denervation in patients with treatment-resistant hypertension (The Symplicity HTN-2 Trial): a randomised controlled trial. Lancet. 2010;376:1903–1909. [DOI] [PubMed] [Google Scholar]
- 8.Bhatt DL, Kandzari DE, O’Neill WW, D’Agostino R, Flack JM, Katzen BT, Leon MB, Liu M, Mauri L, Negoita M, et al. A controlled trial of renal denervation for resistant hypertension. N Engl J Med. 2014;370:1393–1401. [DOI] [PubMed] [Google Scholar]
- 9.Azizi M, Sanghvi K, Saxena M, Gosse P, Reilly JP, Levy T, Rump LC, Persu A, Basile J, Bloch MJ, et al. Ultrasound renal denervation for hypertension resistant to a triple medication pill (RADIANCE-HTN TRIO): a randomised, multicentre, single-blind, sham-controlled trial. Lancet. 2021;397:2476–2486. [DOI] [PubMed] [Google Scholar]
- 10.Pimenta E, Gaddam KK, Oparil S, Aban I, Husain S, Dell’Italia LJ and Calhoun DA. Effects of dietary sodium reduction on blood pressure in subjects with resistant hypertension: results from a randomized trial. Hypertension. 2009;54:475–481. [DOI] [PMC free article] [PubMed] [Google Scholar]
- 11.Dimeo F, Pagonas N, Seibert F, Arndt R, Zidek W and Westhoff TH. Aerobic exercise reduces blood pressure in resistant hypertension. Hypertension. 2012;60:653–658. [DOI] [PubMed] [Google Scholar]
- 12.Eckel RH, Jakicic JM, Ard JD, de Jesus JM, Houston Miller N, Hubbard VS, Lee IM, Lichtenstein AH, Loria CM, Millen BE, et al. 2013 AHA/ACC guideline on lifestyle management to reduce cardiovascular risk: a report of the American College of Cardiology/American Heart Association Task Force on Practice Guidelines. Circulation. 2014;129:S76–S99. [DOI] [PubMed] [Google Scholar]
- 13.Carey RM. The management of resistant hypertension: A 2020 update. Prog Cardiovasc Dis. 2020; 63:662–670 [DOI] [PubMed] [Google Scholar]
- 14.Blumenthal JA, Sherwood A, Smith PJ, Mabe S, Watkins L, Lin PH, Craighead LW, Babyak M, Tyson C, Young K, et al. Lifestyle modification for resistant hypertension: The TRIUMPH randomized clinical trial. Am Heart J. 2015;170:986–994 e5. [DOI] [PMC free article] [PubMed] [Google Scholar]
- 15.Chobanian AV, Bakris GL, Black HR, Cushman WC, Green LA, Izzo JL Jr., Jones DW, Materson BJ, Oparil S, Wright JT Jr., et al. The Seventh Report of the Joint National Committee on Prevention, Detection, Evaluation, and Treatment of High Blood Pressure: the JNC 7 report. JAMA. 2003;289:2560–2572. [DOI] [PubMed] [Google Scholar]
- 16.Olivieri NF, Matsui D, Hermann C and Koren G. Compliance assessed by the Medication Event Monitoring System. Arch Dis Child. 1991;66:1399–1402. [DOI] [PMC free article] [PubMed] [Google Scholar]
- 17.McManus RJ, Mant J, Haque MS, Bray EP, Bryan S, Greenfield SM, Jones MI, Jowett S, Little P, Penaloza C, et al. Effect of self-monitoring and medication self-titration on systolic blood pressure in hypertensive patients at high risk of cardiovascular disease: the TASMIN-SR randomized clinical trial. JAMA. 2014;312:799–808. [DOI] [PubMed] [Google Scholar]
- 18.Goodwin J, Bilous M, Winship S, Finn P and Jones SC. Validation of the Oscar 2 oscillometric 24-h ambulatory blood pressure monitor according to the British Hypertension Society protocol. Blood Press Monit. 2007;12:113–117. [DOI] [PubMed] [Google Scholar]
- 19.O’Brien E, Parati G and Stergiou G. Ambulatory blood pressure measurement: what is the international consensus? Hypertension. 2013;62:988–994. [DOI] [PubMed] [Google Scholar]
- 20.Eck LH, Klesges RC, Hanson CL, Slawson D, Portis L and Lavasque ME. Measuring short-term dietary intake: development and testing of a 1-week food frequency questionnaire. J Am Diet Assoc. 1991;91:940–945. [PubMed] [Google Scholar]
- 21.Bazzano LA, He J, Ogden LG, Loria CM, Vupputuri S, Myers L and Whelton PK. Agreement on nutrient intake between the databases of the First National Health and Nutrition Examination Survey and the ESHA Food Processor. Am J Epidemiol. 2002;156:78–85. [DOI] [PubMed] [Google Scholar]
- 22.Epstein DE, Sherwood A, Smith PJ, Craighead L, Caccia C, Lin PH, Babyak MA, Johnson JJ, Hinderliter A and Blumenthal JA. Determinants and consequences of adherence to the dietary approaches to stop hypertension diet in African-American and white adults with high blood pressure: results from the ENCORE trial. J Acad Nutr Diet. 2012;112:1763–1773. [DOI] [PMC free article] [PubMed] [Google Scholar]
- 23.Luft FC, Sloan RS, Lang CL, Cohen SJ, Fineberg NS, Miller JZ and Weinberger MH. Influence of home monitoring on compliance with a reduced sodium intake diet. Arch Intern Med. 1984;144:1963–1965. [PubMed] [Google Scholar]
- 24.Blumenthal JA, Rejeski WJ, Walsh-Riddle M, Emery CF, Miller H, Roark S, Ribisl PM, Morris PB, Brubaker P and Williams RS. Comparison of high- and low-intensity exercise training early after acute myocardial infarction. Am J Cardiol. 1988;61:26–30. [DOI] [PubMed] [Google Scholar]
- 25.Parati G, Casadei R, Groppelli A, Di Rienzo M and Mancia G. Comparison of finger and intra-arterial blood pressure monitoring at rest and during laboratory testing. Hypertension. 1989;13:647–655. [DOI] [PubMed] [Google Scholar]
- 26.Calabia J, Torguet P, Garcia M, Garcia I, Martin N, Guasch B, Faur D and Valles M. Doppler ultrasound in the measurement of pulse wave velocity: agreement with the Complior method. Cardiovasc Ultrasound. 2011;9:13. [DOI] [PMC free article] [PubMed] [Google Scholar]
- 27.Katona PG and Jih F. Respiratory sinus arrhythmia: noninvasive measure of parasympathetic cardiac control. J Appl Physiol. 1975;39:801–805. [DOI] [PubMed] [Google Scholar]
- 28.Corretti MC, Anderson TJ, Benjamin EJ, Celermajer D, Charbonneau F, Creager MA, Deanfield J, Drexler H, Gerhard-Herman M, Herrington D, et al. Guidelines for the ultrasound assessment of endothelial-dependent flow-mediated vasodilation of the brachial artery: a report of the International Brachial Artery Reactivity Task Force. J Am Coll Cardiol. 2002;39:257–265. [DOI] [PubMed] [Google Scholar]
- 29.Celermajer DS, Sorensen KE, Bull C, Robinson J and Deanfield JE. Endothelium-dependent dilation in the systemic arteries of asymptomatic subjects relates to coronary risk factors and their interaction. J Am Coll Cardiol. 1994;24:1468–1474. [DOI] [PubMed] [Google Scholar]
- 30.de Simone G, Daniels SR, Devereux RB, Meyer RA, Roman MJ, de Divitiis O and Alderman MH. Left ventricular mass and body size in normotensive children and adults: assessment of allometric relations and impact of overweight. J Am Coll Cardiol. 1992;20:1251–1260. [DOI] [PubMed] [Google Scholar]
- 31.O’Brien PC. Procedures for comparing samples with multiple endpoints. Biometrics. 1984;40:1079–1087. [PubMed] [Google Scholar]
- 32.Organia EG, Pangandaman HK, Adap DM, Lambayong JHC, Mukattil NP, Macarambon RD, Macalnas AD, Alauya-Dica AA, Sadang JM and Mejia PCG. A Systematic Review on the Effectiveness of Lifestyle Modifications in the Management of Hypertension. Int J Health Med Cur. 2019;4:1550–1564. [Google Scholar]
- 33.Valenzuela PL, Carrera-Bastos P, Galvez BG, Ruiz-Hurtado G, Ordovas JM, Ruilope LM and Lucia A. Lifestyle interventions for the prevention and treatment of hypertension. Nat Rev Cardiol. 2021;18:251–275. [DOI] [PubMed] [Google Scholar]
- 34.Hiremath S, Sapir-Pichhadze R, Nakhla M, Gabor JY, Khan NA, Kuyper LM, Ruzicka M, Tobe SW, Tran K, Rabi DM et al. Hypertension Canada’s 2020 Evidence Review and Guidelines for the Management of Resistant Hypertension. Can J Cardiol. 2020;36:625–634. [DOI] [PubMed] [Google Scholar]
- 35.McMahon EJ, Bauer JD, Hawley CM, Isbel NM, Stowasser M, Johnson DW and Campbell KL. A randomized trial of dietary sodium restriction in CKD. J Am Soc Nephrol. 2013;24:2096–2103. [DOI] [PMC free article] [PubMed] [Google Scholar]
- 36.Guimaraes GV, Cruz LG, Tavares AC, Dorea EL, Fernandes-Silva MM and Bocchi EA. Effects of short-term heated water-based exercise training on systemic blood pressure in patients with resistant hypertension: a pilot study. Blood Press Monit. 2013;18:342–345. [DOI] [PubMed] [Google Scholar]
- 37.Blumenthal JA, Babyak MA, Hinderliter A, Watkins LL, Craighead L, Lin PH, Caccia C, Johnson J, Waugh R and Sherwood A. Effects of the DASH diet alone and in combination with exercise and weight loss on blood pressure and cardiovascular biomarkers in men and women with high blood pressure: the ENCORE study. Arch Intern Med. 2010;170:126–135. [DOI] [PMC free article] [PubMed] [Google Scholar]
- 38.Ettehad D, Emdin CA, Kiran A, Anderson SG, Callender T, Emberson J, Chalmers J, Rodgers A and Rahimi K. Blood pressure lowering for prevention of cardiovascular disease and death: a systematic review and meta-analysis. Lancet. 2016;387:957–967. [DOI] [PubMed] [Google Scholar]
- 39.Whelton PK, Appel LJ, Espeland MA, Applegate WB, Ettinger WH Jr., Kostis JB, Kumanyika S, Lacy CR, Johnson KC, Folmar S et al. Sodium reduction and weight loss in the treatment of hypertension in older persons: a randomized controlled trial of nonpharmacologic interventions in the elderly (TONE). TONE Collaborative Research Group. JAMA. 1998;279:839–846. [DOI] [PubMed] [Google Scholar]
- 40.Burke V, Beilin LJ, Cutt HE, Mansour J, Wilson A and Mori TA. Effects of a lifestyle programme on ambulatory blood pressure and drug dosage in treated hypertensive patients: a randomized controlled trial. J Hypertens. 2005;23:1241–1249. [DOI] [PubMed] [Google Scholar]
- 41.Matsuzawa Y, Kwon TG, Lennon RJ, Lerman LO and Lerman A. Prognostic Value of Flow-Mediated Vasodilation in Brachial Artery and Fingertip Artery for Cardiovascular Events: A Systematic Review and Meta-Analysis. J Am Heart Assoc. 2015;4:e002270. [DOI] [PMC free article] [PubMed] [Google Scholar]
- 42.Takase B, Matsushima Y, Uehata A, Ishihara M and Kurita A. Endothelial dysfunction, carotid artery plaque burden, and conventional exercise-induced myocardial ischemia as predictors of coronary artery disease prognosis. Cardiovasc Ultrasoun.2008;6:61. [DOI] [PMC free article] [PubMed] [Google Scholar]
- 43.Muiesan ML, Salvetti M, Paini A, Monteduro C, Galbassini G, Poisa P, Porteri E, Agabiti-Rosei C, Paderno V, Belotti E, et al. Prognostic role of flow-mediated dilatation of the brachial artery in hypertensive patients. J Hypertens. 2008;26:1612–1618. [DOI] [PubMed] [Google Scholar]
- 44.Ormezzano O, Cracowski JL, Quesada JL, Pierre H, Mallion JM and Baguet JP. EVAluation of the prognostic value of BARoreflex sensitivity in hypertensive patients: the EVABAR study. J Hypertens. 2008;26:1373–1378. [DOI] [PubMed] [Google Scholar]
- 45.Hillebrand S, Gast KB, de Mutsert R, Swenne CA, Jukema JW, Middeldorp S, Rosendaal FR and Dekkers OM. Heart rate variability and first cardiovascular event in populations without known cardiovascular disease: meta-analysis and dose-response meta-regression. Europace. 2013;15:742–749. [DOI] [PubMed] [Google Scholar]
- 46.Tsuji H, Larson MG, Venditti FJ Jr., Manders ES, Evans JC, Feldman CL and Levy D. Impact of reduced heart rate variability on risk for cardiac events. The Framingham Heart Study. Circulation. 1996;94:2850–2855. [DOI] [PubMed] [Google Scholar]
- 47.La Rovere MT, Pinna GD, Hohnloser SH, Marcus FI, Mortara A, Nohara R, Bigger JT, Camm AJ and Schwartz PJ. Baroreflex sensitivity and heart rate variability in the identification of patients at risk for life-threatening arrhythmias - Implications for clinical trials. Circulation. 2001;103:2072–2077. [DOI] [PubMed] [Google Scholar]
- 48.Ras RT, Streppel MT, Draijer R and Zock PL. Flow-mediated dilation and cardiovascular risk prediction: a systematic review with meta-analysis. Int J Cardiol. 2013;168:344–351. [DOI] [PubMed] [Google Scholar]
- 49.Brown JM, Siddiqui M, Calhoun DA, Carey RM, Hopkins PN, Williams GH and Vaidya A. The Unrecognized Prevalence of Primary Aldosteronism: A Cross-sectional Study. Ann Intern Med. 2020;173:10–20. [DOI] [PMC free article] [PubMed] [Google Scholar]
Associated Data
This section collects any data citations, data availability statements, or supplementary materials included in this article.