Abstract
Background
Intravascular ultrasound (IVUS) provides good insight into lumen boundary and plaques; however, it is still difficult to detect functionally significant stenosis from IVUS images for the guidance of coronary percutaneous intervention (PCI). This study aimed to develop a novel method to estimate fractional flow reserve (FFR) value for determining the functional significance of coronary artery disease through the fusion of IVUS and X-ray angiographic images.
Methods
We developed a novel approach to 3D vessel reconstruction by integrating IVUS with X-ray angiographic images. Based on the reconstructed geometry and the inlet flow derived from the thrombolysis in myocardial infarction (TIMI) frame count, a simplified fluid dynamics equation was established to compute the pressure drop and IVUS-derived FFR (AccuFFRivus) was subsequently obtained. To validate the feasibility and performance of this IVUS-based FFR method, we performed AccuFFRivus calculations on 32 coronary vessels with invasive FFR as the reference standard.
Results
Great correlation (r=0.86, P<0.001) was observed between AccuFFRivus and FFR. The area under the receiver-operating characteristic curve (AUC) was higher for AccuFFRivus than minimal lumen area (MLA, <4 mm2) and diameter stenosis rate (DS% ≥50%) [0.98 (95% CI: 0.86 to 1.0) vs. 0.78 (95% CI: 0.60 to 0.91) and 0.66 (95% CI: 0.47 to 0.82)]. Bland-Altman plot showed a mean difference value of –0.011 (limits of agreement: –0.156 to 0.134).
Conclusions
AccuFFRivus is a novel method for hybridizing IVUS and X-ray angiographic images to identify functionally significant stenosis with FFR ≤0.80. The good diagnostic performance from the initial validation study demonstrates the potential for clinical utilization of physiologically guided decision-making. Further validation is required in future studies with a large number of cases.
Keywords: Intravascular ultrasound (IVUS), X-ray angiography, coronary vessel reconstruction, fractional flow reserve (FFR)
Introduction
Coronary artery imaging is of great value in the diagnosis of coronary artery disease. Non-invasive and invasive imaging methods, such as coronary computed tomography angiography (CTA), magnetic resonance angiography (MRA), coronary angiography (CAG), intravascular ultrasound (IVUS), and optical coherence tomography (OCT), visualize the structure of the arterial lumen, plaque, and vessel wall.
In the clinical setting, decision-making for coronary percutaneous intervention (PCI) is guided by fractional flow reserve (FFR), which is considered the gold standard and measured by introducing a pressure wire into the coronary artery. Several studies have emphasized that functional assessment of FFR can improve clinical outcomes and reduce unnecessary revascularizations (1,2). Taylor et al. (3) proposed a simulation method to compute the FFR of the coronary arteries by using CTA images. Tu et al. (4) developed a rapid computational method of FFR, denoted as quantitative flow ratio (QFR) from 3-dimensional (3D) quantitative coronary angiography (QCA). Ha et al. (5) and Lee et al. (6) presented an algorithm to compute OCT-based FFR. Images from IVUS have higher resolution than coronary CTA and X-ray angiography. Furthermore, IVUS is already currently more widely applied than OCT. Thus, it is of clinical importance to develop the IVUS-based FFR technique. This study aimed to introduce a new method for calculating FFR from IVUS and CAG, called AccuFFRivus.
In this study, we segmented accurate lumen boundaries from IVUS images via the deep learning method. The path of the IVUS catheter was extracted from coronary angiographic images. Then, IVUS images were combined with the catheter path to merge into a 3D coronary arterial geometry. To calculate the coronary FFR, a simplified pressure-drop formula was used in the coronary artery geometry. To demonstrate the method's validity, we compared AccuFFRivus results with clinically measured FFR for 32 vessels from 31 patients.
Methods
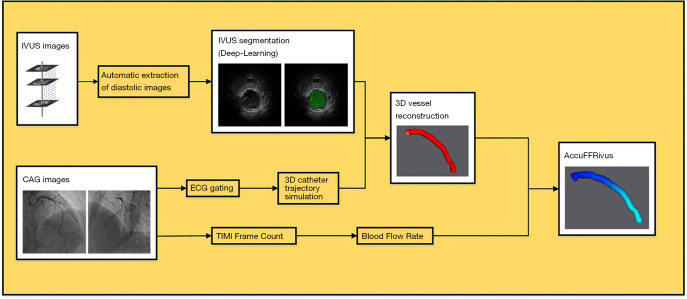
This article describes a new and robust method for 3D reconstruction of coronary arteries by fusing CAG and IVUS images and calculating patient-specific FFR. Comparison with invasive FFR measurements was made to validate the feasibility of this method. The overall flow chart of AccuFFRivus calculation is shown in Figure 1.
Figure 1.
Workflow for coronary artery reconstruction from CAG and IVUS images. CAG, coronary angiography; IVUS, intravascular ultrasound.
Study population
To validate the method described above, we recruited 34 patients with both IVUS and FFR measurements available. The study was conducted in accordance with the Declaration of Helsinki (as revised in 2013). The Ethics Committee approved the study of the Second Affiliated Hospital of Zhejiang University School of Medicine. Informed consent for participants was waived due to the retrospective nature of the study. Patients were excluded from computational analysis if they presented: (I) IVUS images with vessel spasm or injury during IVUS imaging; (II) too short IVUS pullback that the IVUS was not covering the whole lesion; (III) X-ray images with too low quality that the vessel boundary could not be clearly distinguished; (IV) X-ray images without 2 appropriate angles or with severe overlapping; (V) location mismatch between AccuFFRivus and FFR measurement.
X-ray angiographic image processing
Electrocardiogram gating and geometry parameter calibration
This method started with standard angiographic images, and multiple views of the angiographic image series were essential. Only 2 matched images captured from 2 different views in the same cardiac phase generated an accurate vessel model. For this purpose, the ECG signal simultaneously acquired in image acquisition was considered to determine the appropriate cardiac phase. Conventionally, the phases with the least cardiac motion are the optimal choices for vessel model reconstruction, typically derived at the end-diastole of the cardiac phase.
For each spatial point, the projections in different views may fail to correspond due to various reasons. It is necessary to calibrate the image acquisition parameters after selecting X-ray angiographic images of the same cardiac phase. For the X-ray angiography system, an effective and robust calibration method was adopted, in which the definition of 3 pairs of physiological points was needed. This calibration method can eliminate geometrical errors and achieve optimal correspondence between the 2 images.
Segmentation of angiographic data
Different methods and algorithms are available for angiographic image segmentation, aiming to identify the vessel lumen borders and visualize them in the angiograms. The implementation of this method requires ascertainment of the approximate centerline of the target vessel segment. After that, the original image can be resampled along scanlines perpendicular to the centerline. Using the reciprocal of the weighted sum of the first-derivative and second-derivative values of the brightness profile along the scanline, we generated a cost image for the further minimal path algorithm.
Among all the resampled points in the cost image, the points belonging to the lumen borders tend to have a lower cost value, so we defined the starting point as the point with the lowest cost value in the first scanline and the ending point in the last scanline. The vessel lumen borders were determined using the Dijkstra minimum path algorithm (7,8) and could be adjusted if needed.
3D lumen outline
We proposed an algorithm for the 3D reconstruction of coronary arteries from 2 views of uncalibrated angiographic images based on the finite projective camera model and existing optimization methods.
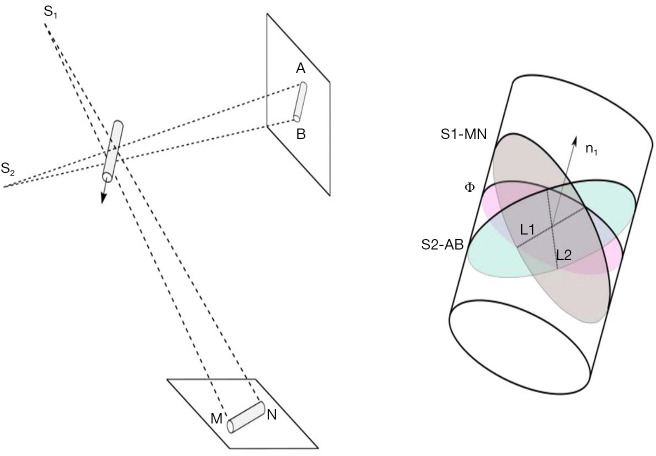
After calibrating the image acquisition parameters, the estimation of the centerline in 3D space was direct and straightforward. Each centerline point in 3D space corresponded to 2 different projection planes defined by different X-ray source positions. As shown in Figure 2, the plane Ф represents a plane at the centerline point with a normal vector parallel to the local centerline tangent, and plane S1-MN intersects with plane Ф at line L1. Similarly, S2-AB intersects with plane Ф at line L2, and Line L1 and L2 intersect mutually. This cross geometry is composed of 4-vessel boundary key points in the cross-section of this centerline point. Scanning from the proximal vessel segment points to the distal segment points finally constructs the whole vessel lumen point cloud.
Figure 2.
Construction of vessel lumen point cloud.
The result of the point cloud after downsampling is shown in Figure 3. From the figure, it can be distinguished that the vascular point cloud is in a layered pattern. The vessel retained rich surface details and sufficient surface smoothness.
Figure 3.
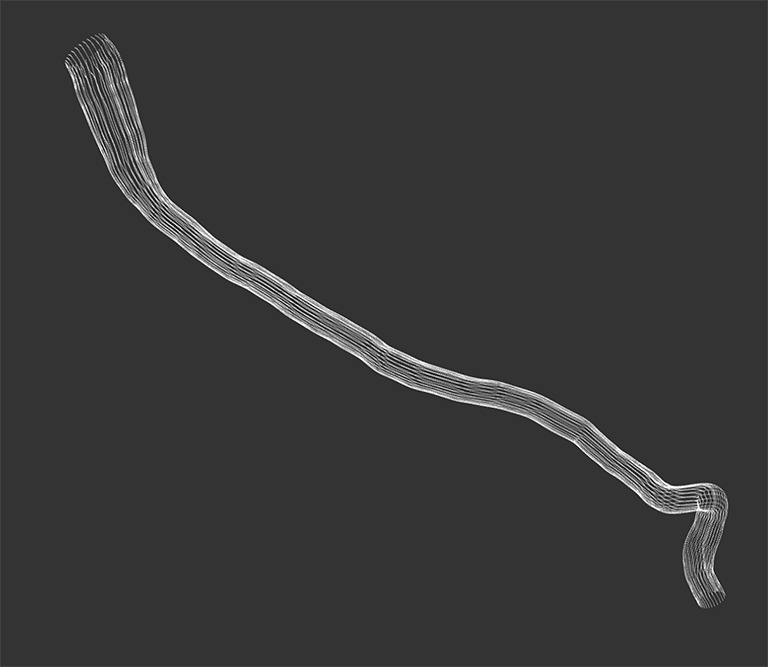
Vessel lumen point cloud after downsampling.
Estimation of catheter
The trajectory of the IVUS catheter in the vascular vessel was derived based on the graph theory algorithm (9). This catheter trajectory and spatial location are specified in the 3D vessel model, segmented based on the angiographic images. The physical model of the catheter is interpreted as infinite connecting points and bonding energy. Firstly, several flat cross-sections in spatial proximity were constructed by the vascular vessel stacked along the vessel centerline. It is worth noting that any adjacent cross-sections should not intersect with each other. Since the trajectory simulation requires minimal energy calculation, each round flat cross-section should be expressed as a point cloud.
For points on each cross-section, the internal energy H contains elastic energy He and potential energy Hp. Elastic energy was defined as He=θ2. For any spatial sample points mi-1, mi, mi+1, angle θ is the angle between a vector with . Hp represents potential energy, which is proportional to the square of the vascular deformation, and was defined as: . In this equation, k defines the local curvature at the sample point , and stands for the distance from the points to centerline .
The next step was deemed to be the calculation of the trajectory of the catheter according to the principle of minimum energy. The discrete spatial points connection could be converted into the problem of connecting edges in the corresponding graph, which was equivalent to the single-source minimal path problem. The position of guidewire was extracted using the Dijkstra algorithm (8). The minimized energy equaled the sum of the internal energy in all connected edges. By using the above algorithm, the edges could be located in the spatial position imitating the catheter trajectory.
IVUS image processing
Cardiac phase selection
Massive IVUS images contain much information that is redundant for vascular vessel segmentation. In this article, a function s(n) is used to define a motion signal that measured the cardiac phase of the nth image. The signal function s(n) is defined with the following mathematical expression:
| [1] |
The signal in the equation is expressed as a linear weighted combination set of image features , and wi∈ (0,1) is defined as a weight factor of the image feature. The summation of is equal to 1.
In detail, 2 image features were chosen to characterize the cardiac phase in each IUVS frame. The first feature, represents a relation between 2 consecutive images:
| [2] |
where un(i,j) shows the intensity from the ith row and jth column, µn is defined as the mean value of the intensity of the nth frame, and σn is the standard deviation of the nth frame intensity. Moreover, H and W are defined as the height and width of the image. If 2 frames are both at the end-diastole cardiac phase, almost no movement exists. When inter-frame motion increases, the feature value difference between 2 frames increases.
Another feature sensitive to intensity distribution differences between adjacent frames was used for cardiac phase assessment. This second image feature was designed to measure the degree of blur in an image:
| [3] |
In this equation, ∇un measures the intensity distribution changes in image space with a large scale. The s(n) is generated by adequately combining these 2 image features, which can be normalized with the following equation:
| [4] |
where and N represents the number of images. From the last step, are positive and have the same order of magnitude are all ensured.
Under certain circumstances, the weighting factors can be simplified from 2 image features to 1 parameter. With the distribution parameter α, the weighting factor for feature 1 was defined as and for feature two . Then Eq. [1] can be expressed in the following equation:
| [5] |
Automatic IVUS segmentation
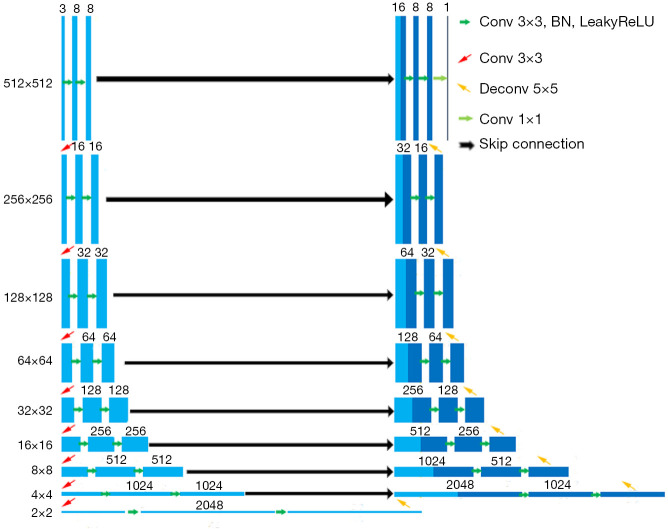
A U-Net (10) based pipeline was developed to segment the lumen of 2D IVUS images automatically (11). The pipeline contains 2 significant steps: (I) the MeshGrid data was enhanced by combining the flip and rotation operations of the original IVUS image; (II) the 8-layer deep U-Net was used for pixel-level prediction (Figure 4). The detailed description of the U-Net, encoder part, and model optimizer can be seen in the method section of our previous works (11). As a result, our current model showed better segmentation prediction of the lumen with MIoU of 0.948. The raw slice of an IVUS image, labeled image and our model’s predicted image of lumen are shown in Figure 5.
Figure 4.
The proposed U-Net Architecture with eight layers for IVUS segmentation. IVUS, intravascular ultrasound.
Figure 5.
The raw IVUS image, labeled image, and predicted image. IVUS, intravascular ultrasound.
Coronary artery modeling
Fusion of IVUS and X-ray angiographic images
It should be noted that the IVUS catheter twists and bends in the vascular vessel. Therefore, the catheter twists in different spatial angles and corresponds with the different relative orientations of the images. The morphological character of the vessel can only be guaranteed if the IVUS borders are stacked in the right orientation along the calculated guide wire trajectory; otherwise, incorrect vessel cross-sections in adjacent frames may lead to inaccurate 3D modeling. Thus, the catheter binormal direction can be calculated by a discrete method of the Frenet-Serret formulas. This method is effective for adjacent frames with orientation determination, and it gets the initial direction of the first image in this frameset. The accumulation of all these vessel border points in different layers in the definite orientation leads to them being merged into a point cloud, which can be extracted to generate the vascular model.
AccuFFRivus calculation
Average flow rate from frame count
Since the pressure drop has a positive correlation with the coronary flow rate, an accurate estimation of flow rate became the basis for calculating reliable FFR value. Without adding the cost of additional instruments, the frame count method was a relatively feasible solution. With the hypothesis that the blood flow rate is proportional to the square of the vessel diameter, flow rate velocity for FFR computation was derived from arterial geometrical characteristics and the number of frames in which the blood flowed from the proximal to distal aspect (12).
However, flow rate based exclusively on image information cannot represent the flow status during maximum hyperemia. A flow rate conversion relationship from the rest to the hyperemic state was applied to overcome this problem (13), which provides a possibility of measuring FFR without the use of adenosine.
Reference vessel diameter and FFR calculation algorithm
The central premise of the estimated FFR value is determining reference vessel diameter, which directly impacts stenosis recognition. Obviously, greater or longer stenosis tends to result in larger pressure drop and lower estimated FFR. The technique for determining a reference vessel diameter is denoted as interpolated percent diameter stenosis measurement (14). The blood vessel diameter curve was filtered by high frequency, and the linear fitting was utilized to determine the reference blood vessel diameter slope initially. After that, it may become achievable that 80% of points are below the reference diameter line (15).
In general, pressure drop from proximal to distal can be caused by 2 factors. The first is the viscous pressure drop which is related to friction. Briefly, longer and slimmer blood vessels cause a larger pressure drop. The second is the expansion pressure drop, mainly due to rapid change of radius, which is usually the characteristic of stenosis. Pressure drop ∆PR is related to viscous loss coefficient CVis, expansion loss coefficient CExpan, and flow rate Q:
| [6] |
Here, CVis and CExpan in Eq. [6] are dependent on the stenosis geometry and can be calculated as:
| [7] |
| [8] |
Here, KVis and KE are dimensionless coefficients, μ and ρ are absolute viscosity and density of blood. dNormal and ANormal are the diameter and cross-sectional area of the normal lumen. The AStenosis is the cross-sectional area at the stenosis.
Using Eqs. [7] and [8], Eq. [6] is rewritten as:
| [9] |
With estimated aortic pressure at hyperemia and pressure drop, AccuFFRivus values were determined from mean distal coronary pressure divided by mean proximal aortic pressure.
Statistical analysis
Continuous variables with mean ± standard deviation (SD) and binary variables were presented as percentages. Agreement between AccuFFRivus and invasive FFR was assessed by Pearson or Spearman correlation analysis. The area under the receiver-operating characteristic curve (AUC) of AccuFFRivus (≤0.8) was used to evaluate diagnostic performance. Minimal lumen area (MLA, <4 mm2), diameter stenosis (DS% ≥50%), and FFR ≤0.8 was taken as the reference standard (all calculated as values with corresponding 95% CI). Bland-Altman analysis and correlation were used to analyze the agreement between AccuFFRivus and invasive FFR. A 2-sided P value (<0.05) was regarded as statistically significant. All the statistical analyses were conducted using MedCalc (version 19.0, MedCalc Software, Ostend, Belgium).
Results
Baseline clinical and lesion characteristics
In all, 34 patients with 35 vessels who underwent invasive FFR, CAG, and IVUS were included in this study, among whom 3 patients with 3 vessels were excluded due to the low image quality of IVUS or CAG images or mismatch of IVUS and FFR measurement. The final study population comprised 31 participants with 32 vessels (Figure 6). The baseline clinical characteristics and vessel characteristics according to CAG, FFR, and IVUS are listed in Table 1. The lesions at the end for the algorithm validation were from 25 left anterior descending arteries (LAD), 1 left circumflex artery (LCx), and 6 right coronary arteries (RCA). The average invasive FFR was 0.80±0.11.
Figure 6.
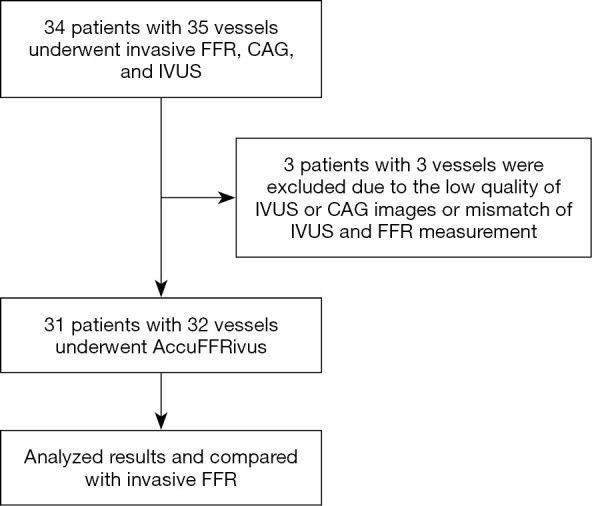
Participant flow chart of the study. FFR, fractional flow reserve; IVUS, intravascular ultrasound; CAG, coronary angiography.
Table 1. Baseline clinical characteristics and vessel characteristics according to CAG, FFR, and IVUS.
| Parameter | Number of participants (n=31) |
|---|---|
| Age (y) | 66±10 |
| Male | 71% [22] |
| Weight (kg) | 69±12 |
| Height (cm) | 165±10 |
| BMI (kg/m2) | 25±4 |
| Cardiovascular risk factors | |
| Systolic blood pressure (mm Hg) | 129±17 |
| Diastolic blood pressure (mm Hg) | 71±11 |
| Angina pectoris | 29% [9] |
| Diabetes | 32% [10] |
| Hypertension | 74% [23] |
| Hyperlipidemia | 9% [3] |
| Vessel location,% [n] | |
| LAD | 78% [25] |
| LCX | 3% [1] |
| RCA | 19% [6] |
| Invasive CAG and FFR,% [n] | |
| Stenosis degree <50% | 84% [27] |
| Stenosis degree ≥50% | 16% [5] |
| FFR ≤0.8 | 44% [14] |
| IVUS analysis | |
| Minimum lumen diameter (mm) | 1.82±0.35 |
| Maximum lumen diameter (mm) | 2.19±0.47 |
| Minimum lumen area (mm2) | 3.44±1.46 |
| Minimum EEM diameter (mm) | 3.59±0.64 |
| Maximum EEM diameter (mm) | 4.07±0.58 |
| EEM CSA (mm2) | 12.07±3.56 |
| Plaque burden (%) | 71±9 |
FFR, fractional flow reserve; IVUS, intravascular ultrasound; CAG, coronary angiography; BMI, body mass index; LAD, left anterior descending; LCX, left circumflex artery; RCA, right coronary artery; EEM, external elastic membrane; CSA, cross-sectional area.
Correlation between AccuFFRivus and FFR
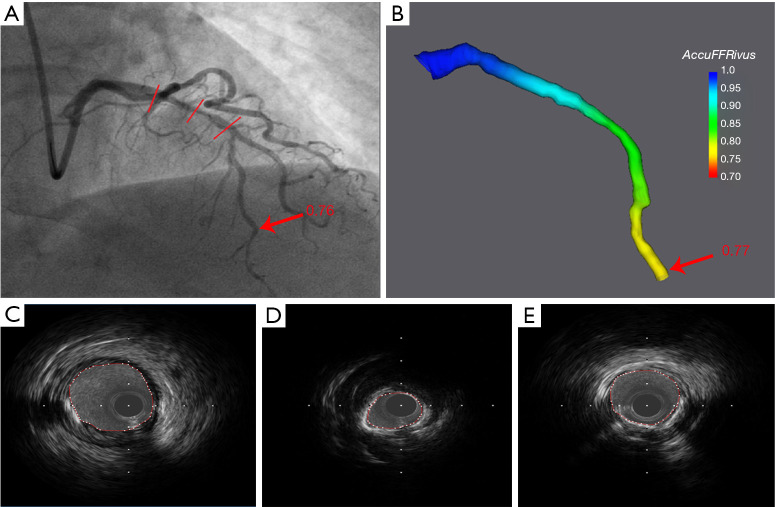
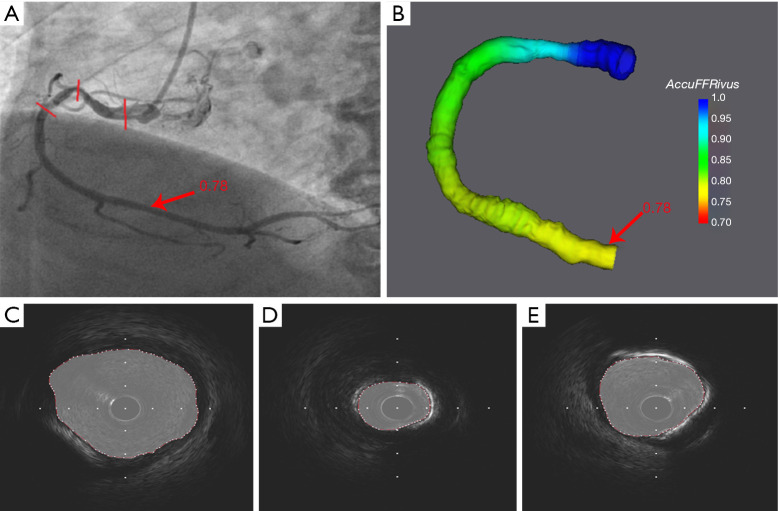
Representative examples of AccuFFRivus calculation for LAD and RCA with significant stenosis are shown in Figure 7 and Figure 8, where Figure 7C,D,E and Figure 8C,D,E show IVUS images with the minimum lumen and the automatic segmentation of lumen.
Figure 7.
Example of AccuFFRivus calculation of the LAD artery with a significant lesion in the middle part of LAD. (A) CAG showing significant lesion; (B) AccuFFRivus calculation result and IVUS images show the proximal lumen (C), minimum area lumen (D), lumen across the stenosis (E). LAD, left anterior descending; CAG, coronary angiography; IVUS, intravascular ultrasound.
Figure 8.
Example of AccuFFRivus calculation of the right coronary artery (RCA) with a significant lesion in the proximal. (A) CAG showing significant lesion; (B) AccuFFRivus calculation result and IVUS images show the proximal lumen (C), minimum area lumen (D), lumen across the stenosis (E). CAG, coronary angiography; IVUS, intravascular ultrasound.
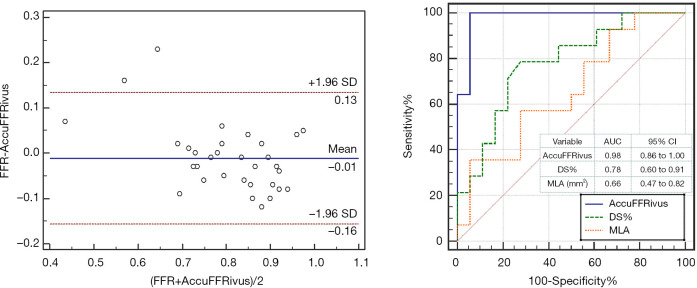
The agreement between AccuFFRivus and invasive FFR is shown in Figure 9. High correlation (r=0.86, P<0.001) between AccuFFRivus and FFR was observed.
Figure 9.
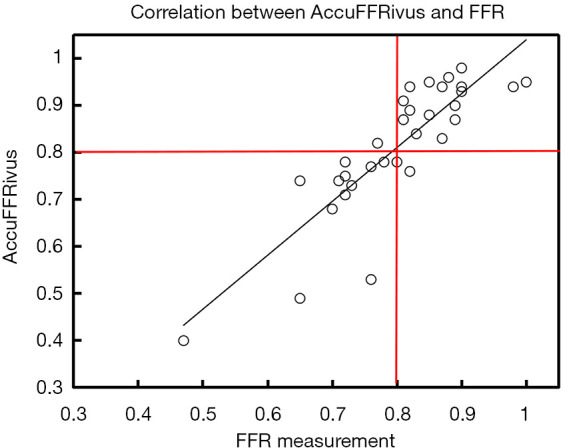
Correlation between wire-measured FFR and IVUS-derived FFR. IVUS, intravascular ultrasound.
Diagnosis Performance of AccuFFRivus
Diagnostic Performance of AccuFFRivus, DS%, and MLA (Per-vessel, n=32) are shown in Table 2. Using FFR ≤0.8 as a reference, diagnostic accuracy, sensitivity, specificity, positive predictive value (PPV), and negative predictive value (NPV) for AccuFFRivus was 93.75%, 92.86%, 94.44%, 92.86%, and 94.44%, respectively. The AUC for diagnosis of functionally significant coronary stenosis was higher for AccuFFRivus than MLA (<4 mm2) and diameter stenosis rate (DS% ≥50%) [0.98 (95% CI: 0.86 to 1.0) vs. 0.78 (95% CI: 0.60 to 0.91) and 0.66 (95% CI: 0.47 to 0.82)] as shown in Figure 10. Bland-Altman plot showed a mean difference value of –0.011 (limits of agreement: –0.156 to 0.134). The mean time for AccuFFRivus assessment (including 3D reconstruction based on IVUS images and frame count analysis) was 5.20±2.31 min.
Table 2. Diagnostic performance of AccuFFRivus, %DS, and MLA (Per-vessel) (n=32).
| AccuFFRivus ≤0.80 (95% CI) | DS% ≥50% (95% CI) | MLA <4 mm2 (95% CI) | |
|---|---|---|---|
| Accuracy | 93.75 (79.19–99.23) | 65.62 (46.81–81.43) | 53.12 (34.74–70.91) |
| Sensitivity | 92.86 (66.13–99.82) | 28.57 (8.39–58.10) | 57.14 (28.86–82.34) |
| Specificity | 94.44 (72.71–99.86) | 94.44 (72.71–99.86) | 50.00 (26.02–73.98) |
| Positive likelihood ratio | 16.71 (2.47–112.91) | 5.14 (0.64–41.04) | 1.14 (0.60–2.18) |
| Negative likelihood ratio | 0.08 (0.01–0.50) | 0.76 (0.53–1.07) | 0.86 (0.40–1.83) |
| Positive predictive value | 92.86 (65.81–98.87) | 80.00 (33.39–96.96) | 47.06 (31.75–62.94) |
| Negative predictive value | 94.44 (71.93–99.12) | 62.96 (54.51–70.69) | 60.00 (41.20–76.25) |
Figure 10.
The AUC and Bland-Altman plots between IVUS-derived FFR (AccuFFRivus) and clinically measured-FFR for the same vessels. AUC, area under curve; IVUS, intravascular ultrasound; FFR, fractional flow reserve.
Discussion
As an important complement to CAG, IVUS imaging improves the accuracy of diagnosis and plays an essential guiding role in PCI strategy, stent selection, and the effect evaluation of PCI. Despite the effort to determine the IVUS criteria with MLA, IVUS-derived MLA does not always equate with functional significance (16). The optimal cutoff value of MLA <2.4 mm2 was determined to detect FFR <0.80 and improved diagnostic accuracy from 64% to 76% compared with MLA <4 mm2.
A few studies have explored the feasibility of IVUS-derived FFR by computational fluid dynamic (CFD) simulation in improving the diagnostic accuracy for the functional assessment of coronary lesions. As early as 2014, Carrizo et al. reconstructed a single coronary LAD vessel from acquired IVUS images and applied CFD to calculate FFR (17). A comparison study of blood flow simulation based on CCTA-derived and IVUS-derived geometric models was performed involving 11 patients with 16 arteries (18). In another study with 24 participants (34 vessels), a new IVUSFR parameter performed better than MLA or angiography on ischemia detection with an overall accuracy, sensitivity, and specificity of 91%, 89%, and 92%, respectively (19). However, the target vessel with each arterial bifurcation should be reconstructed for CFD simulation, and the median time of 9.1 hours (7.9–12 hours) was consumed per studied vessel. Wang et al. (20) presented another algorithm for calculating FFR based on 3D reconstruction from CAG and IVUS images. During CFD simulation, the mean volumetric flow rate coupled at the inlet of a single vessel was constant, in which case the law of conservation of mass was violated. Despite the performance of IVUS-derived FFR illustrated on ischemia detection, its clinical applications are limited by time-consuming CFD computation. To address this issue, a supervised machine learning (ML) algorithm based on IVUS was proposed to identify lesions with an FFR ≤ of 0.80 (21). Random forest and Adaboost had the highest diagnostic accuracy of 83%. These binary classifiers failed to provide quantitative analysis for the functional significance of intermediate coronary stenosis.
This study developed a novel method for fast computation of FFR from the fusion of coronary IVUS and X-ray angiographic images. A high correlation between AccuFFRivus and invasive FFR was observed (r=0.86, P<0.001). The AUC was higher for AccuFFRivus than MLA and DS% (0.98 vs. 0.78 and 0.66, respectively). A small mean difference value of –0.011 was observed from the Bland-Altman plot.
We applied a pre-trained deep learning model for fast and accurate lumen boundary detection derived from IVUS images, while the catheter path and blood flow rate were obtained from CAG. Here, we integrated IVUS images and CAG to derive a more accurate FFR. Compared with CAG, more accurate lumen boundaries could be extracted automatically from IVUS images by deep learning. Then, segmented lumen boundaries were fused with the catheter path simulated from CAG to reconstruct an accurate vascular model. This method can eliminate the error from the catheter twist, which may enlarge the lumen border. Next, after calculating vessel-specific flow rate by thrombolysis in myocardial infarction (TIMI) frame count, simplified pressure drop formula was coupled to the geometry to compute FFR. Due to the contribution of the deep learning method and simplified CFD, the time spent on FFR computation can be reduced to 5 min per vessel.
Invasive FFR measurement is currently the gold standard for functional evaluation of coronary stenosis, and the computational accuracy based on different images is based on the comparison of invasive FFR. The functional evaluation based on coronary CT is the most widely used among the 3 FFR calculation methods based on different types of images. Its evaluation accuracy is greatly improved compared with the anatomical evaluation method based on CTA (22). It can play the role of “gatekeeper” of the catheter room and be made into a screening tool for functional significance for coronary artery disease (23,24). The disadvantage of FFR-CT is that its accuracy may be low in the diagnosis of some complex calcified lesions.
Moreover, it is difficult to segment CTA images because of coronary artery calcification, which leads to difficulty in FFR calculation (25). Functional evaluation based on coronary angiography and intravascular imaging is limited to use in the catheter room. The accuracy is generally improved compared with that based on coronary CTA, especially the FFR analysis system based on intravascular imaging can achieve the highest accuracy. Because they have more accurate 3D reconstruction image data than CAG, a 3D reconstruction based on CAG is generally based on angiography images from 2 angles (26). In contrast, a reconstruction based on intravascular imaging is based on a 3D scan image with the actual structure of the vessel lumen (27). Theoretically, its 3D reconstruction model will have higher accuracy. The structure of the coronary vessel lumen can only be approximated, and the diagnostic accuracy for functional significance was 86% (13), 86.3% (26), and 92.4% (28), according to 3 clinical study reports. As an important complement to CAG, IVUS/OCT imaging improves the accuracy of diagnosis. The 3D coronary artery model reconstructed by IVUS/OCT image contained real structure of vascular lumen (27,29) because the resolution of IVUS/OCT is much higher than that of an angiography image, and the accuracy of these methods was equal to and larger than 90% (27) or 93.75% in this study.
There were some limitations to the current study. First, the research method was validated using only (29) vessels, and no left main arterial lesions were included in our analysis. Thus, the diagnostic performance of the IVUS-derived FFR should be more clearly validated through the solid investigation with a large number of samples and different lesion locations in the future study. Second, this IVUS-FFR algorithm is limited by the quality of IVUS images. If the IVUS images are not qualified, AccuFFRivus calculation is unavailable, or the accuracy could be affected. Third, since the IVUS images for deep learning training were acquired using a rotating 40-MHz transducer commercial scanner (Boston Scientific/SCIMED, Minneapolis, MN, USA), AccuFFRivus calculation can only support IVUS images with the same specifications.
Acknowledgments
Funding: This work was supported by the National Natural Science Foundation of China (81320108003, 31371498, 81100141, and 81570322), Zhejiang Provincial Public Welfare Technology Research Project (LGF20H020012), Zhejiang Provincial Key Research and Development Plan (2020C03016), the Major Projects in Wenzhou of China (2019ZG0107), the Major Projects in Jinhua of China (2020A31003), and the Scientific Research Project of Zhejiang Education Department (Y201330290).
Ethical Statement: The authors are accountable for all aspects of the work in ensuring that questions related to the accuracy or integrity of any part of the work are appropriately investigated and resolved. The study was conducted in accordance with the Declaration of Helsinki (as revised in 2013). It was approved by the Ethics Committees of the Second Affiliated Hospital of Zhejiang University School of Medicine. Due to the retrospective nature of the study, informed consent for participants was waived.
Open Access Statement: This is an Open Access article distributed in accordance with the Creative Commons Attribution-NonCommercial-NoDerivs 4.0 International License (CC BY-NC-ND 4.0), which permits the non-commercial replication and distribution of the article with the strict proviso that no changes or edits are made and the original work is properly cited (including links to both the formal publication through the relevant DOI and the license). See: https://creativecommons.org/licenses/by-nc-nd/4.0/.
Footnotes
Conflicts of Interest: All authors have completed the ICMJE uniform disclosure form (available at https://dx.doi.org/10.21037/qims-20-1324). The authors have no conflicts of interest to declare.
References
- 1.Fearon WF, Bornschein B, Tonino PA, Gothe RM, Bruyne BD, Pijls NH, Siebert U, Fractional Flow Reserve Versus Angiography for Multivessel Evaluation (FAME) Study Investigators . Economic evaluation of fractional flow reserve-guided percutaneous coronary intervention in patients with multivessel disease. Circulation 2010;122:2545-50. 10.1161/CIRCULATIONAHA.109.925396 [DOI] [PubMed] [Google Scholar]
- 2.Pijls NH, Fearon WF, Tonino PA, Siebert U, Ikeno F, Bornschein B, van't Veer M, Klauss V, Manoharan G, Engstrøm T, Oldroyd KG, Ver Lee PN, MacCarthy PA, De Bruyne B, FAME Study Investigators . Fractional flow reserve versus angiography for guiding percutaneous coronary intervention in patients with multivessel coronary artery disease: 2-year follow-up of the FAME (Fractional Flow Reserve Versus Angiography for Multivessel Evaluation) study. J Am Coll Cardiol 2010;56:177-84. 10.1016/j.jacc.2010.04.012 [DOI] [PubMed] [Google Scholar]
- 3.Taylor CA, Fonte TA, Min JK. Computational fluid dynamics applied to cardiac computed tomography for noninvasive quantification of fractional flow reserve: scientific basis. J Am Coll Cardiol 2013;61:2233-41. 10.1016/j.jacc.2012.11.083 [DOI] [PubMed] [Google Scholar]
- 4.Tu S, Barbato E, Köszegi Z, Yang J, Sun Z, Holm NR, Tar B, Li Y, Rusinaru D, Wijns W, Reiber JH. Fractional flow reserve calculation from 3-dimensional quantitative coronary angiography and TIMI frame count: a fast computer model to quantify the functional significance of moderately obstructed coronary arteries. JACC Cardiovasc Interv 2014;7:768-77. 10.1016/j.jcin.2014.03.004 [DOI] [PubMed] [Google Scholar]
- 5.Ha J, Kim JS, Lim J, Kim G, Lee S, Lee JS, Shin DH, Kim BK, Ko YG, Choi D, Jang Y, Hong MK. Assessing Computational Fractional Flow Reserve From Optical Coherence Tomography in Patients With Intermediate Coronary Stenosis in the Left Anterior Descending Artery. Circ Cardiovasc Interv 2016;9:e003613. Erratum in: Circ Cardiovasc Interv 2017;10:e000022. 10.1161/CIRCINTERVENTIONS.116.003613 [DOI] [PubMed] [Google Scholar]
- 6.Lee KE, Lee SH, Shin ES, Shim EB. A vessel length-based method to compute coronary fractional flow reserve from optical coherence tomography images. Biomed Eng Online 2017;16:83. 10.1186/s12938-017-0365-4 [DOI] [PMC free article] [PubMed] [Google Scholar]
- 7.van der Zwet PM, Reiber JH. A new approach for the quantification of complex lesion morphology: the gradient field transform; basic principles and validation results. J Am Coll Cardiol 1994;24:216-24. 10.1016/0735-1097(94)90566-5 [DOI] [PubMed] [Google Scholar]
- 8.Dijkstra EW. A note on two problems in connexion with graphs. Numer Math 1959;1:267-71. 10.1007/BF01386390 [DOI] [Google Scholar]
- 9.Schafer S, Singh V, Hoffmann KR, Noël PB, Xu J. Planning image-guided endovascular interventions: guidewire simulation using shortest path algorithms. Proceedings Volume 6509, Medical Imaging 2007: Visualization and Image-Guided Procedures. doi: 10.1117/12.709519. 10.1117/12.709519 [DOI] [Google Scholar]
- 10.Ronneberger O, Fischer P, Brox T. U-Net: Convolutional Networks for Biomedical Image Segmentation, 2015. arXiv:1505.04597. 10.1007/978-3-319-24574-4_28 [DOI]
- 11.Dong L, Jiang W, Lu W, Jiang J, Zhao Y, Song X, Leng X, Zhao H, Wang J, Li C, Xiang J. Automatic segmentation of coronary lumen and external elastic membrane in intravascular ultrasound images using 8-layer U-Net. Biomed Eng Online 2021;20:16. 10.1186/s12938-021-00852-0 [DOI] [PMC free article] [PubMed] [Google Scholar]
- 12.Gibson CM, Cannon CP, Daley WL, Dodge JT, Jr, Alexander B, Jr, Marble SJ, McCabe CH, Raymond L, Fortin T, Poole WK, Braunwald E. TIMI frame count: a quantitative method of assessing coronary artery flow. Circulation 1996;93:879-88. 10.1161/01.CIR.93.5.879 [DOI] [PubMed] [Google Scholar]
- 13.Tu S, Westra J, Yang J, von Birgelen C, Ferrara A, Pellicano M, Nef H, Tebaldi M, Murasato Y, Lansky A, Barbato E, van der Heijden LC, Reiber JHC, Holm NR, Wijns W, FAVOR Pilot Trial Study Group . Diagnostic Accuracy of Fast Computational Approaches to Derive Fractional Flow Reserve From Diagnostic Coronary Angiography: The International Multicenter FAVOR Pilot Study. JACC Cardiovasc Interv 2016;9:2024-35. 10.1016/j.jcin.2016.07.013 [DOI] [PubMed] [Google Scholar]
- 14.Serruys PW, Reiber JH, Wijns W, van den Brand M, Kooijman CJ, ten Katen HJ, Hugenholtz PG. Assessment of percutaneous transluminal coronary angioplasty by quantitative coronary angiography: diameter versus densitometric area measurements. Am J Cardiol 1984;54:482-8. 10.1016/0002-9149(84)90235-2 [DOI] [PubMed] [Google Scholar]
- 15.Kooijman CJ, Reiber JHC, Gerbrands JJ, Schuurbiers JCH, Slager CH, den Boer A, Serruys P. Computer-Aided Quantitation Of The Severity Of Coronary Obstructions From Single View Cineangiograms. Proceedings Volume 0375, Medical Imaging and Image Interpretation; 1st International Symposium on Medical Imaging and Image Interpretation, 1982, Berlin, Germany. [Google Scholar]
- 16.Kang SJ, Lee JY, Ahn JM, Mintz GS, Kim WJ, Park DW, Yun SC, Lee SW, Kim YH, Lee CW, Park SW, Park SJ. Validation of intravascular ultrasound-derived parameters with fractional flow reserve for assessment of coronary stenosis severity. Circ Cardiovasc Interv 2011;4:65-71. 10.1161/CIRCINTERVENTIONS.110.959148 [DOI] [PubMed] [Google Scholar]
- 17.Carrizo S, Xie X, Peinado-Peinado R, Sánchez-Recalde A, Jiménez-Valero S, Galeote-Garcia G, Moreno R. Functional assessment of coronary artery disease by intravascular ultrasound and computational fluid dynamics simulation. Rev Port Cardiol 2014;33:645.e1-4. 10.1016/j.repc.2014.03.013 [DOI] [PubMed] [Google Scholar]
- 18.Bulant CA, Blanco PJ, Maso Talou GD, Bezerra CG, Lemos PA, Feijóo RA. A head-to-head comparison between CT- and IVUS-derived coronary blood flow models. J Biomech 2017;51:65-76. 10.1016/j.jbiomech.2016.11.070 [DOI] [PubMed] [Google Scholar]
- 19.Bezerra CG, Hideo-Kajita A, Bulant CA, Maso-Talou GD, Mariani J, Jr, Pinton FA, Falcão BAA, Esteves-Filho A, Franken M, Feijóo RA, Kalil-Filho R, Garcia-Garcia HM, Blanco PJ, Lemos PA. Coronary fractional flow reserve derived from intravascular ultrasound imaging: Validation of a new computational method of fusion between anatomy and physiology. Catheter Cardiovasc Interv 2019;93:266-74. 10.1002/ccd.27822 [DOI] [PubMed] [Google Scholar]
- 20.Wang X, Peng C, Liu X, Pan Z. Functional Assessment of Stenotic Coronary Artery in 3D Geometric Reconstruction From Fusion of Intravascular Ultrasound and X-Ray Angiography. IEEE Access 2018;6:53330-41.
- 21.Lee JG, Ko J, Hae H, Kang SJ, Kang DY, Lee PH, Ahn JM, Park DW, Lee SW, Kim YH, Lee CW, Park SW, Park SJ. Intravascular ultrasound-based machine learning for predicting fractional flow reserve in intermediate coronary artery lesions. Atherosclerosis 2020;292:171-7. 10.1016/j.atherosclerosis.2019.10.022 [DOI] [PubMed] [Google Scholar]
- 22.Taylor CA, Fonte TA, Min JK. Computational fluid dynamics applied to cardiac computed tomography for noninvasive quantification of fractional flow reserve: scientific basis. J Am Coll Cardiol 2013;61:2233-41. 10.1016/j.jacc.2012.11.083 [DOI] [PubMed] [Google Scholar]
- 23.Koo BK, Erglis A, Doh JH, Daniels DV, Jegere S, Kim HS, Dunning A, DeFrance T, Lansky A, Leipsic J, Min JK. Diagnosis of ischemia-causing coronary stenoses by noninvasive fractional flow reserve computed from coronary computed tomographic angiograms. Results from the prospective multicenter DISCOVER-FLOW (Diagnosis of Ischemia-Causing Stenoses Obtained Via Noninvasive Fractional Flow Reserve) study. J Am Coll Cardiol 2011;58:1989-97. 10.1016/j.jacc.2011.06.066 [DOI] [PubMed] [Google Scholar]
- 24.Nørgaard BL, Leipsic J, Gaur S, Seneviratne S, Ko BS, Ito H, et al. Diagnostic performance of noninvasive fractional flow reserve derived from coronary computed tomography angiography in suspected coronary artery disease: the NXT trial (Analysis of Coronary Blood Flow Using CT Angiography: Next Steps). J Am Coll Cardiol 2014;63:1145-55. 10.1016/j.jacc.2013.11.043 [DOI] [PubMed] [Google Scholar]
- 25.Nørgaard BL, Gaur S, Leipsic J, Ito H, Miyoshi T, Park SJ, Zvaigzne L, Tzemos N, Jensen JM, Hansson N, Ko B, Bezerra H, Christiansen EH, Kaltoft A, Lassen JF, Bøtker HE, Achenbach S. Influence of Coronary Calcification on the Diagnostic Performance of CT Angiography Derived FFR in Coronary Artery Disease: A Substudy of the NXT Trial. JACC Cardiovasc Imaging 2015;8:1045-55. 10.1016/j.jcmg.2015.06.003 [DOI] [PubMed] [Google Scholar]
- 26.Westra J, Andersen BK, Campo G, Matsuo H, Koltowski L, Eftekhari A, et al. Diagnostic Performance of In-Procedure Angiography-Derived Quantitative Flow Reserve Compared to Pressure-Derived Fractional Flow Reserve: The FAVOR II Europe-Japan Study. J Am Heart Assoc 2018;7:e009603. 10.1161/JAHA.118.009603 [DOI] [PMC free article] [PubMed] [Google Scholar]
- 27.Yu W, Huang J, Jia D, Chen S, Raffel OC, Ding D, Tian F, Kan J, Zhang S, Yan F, Chen Y, Bezerra HG, Wijns W, Tu S. Diagnostic accuracy of intracoronary optical coherence tomography-derived fractional flow reserve for assessment of coronary stenosis severity. EuroIntervention 2019;15:189-97. 10.4244/EIJ-D-19-00182 [DOI] [PMC free article] [PubMed] [Google Scholar]
- 28.Xu B, Tu S, Qiao S, Qu X, Chen Y, Yang J, Guo L, Sun Z, Li Z, Tian F, Fang W, Chen J, Li W, Guan C, Holm NR, Wijns W, Hu S. Diagnostic Accuracy of Angiography-Based Quantitative Flow Ratio Measurements for Online Assessment of Coronary Stenosis. J Am Coll Cardiol 2017;70:3077-87. 10.1016/j.jacc.2017.10.035 [DOI] [PubMed] [Google Scholar]
- 29.Seike F, Uetani T, Nishimura K, Kawakami H, Higashi H, Fujii A, Aono J, Nagai T, Inoue K, Suzuki J, Inaba S, Okura T, Yasuda K, Higaki J, Ikeda S. Intravascular Ultrasound-Derived Virtual Fractional Flow Reserve for the Assessment of Myocardial Ischemia. Circ J 2018;82:815-23. 10.1253/circj.CJ-17-1042 [DOI] [PubMed] [Google Scholar]


