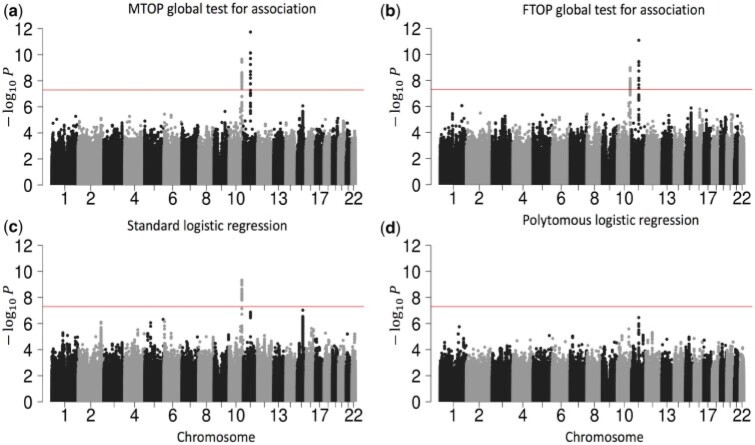
Fig. 3.
Manhattan plot of genome-wide association analysis with PBCS using four different methods. PBCS have 2078 invasive breast cancer and 2219 controls. In total, 7 017 694 SNPs on 22 auto chromosomes with MAF more than 5 were included in the analysis. ER, PR, HER2, and grade were used to define breast cancer subtypes.

