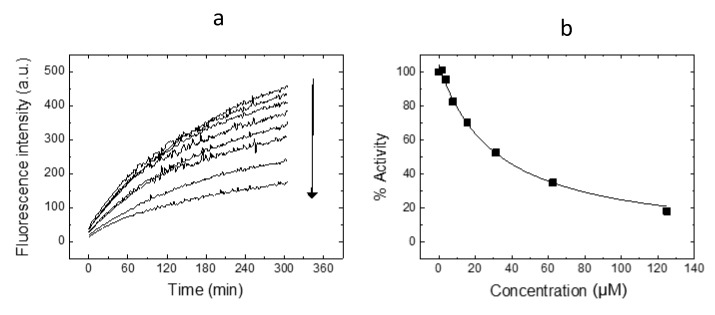
Figure 4.
Inhibition curve for RutinArg against Mpro. (a) Time evolution of the substrate fluorescence as a function of time. The observed FRET diminishes as the substrate is hydrolyzed by Mpro, reflecting the spatial separation of the donor-acceptor FRET couple. As the RutinArg concentration increases (arrow), the activity of Mpro, quantitated as the initial slope of each trace, decreases. (b) Inhibition curve obtained by plotting the activity percentage of Mpro, calculated as the ratio of the initial slope at each RutinArg concentration by that corresponding to no compound added (control), as a function of the RutinArg concentration. The non-linear least-squares analysis of the data considering a ligand-depletion model provided an estimation of the inhibition constant Ki. When the enzyme concentration and the ligand depletion are not accounted for, the effective inhibition concentration IC50 is estimated.

