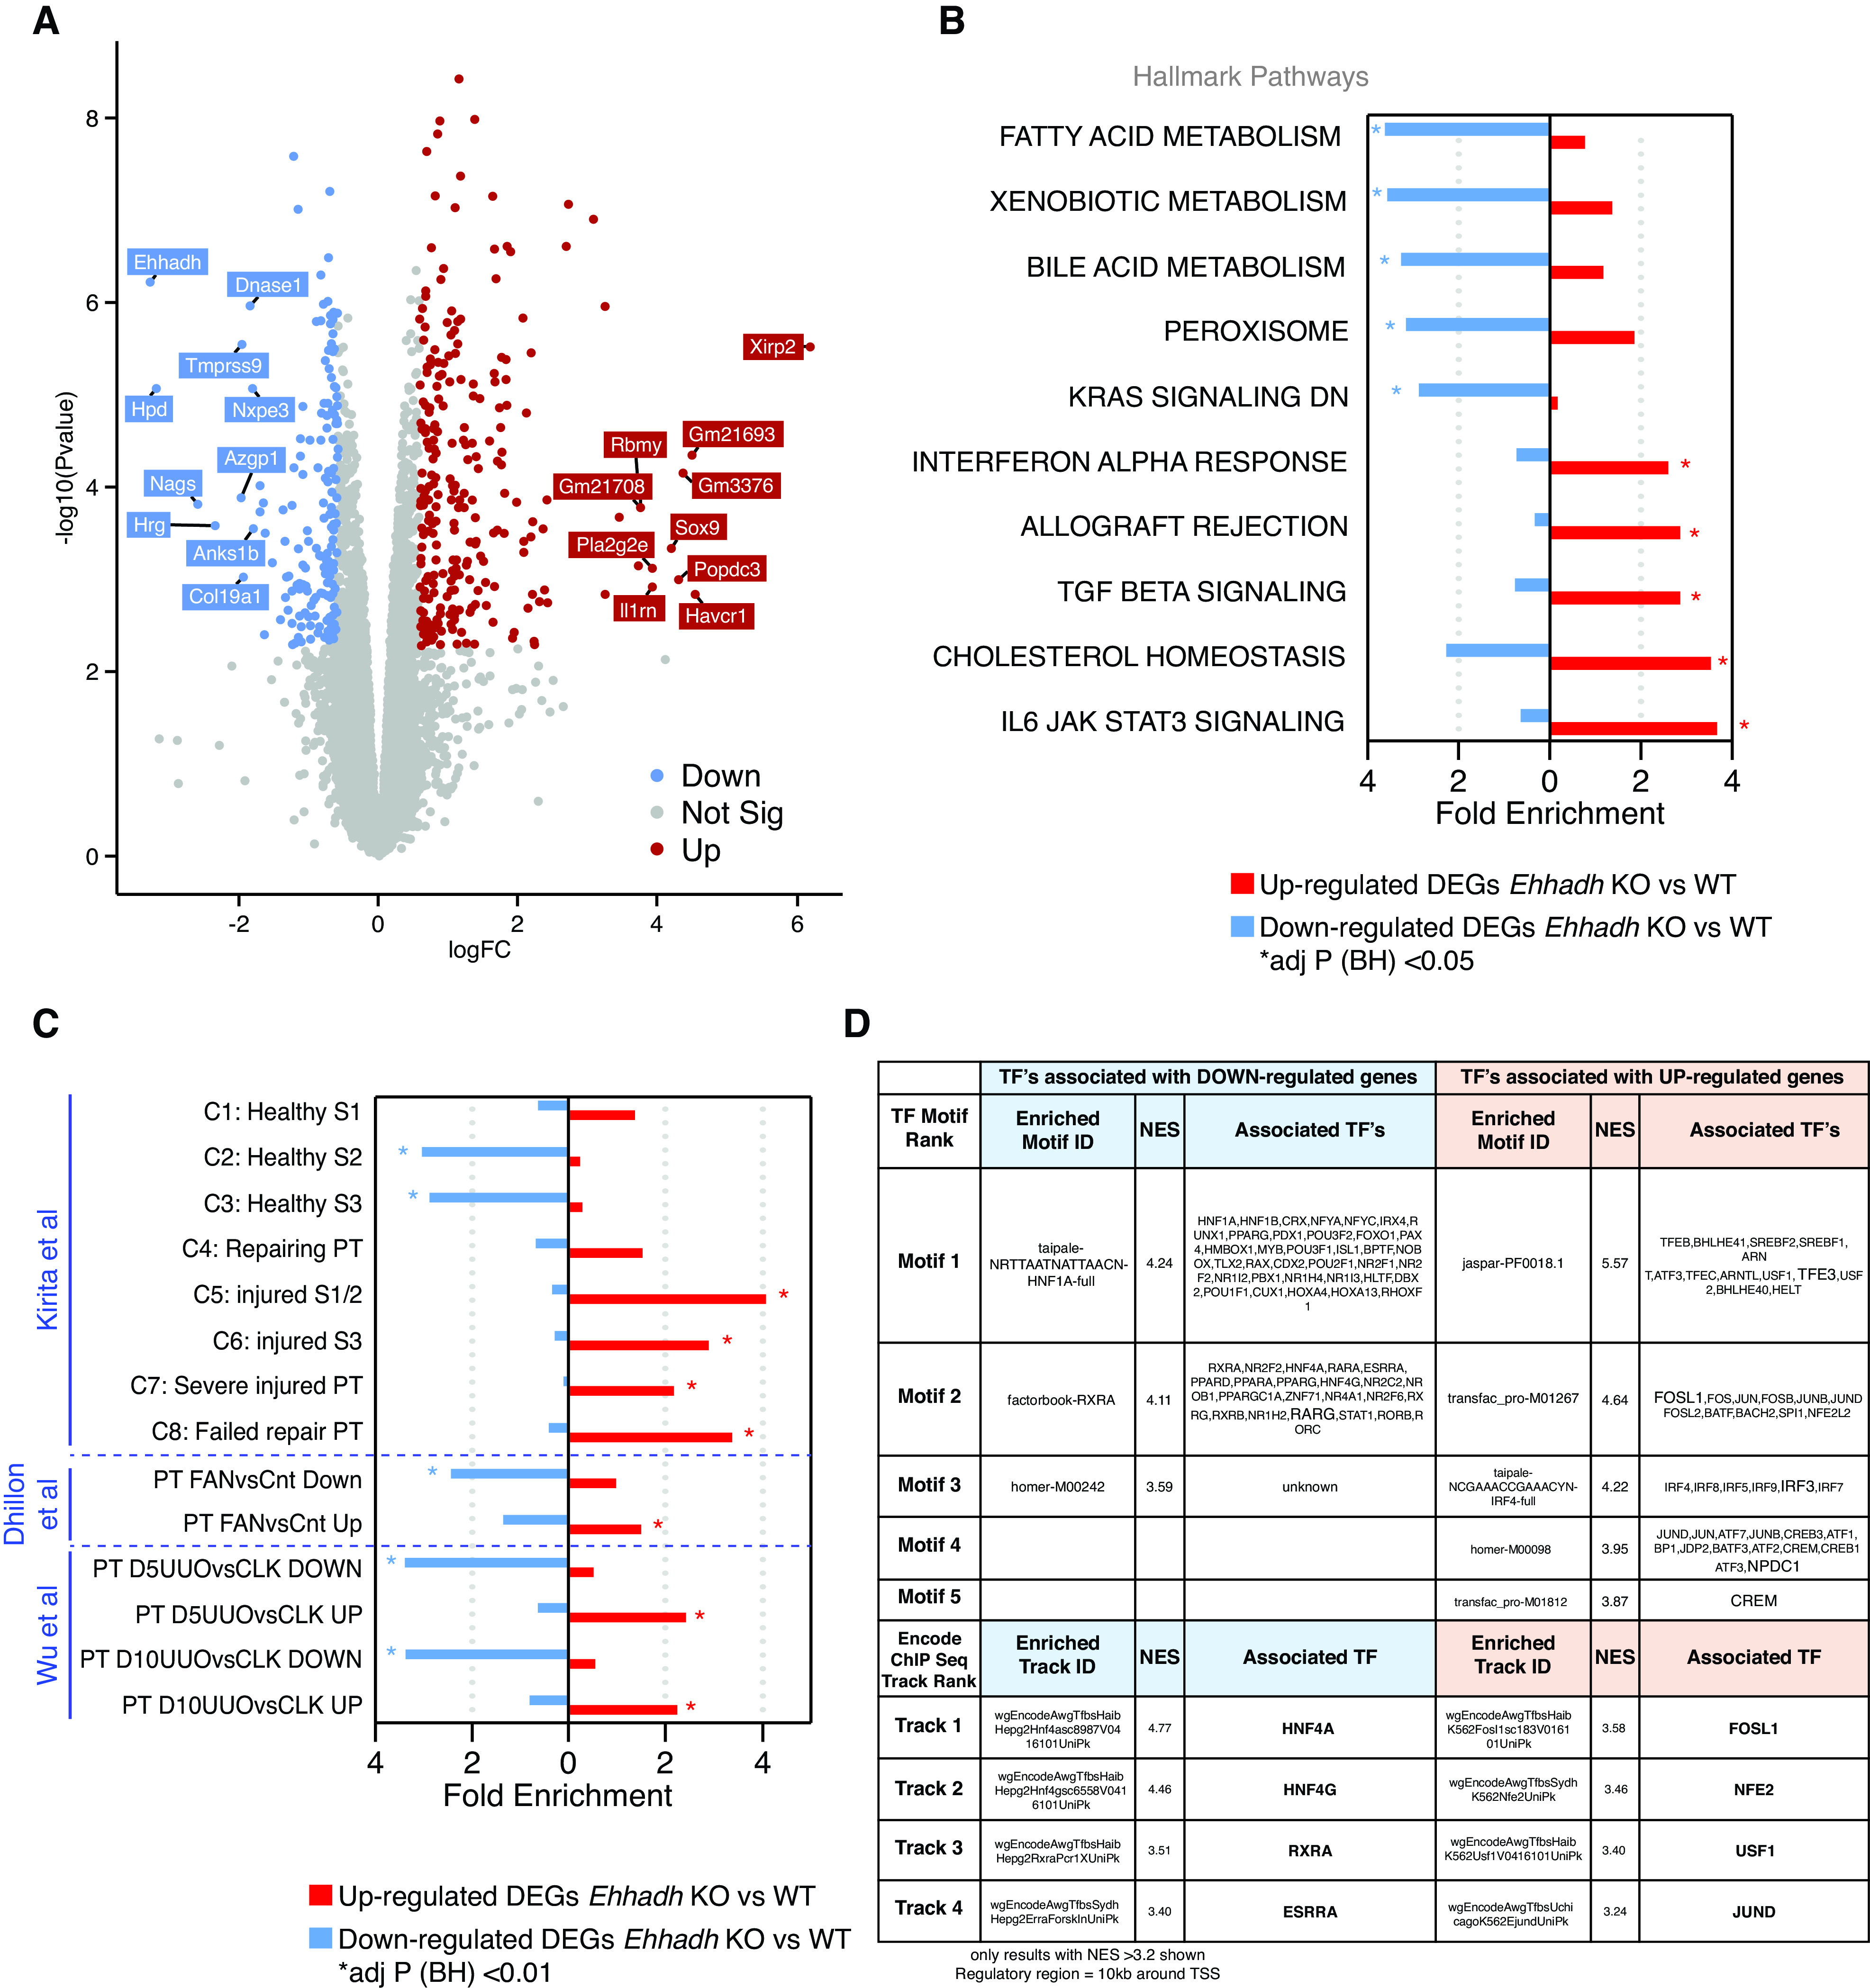
Figure 2.

Transcriptomics of male Ehhadh KO kidneys. (A) Volcano plot with significantly differentially expressed genes (DEGs) highlighted. Decreased genes (down) are highlighted in blue, increased genes (up) are highlighted in red. Gene names indicate the top 10 significant up and down genes by logFC using an adjusted (adj) P<0.05. Genes that were not statistically significant are represented in gray. (B) Top 10 pathways (by fold enrichment) after pathway enrichment analysis of genes either significantly up- or downregulated in Ehhadh KO mice versus WT according to the Hallmark database. Values represent the fold enrichment and significance is indicated with an asterisk (*) (adj P<0.05). Full table of results are in Supplemental Table 1, B and C. (C) Results of enrichment analysis of genes either up- or downregulated in Ehhadh KO mice versus WT, in gene sets curated from three independent murine proximal tubule (PT) AKI models (see Methods). Values represent the fold enrichment and significance is indicated with an asterisk (*) (adj P<0.01). Full table of results are in Supplemental Table 1D. (D) Predicted transcriptional regulators as identified by Iregulon through Motif or Encode ChIP-seq enrichment analysis for the genes either up- or downregulated in Ehhadh KO mice versus WT kidney samples. Only results with normalized enrichment score (NES) >3.2 are shown. The full table of results is in Supplemental Table 1E. The bolded transcription factor (TF) represents the most likely TF associated with the enriched motif. Human orthologs of the murine DEGs (at adj P<0.05) were the input for (B), (C), and (D). BH, Benjamini-Hochberg.
