

Abstract
Rationale: Both 2009 pandemic influenza A (H1N1) and severe acute respiratory syndrome coronavirus 2 (SARS-CoV-2) are transmitted by respiratory secretions and in severe cases result in a viral pneumonitis, requiring intensive care unit (ICU) admission. However, no studies have compared the clinical characteristics and outcomes of such patients.
Objectives: To report and compare the demographic characteristics, treatments, use of critical care resources, and outcomes of patients admitted to an Australian ICU with H1N1 influenza during the winter of 2009, and SARS-CoV-2 during the winter of 2020.
Methods: This was a multicenter project, using national data from previous and ongoing epidemiological studies concerning severe acute respiratory infections in Australia. All ICUs admitting patients with H1N1 or coronavirus disease (COVID-19) were included and contributed data. We compared clinical characteristics and outcomes of patients with H1N1 admitted to ICU in the winter of 2009 versus patients with COVID-19 admitted to ICU in the winter of 2020. The primary outcome was in-hospital mortality. Potential years of life lost (PYLL) were calculated according to sex-adjusted life expectancy in Australia.
Results: Across the two epochs, 861 patients were admitted to ICUs; 236 (27.4%) with COVID-19 and 625 (72.6%) with H1N1 influenza. The number of ICU admissions and bed-days occupied were higher with 2009 H1N1 influenza. Patients with COVID-19 were older, more often male and overweight, and had lower Acute Physiology and Chronic Health Evaluation II scores at ICU admission. The highest age-specific incidence of ICU admission was among infants (0–1 yr of age) for H1N1, and among the elderly (≥65 yr) for COVID-19. Unadjusted in-hospital mortality was similar (11.5% in COVID-19 vs. 16.1% in H1N1; odds ratio, 0.68 [95% confidence interval (95% CI), 0.42–1.06]; P = 0.10). The PYLL was greater with H1N1 influenza than with COVID-19 at 154.1 (95% CI, 148.7–159.4) versus 13.6 (95% CI, 12.2–15.1) PYLL per million inhabitants.
Conclusions: In comparison with 2009 H1N1 influenza, COVID-19 admissions overwinter in Australia resulted in fewer ICU admissions, and lower bed-day occupancy. Crude in-hospital mortality was similar, but because of demographic differences in affected patients, deaths due to 2009 H1N1 influenza led to an 11-fold increase in the number of PYLL in critically ill patients.
Keywords: COVID-19, H1N1, pandemic, Australia, outcomes
From June 1 to August 31, 2009, Australia experienced the combined effect of the 2009 influenza A (H1N1) pandemic and the southern hemisphere winter, with an eight times greater incidence than for the same period in the United States (1). We identified and reported all patients with confirmed 2009 H1N1 influenza who were admitted to Australian intensive care units (ICUs) during this period (2).
Between June 1 and August 31, 2020, Australia was again exposed to a viral respiratory pandemic during its winter season, this time due to coronavirus disease (COVID-19) (3–5). This unique combination provides opportunities to more clearly understand the winter epidemiology and outcomes of such pandemics in a high-income country healthcare system.
During the COVID-19 pandemic, the Australian State Governments and the Federal Government enacted several healthcare policies that may have influenced the characteristics and outcomes of this group of patients compared with patients with H1N1. First, Australia has a liberal testing policy, testing not only “suspected cases” but also people with mild symptoms, people working or living in a high-risk setting, and others, as classified in the “enhanced testing” strategy (6). Until November 21, 2020, Australia has conducted 9,670,186 COVID-19 tests, representing 377,527 tests per 1,000,000 population and with a positive rate of 0.3% (7, 8). Restricting data to the state of Victoria, where most of the winter cases occurred, 3,487,082 tests were conducted, representing 548,370 tests per 1,000,000 population with a positive rate of 0.6% (9). As a comparison, the entire United States has a rate of 533,967 tests per 1,000,000 population, with a positive rate of 6.9% (8). For H1N1, there is no available information on the number of tests conducted in Australia. In addition, during COVID-19 several Australian State Governments applied severe lockdown measures, declared the use of masks compulsory, and completely closed the borders to overseas visitors since the beginning of the pandemic. In contrast, during H1N1, no lockdown, use of masks or border closure occurred (10). It is important to emphasize that Victoria had a greater number of COVID-19 cases because of a breach in isolation practices at facilities used to quarantine returned travelers (9, 10). This was the primary source of the second wave of cases during winter 2020 and is the reason the majority of COVID-19 cases over this period were located in this state.
We aimed to report and compare the demographic characteristics, treatments, use of critical care resources, and outcomes of all critically ill patients admitted to an Australian ICU with laboratory-confirmed infection of H1N1 influenza during the winter of 2009 and severe acute respiratory syndrome coronavirus 2 (SARS-CoV-2), during the winter of 2020.
Methods
Study Design
This was a multicenter project, using national data from previous and ongoing epidemiological studies concerning severe acute respiratory infections in Australia. For data pertaining to the 2009 H1N1 pandemic, each center obtained approval from their institutional Human Research Ethics Committee (HREC) (2). For the 2020 COVID-19 data, approval for data collection was granted through the National Mutual Acceptance scheme via The Alfred Hospital HREC (HREC/16/Alfred/59), or by separate application to individual sites (11). For both patient cohorts, a waiver of informed written consent for participation was provided.
Setting
For the H1N1 cohort, data were extracted from a previously reported database (2), which included 84 ICUs in Australia. For COVID-19, as the pandemic was concentrated in specific areas, data were collected from 28 ICUs enrolling patients into the SPRINT-SARI (Short Period Incidence Study of Severe Acute Respiratory Infection) Australia database (11). Originally, SPRINT-SARI was prepared to capture data in 79 ICUs over all of Australia. However, because of Government actions and healthcare policies, most of these ICUs did not receive patients with COVID-19.
All ICUs admitting patients with H1N1 or COVID-19 were included and contributed data. Both cohorts captured >95% of all ICU admissions due to these two pandemics in Australia. In addition, the data used for the COVID-19 period were also used by the Australian Government Department of Health to produce official fortnightly reports about ICU patients with COVID-19 (12). A description and roadmap of restrictions in Australia during the COVID-19 pandemic is shown in the online supplement. No restriction was applied during the 2009 H1N1 pandemic.
Patients
The study population during the H1N1 pandemic included ICU patients of all ages who were polymerase chain reaction positive for the 2009 H1N1 influenza virus admitted between June 1 and August 31, 2009. The study population during the COVID-19 pandemic included patients of all ages with a positive laboratory polymerase chain reaction for SARS-CoV-2 admitted to an Australian ICU between June 1 and August 31, 2020. According to national guidelines, all patients admitted to the hospital with respiratory symptoms during both pandemics were tested for H1N1 in 2009 and for COVID-19 in 2020. Thus, no apparent difference in testing practices for hospitalized patients between the pandemics is expected.
Data Collection
We obtained the following data: 1) the dates and times of admission to the hospital and the ICU; 2) age; 3) race or ethnic group, including indigenous group (reported by patients or their next of kin or, for patients under 18 years of age, by a parent or guardian); 4) sex; 5) pregnancy or childbirth less than 28 days previously (for women); 6) coexisting conditions (including diabetes, heart failure, chronic lung disease, and chronic kidney disease); 7) measured or estimated weight and height (for calculation of the body mass index [BMI]); 8) date and time of first symptoms; 9) development of complications during the ICU stay; 10) treatment and organ support during the ICU stay; 11) laboratory data; and 12) clinical outcomes. The coordinating center was the ANZIC–RC (Australian and New Zealand Intensive Care Research Center) at Monash University.
Data Handling
Age was further categorized as in the previous report: 1) 0–1 year; 2) 1–4 years; 3) 5–24 years; 4) 25–49 years; 5) 50–64 years; and 6) 65 years of age or older. Classification of BMI was according to the World Health Organization definitions: underweight (BMI < 18.5 kg/m2), normal weight (18.5 ≤ BMI ≤ 24.9 kg/m2), overweight (25.0 ≤ BMI ≤ 29.9 kg/m2), class I obesity (30.0 ≤ BMI ≤ 34.9 kg/m2), class II obesity (35.0 ≤ BMI ≤ 39.9 kg/m2), and class III obesity (BMI ≥ 40.0 kg/m2). Data on the use of mechanical ventilation and extracorporeal membrane oxygenation (ECMO) were extracted. Patients transferred between ICUs were counted as a single ICU admission. No assumptions were made regarding missing data; all proportions were calculated as percentages of the patients with available data. The amount of missing data is reported in Table E1. Population data for Australia and their constituent regions were obtained from the Australian Bureau of Statistics (11).
Outcomes
The primary outcome was all-cause in-hospital mortality. In addition, the potential years of life lost (PYLL) were the main secondary outcome and were calculated as the difference between the life expectancy for each sex in the year of inclusion (83.9 and 84.9 for females in 2009 and 2020, and 79.3 and 80.7 for males in 2009 and 2020), and the actual age of the individual when they died (13–15). PYLL for the population was calculated by adding the PYLL contributed by each individual and dividing this by the total population younger than the life expectancy.
Secondary clinical outcomes included: 1) development of viral pneumonitis while in the hospital (definition provided in the online supplement); 2) development of superimposed bacterial pneumonia while in the hospital (definition provided in the online supplement); 3) duration of mechanical ventilation; 4) ICU mortality; 5) ICU length of stay; and 6) hospital length of stay. Secondary process-of-care outcomes included (assessed during the hospital stay): 1) need for mechanical ventilation; 2) need for ECMO; 3) need for vasopressor support; 4) need for renal replacement therapy; 5) use of corticosteroids; and 6) use of antivirals (definition provided in the online supplement).
The final clinical outcome was recorded as of September 7, 2009, for the H1N1 cohort and as of September 7, 2020, for the COVID-19 cohort. Length of stay for patients still admitted at the final follow-up was truncated at each point, respectively.
Statistical Analysis
Continuous variables were reported as medians (with interquartile ranges) and categorical variables as percentages. The absolute difference of categorical variables was reported as risk differences calculated with generalized linear models with a binomial distribution and an identity link; the absolute difference of continuous variables were reported as median differences calculated with a quantile model considering a Τ = 0.50, an asymmetric Laplace distribution, and P values for this model were extracted after 1,000 bootstrap samplings. An age-based population admission rate was estimated.
In addition to univariable comparisons of treatments and outcomes between groups, additional multivariable comparisons were performed. A comparison of outcomes according to each disease was undertaken with mixed-effect models, considering the hospital as a random effect to account for clustering. Binary outcomes were compared using mixed-effect generalized linear models with a binomial distribution and were reported as odds ratios (ORs) with 95% confidence intervals (95% CIs). PYLL was compared using mixed-effect generalized linear models with Gaussian distribution and reported as the mean difference with a 95% CI. Duration of mechanical ventilation, and ICU and hospital length of stay were compared using Fine-Gray competing risk models with death before the event treated as a competing risk, shown as cumulative distribution plots, and reported as the subdistribution hazard ratio with the 95% CI. The following variables were included for adjustment: 1) age, 2) sex, 3) ethnicity, 4) the presence of heart failure, and 5) the presence of diabetes. All these variables were selected a priori and on the basis of clinical relevance. To further understand the impact of age on in-hospital mortality for each condition, the model above was reassessed including an interaction between the disease and age, and the results presented as marginal effect plots.
In a restricted population of patients in whom Acute Physiology and Chronic Health Evaluation (APACHE) II score was available, mortality over time was assessed by generating an exponentially weighted moving average (EWMA) plot, and by plotting the variable adjusted life display (VLAD) of each disease. In the EWMA plot, we compared the observed in-hospital mortality to APACHE II predicted mortality, to monitor changes in this variable over time. The EWMA is an approach used to monitor variables that make use of the entire history of a given output. This is different from other control charts that tend to treat each data point individually. With this strategy, each output (previous sample mean) is given a weighting defined by the user, and the most recent samples are weighted the highest. In addition, the EWMA chart is more sensitive for detecting smaller and moderate shifts in the process, in this case, in in-hospital mortality (16, 17). The EWMA was constructed considering weight of 0.005, a target based on the initial predicted risk of death for each disease, and the boundaries of the predicted risk being three standard deviations.
VLAD is a type of indicator used to measure healthcare quality and patient outcomes, plotting the difference between the predicted and actual outcome (often written as “net lives saved”). A positive trend could indicate better than average performance (17, 18). VLAD has been recently used for the early detection of variation in clinical practice and outcomes in several fields in medicine (18–20). This method allows early identification of variations in patient outcome, which is not revealed by block audit. VLAD was presented as the cumulative excess of survival over time and was calculated by adding the patient’s probability of death every time he or she survived and by subtracting it if the patient died. The VLAD analysis was corrected by the total number of patients in each group.
For both analyses, the predicted risk of death was derived from APACHE II scores, considering admission due to respiratory infection. Finally, an attributable fraction analysis was used to assess the proportion of hospital deaths attributable to COVID-19 in the unadjusted and adjusted analysis as described above. This analysis considered counterfactual probability ratios to measure the fraction of death that could be attributed to being admitted because of COVID-19 compared with H1N1. For this analysis, cluster robust standard errors were calculated.
As a sensitivity analysis, all comparisons were reassessed only in patients who received mechanical ventilation during their hospital stay. Also, all comparisons were reassessed restricting both cohorts to patients admitted only to ICUs in Victoria. Finally, the EWMA and VLAD charts were reassessed after multiple imputations of missing APACHE II data (described in the online supplement). A two-sided P < 0.05 was considered as evidence of statistical significance. All analyses were performed using R software, version 4.0.2 (R Core Team) (21).
Results
Population
Across the two epochs, 861 patients were admitted to Australian ICUs; 236 (27.4%) with COVID-19 and 625 (72.6%) with H1N1 influenza (Figure 1). In the winter period, the number of ICU admissions and number of beds occupied were higher with 2009 H1N1 influenza. Although the highest number of cases during the H1N1 pandemic were located in the states of New South Wales and Queensland, most of the cases during the COVID-19 pandemic were in the state of Victoria (Table E2 and Figure E1). Characteristics of the centers including patients are shown in Table E3. The roadmap of restrictions in Australia during the COVID-19 pandemic is shown in Figure E2.
Figure 1.

Cumulative number of intensive care unit (ICU) admissions during the winter period according to the disease of interest. The blue lines and bars are for H1N1 admission from June 1, 2009, to August 31, 2009. The red lines and bars are for COVID-19 admission from June 1, 2020, to August 31, 2020. The daily number of ICU beds refers to the number of beds occupied by these patients in the ICUs that were contributing data to the study and do not refer to the overall number of beds in Australia. COVID-19 = coronavirus disease; H1N1 = influenza A.
Patients with COVID-19 were significantly older, more often male and overweight, and had a longer period between onset of symptoms and hospital admission (Table 1). The number of admissions and the age-specific incidences varied substantially according to the disease (Figure 2). The highest age-specific incidence of ICU admission was among infants (0–1 yr of age) for H1N1, and among the elderly (≥65 yr) for COVID-19 (Figure 2B). The greatest proportion of ICU admissions was among patients from 25 to 49 years old with H1N1 and in patients older than 50 years with COVID-19 (Figure 2A).
Table 1.
Baseline characteristics of patients with confirmed COVID-19 or H1N1
| COVID-19 (N = 236) | H1N1 (N = 625) | Absolute Difference (95% CI)* | |
|---|---|---|---|
| Age, yr | 59.0 (48.0 to 68.0) | 42.0 (27.0 to 54.0) | 17.09 (13.54 to 20.50) |
| <1 | 2/233 (0.9) | 19 (3.0) | — |
| 1–4 | 0/233 (0.0) | 13 (2.1) | — |
| 5–24 | 6/233 (2.6) | 87 (13.9) | — |
| 25–49 | 55/233 (23.6) | 278 (44.5) | — |
| 50–64 | 85/233 (36.5) | 174 (27.8) | — |
| >64 | 85/233 (36.5) | 54 (8.6) | — |
| Male sex, n (%) | 139/233 (59.7) | 303 (48.5) | 11.18 (3.70 to 18.50) |
| Weight, kg | 85.4 (71.3 to 101.3) | 80.0 (65.0 to 100.0) | 5.03 (1.56 to 8.56) |
| BMI, kg/m2,† | 30.5 (26.2 to 36.0) | 28.0 (23.0 to 35.0) | 2.18 (0.35 to 3.91) |
| Underweight | 2/181 (1.1) | 50/499 (10.0) | — |
| Normal weight | 32/181 (17.7) | 106/499 (21.2) | — |
| Overweight | 54/181 (29.8) | 127/499 (25.5) | — |
| Class I | 38/181 (21.0) | 84/499 (16.8) | — |
| Class II | 28/181 (15.5) | 61/499 (12.2) | — |
| Class III | 27/181 (14.9) | 71/499 (14.2) | — |
| APACHE II‡ | 14.0 (10.0 to 8.0) | 17.5 (13.0 to 23.0) | −3.94 (−5.25 to −2.55) |
| Days from symptoms to hospital admission | 6.8 (4.0 to 9.3) | 4.0 (2.0 to 7.0) | 2.12 (1.14 to 3.09) |
| Race or ethnic group, n (%) | — | — | — |
| White | 82/236 (34.7) | 455/596 (76.3) | — |
| Asian | 37/236 (15.7) | 23/596 (3.9) | — |
| Aboriginal | 1/236 (0.4) | 61/596 (10.2) | — |
| Maori | 0/236 (0.0) | 7/596 (1.2) | — |
| Pacific Islander | 0/236 (0.0) | 12/596 (2.0) | — |
| Other | 116/236 (49.2) | 38/596 (6.4) | — |
| Pregnancy, n (%) | 1/89 (1.1) | 56/308 (18.2) | −17.05 (−21.93 to −11.82) |
| Comorbidities, n (%) | — | — | — |
| Diabetes | 67/209 (32.1) | 97/612 (15.8) | 16.21 (9.42 to 23.31) |
| Heart failure§ | 22/209 (10.5) | 70/616 (11.4) | −0.84 (−5.42 to 4.36) |
| Chronic lung disease | 45/209 (21.5) | 209/621 (33.7) | −12.12 (−18.60 to −5.21) |
| Chronic kidney disease | 16/207 (7.7) | 14/520 (2.7) | 5.04 (1.52 to 9.38) |
| Admission creatinine, μmol/L | 73.5 (56.2 to 97.0) | 78.0 (57.0 to 103.0) | −4.97 (−12.93 to 2.57) |
| Organ support at ICU admission, n (%)‖ | — | — | — |
| Vasopressor | 42/192 (21.9) | 180/522 (34.5) | −12.61 (−19.51 to −5.26) |
| Invasive ventilation | 64/204 (31.4) | 407/620 (65.6) | −34.27 (−41.45 to −26.72) |
| Renal replacement therapy | 4/194 (2.1) | 31/529 (5.9) | −3.80 (−6.54 to −0.62) |
| Extracorporeal membrane oxygenation | 2/195 (1.0) | 31/623 (5.0) | −3.95 (−6.14 to −1.40) |
Definition of abbreviations: APACHE = Acute Physiology and Chronic Health Evaluation; BMI = body mass index; CI = confidence interval; COVID-19 = coronavirus disease; H1N1 = Influenza A; ICU = intensive care unit.
Data are median (quartile 25% to quartile 75%) or n (%). Percentages may not add up to 100% because of rounding.
The absolute difference is the risk difference for categorical variables and the median difference for continuous variables. H1N1 was used as a reference (negative values represent a decrease in COVID-19).
BMI is the weight in kilograms divided by the square of the height in meters. BMI was classified according to the World Health Organization definitions: underweight (BMI < 18.5 kg/m2), normal weight (18.5 ≤ BMI ≤ 24.9 kg/m2), overweight (25.0 ≤ BMI ≤ 29.9 kg/m2), class I obesity (30.0 ≤ BMI ≤ 34.9 kg/m2), class II obesity (35.0 ≤ BMI ≤ 39.9 kg/m2), and class III obesity (BMI ≥ 40.0 kg/m2).
The APACHE II score was known for 633 of the 861 patients (209 of 236 patients in the COVID-19 group and 424 of 625 patients in the H1N1 group).
Considering only heart failure (not including other chronic cardiovascular comorbidities).
Considering support over the first 24 hours of ICU admission.
Figure 2.
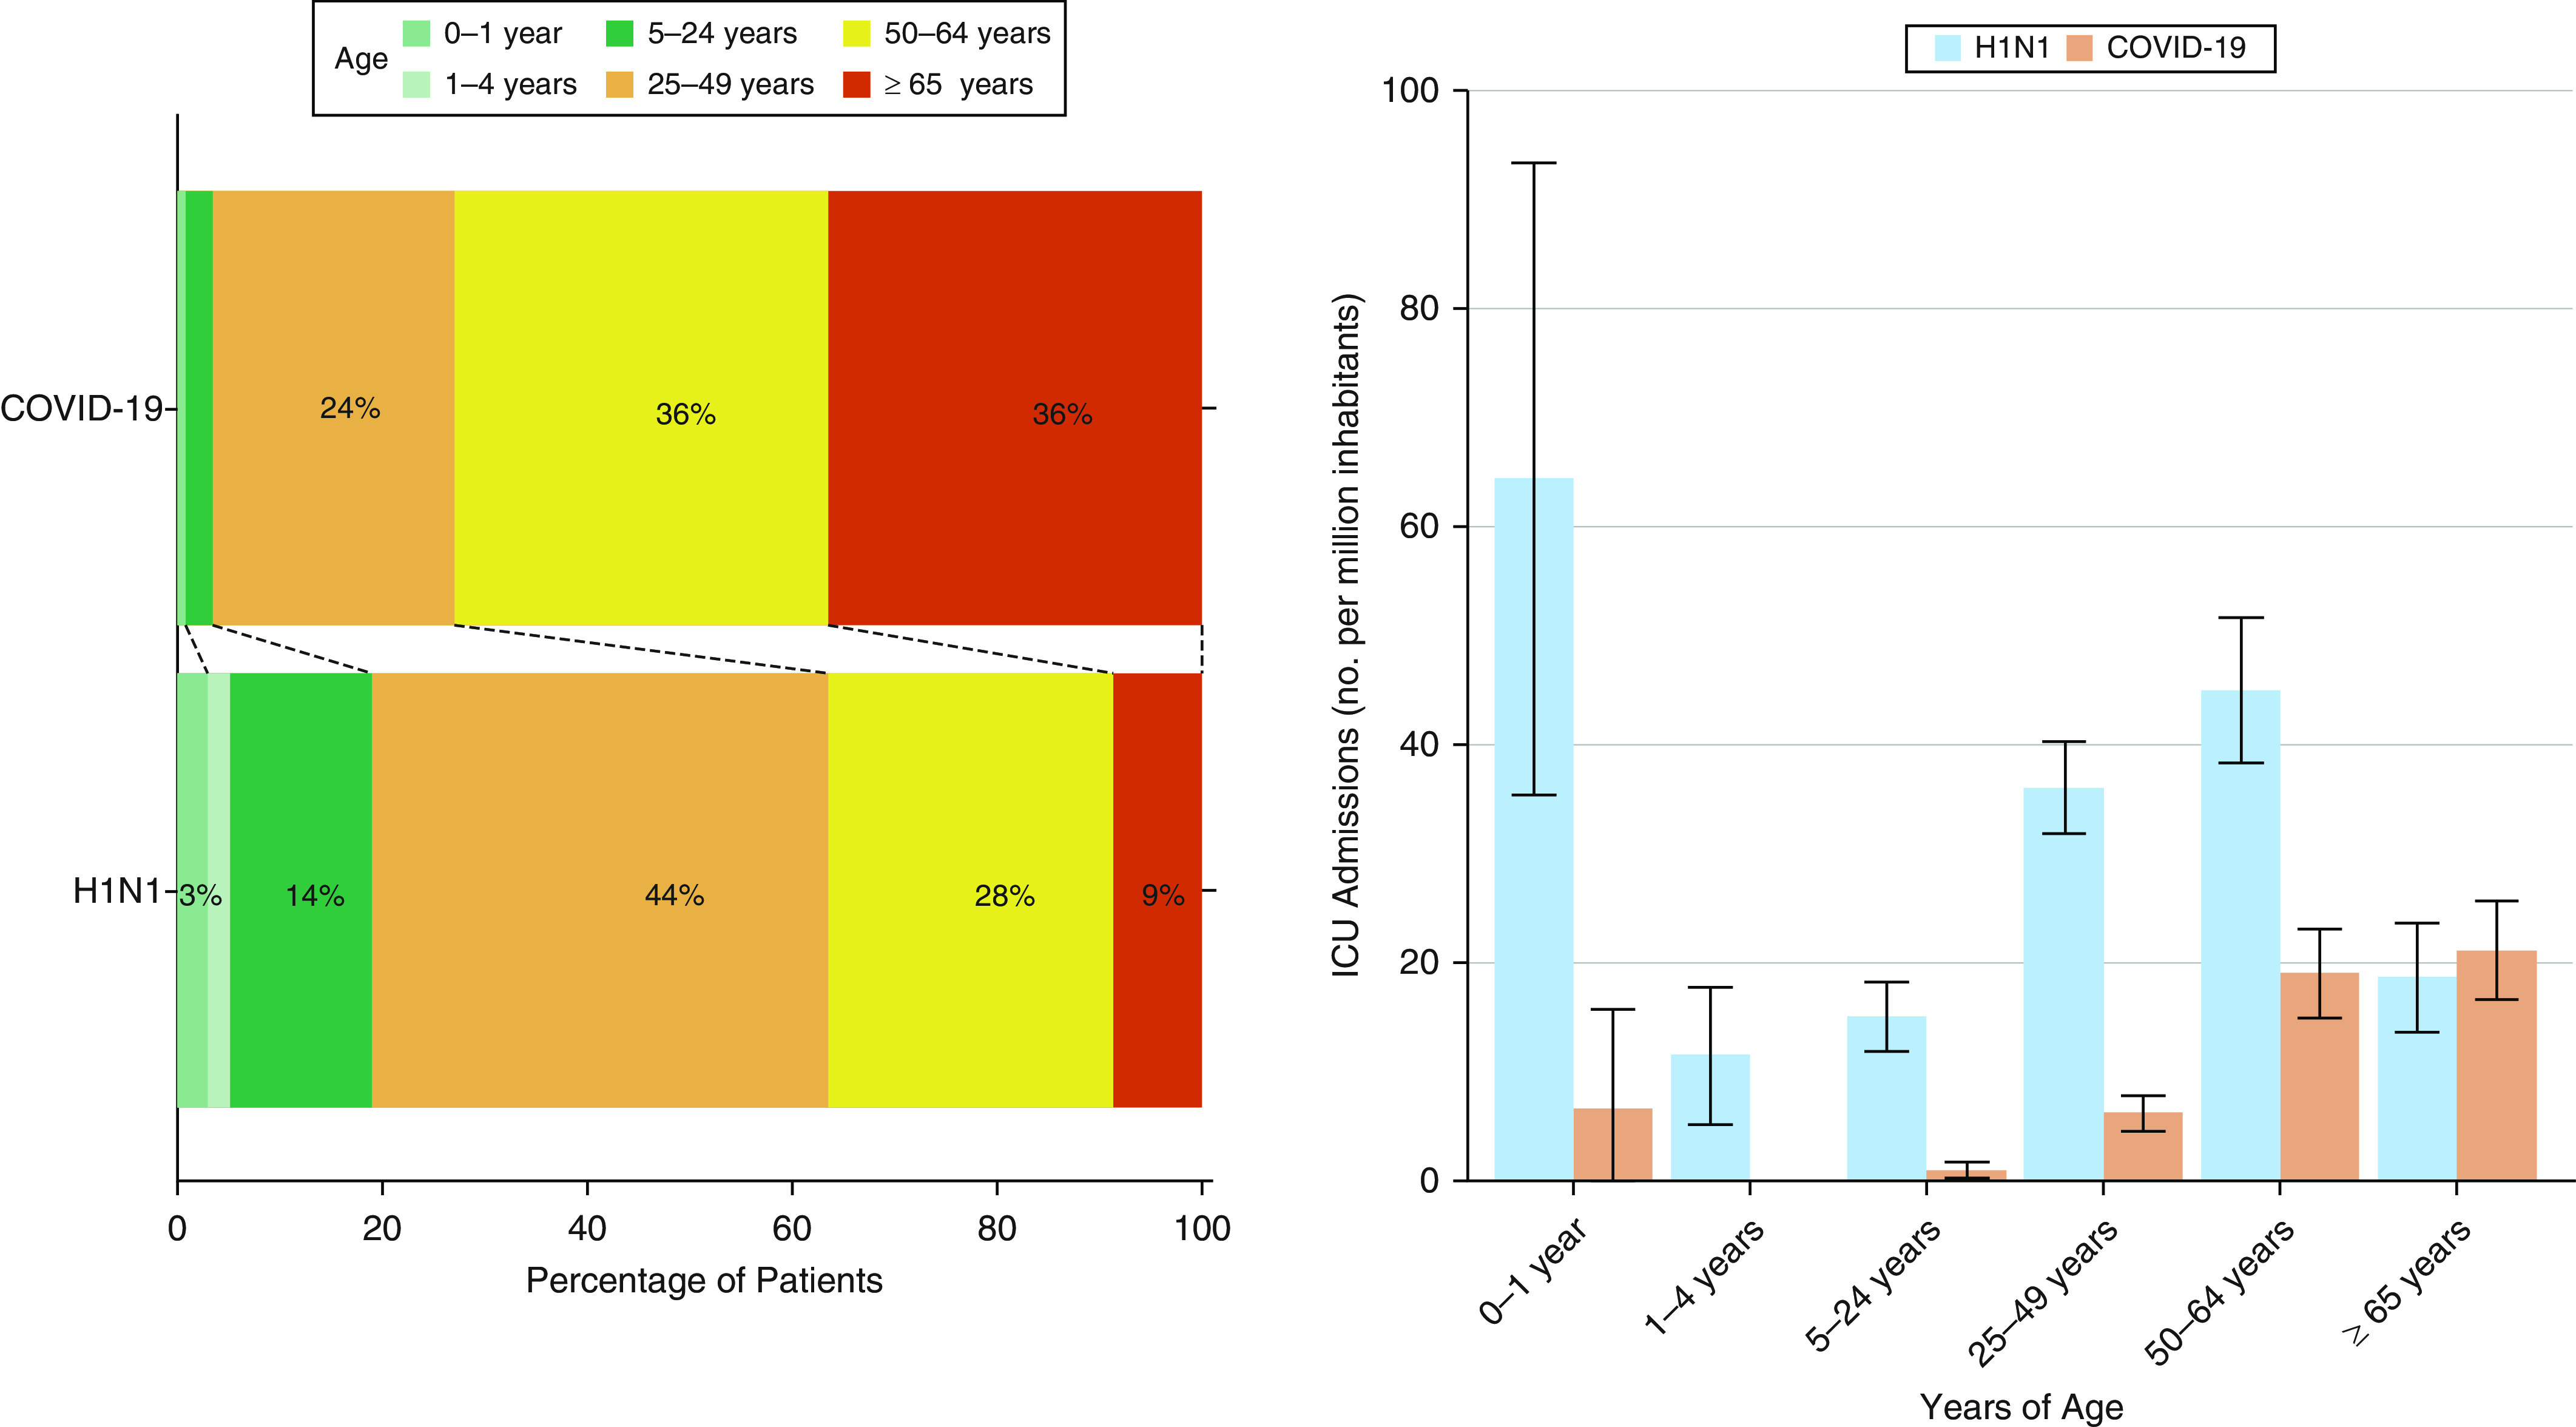
ICU admission according to age categories. The categories of age according to a previous report (2). The age-specific incidence was calculated by dividing the number of admissions in each age group by the estimated number of persons in that age group in the population of Australia (2009: 295,261 for 0–1 year, 1,130,423 for 1–4 years, 5,776,170 for 5–24 years, 7,724,459 for 25–49 years, 3,874,774 for 50–64 years, and 2,890,566 for 65 years or older; 2020: 302,705 for 0–1 year, 1,264,470 for 1–4 years, 6,435,935 for 5–24 years, 8,854,910 for 25–49 years, 4,467,942 for 50–64 years, and 4,038,345 for 65 years or older). The error bars indicate the 95% confidence intervals, which were calculated assuming a Poisson distribution. COVID-19 = coronavirus disease; H1N1 = influenza A; ICU = intensive care unit.
The number of pregnant women and patients with chronic lung disease were lower with COVID-19, but greater for diabetes and chronic kidney disease. At ICU admission, patients with COVID-19 had lower APACHE II scores and less use of vasopressors, invasive ventilation, renal replacement therapy, and ECMO.
Primary Outcome
Although during H1N1, only 1 (0.2%) patient was truncated for ICU and hospital length of stay on September 07, this happened in 15 (6.3%) and 32 (13.5%) patients respectively, during COVID-19. Unadjusted in-hospital mortality was similar (11.5% in COVID-19 vs. 16.1% in H1N1; OR, 0.68 [95% CI, 0.42–1.06]; P = 0.10) (Table 2 and Figure E3). After adjustment for age, sex, ethnicity, and presence of heart failure or diabetes, there was a lower risk of death in patients with COVID-19 (OR, 0.46 [95% CI, 0.25–0.84]; P = 0.01) (Table 2). The PYLL was greater with H1N1 influenza than with COVID-19 at 154.1 (95% CI, 148.7–159.4) versus 13.6 (95% CI, 12.2–15.1) PYLL per million inhabitants.
Table 2.
Clinical and process-of-care outcomes of patients with confirmed COVID-19 or H1N1
| COVID-19 (N = 236) | H1N1 (N = 625) | Unadjusted Effect Estimate (95% CI) | P Value | Adjusted Effect Estimate (95% CI)* | P Value | |
|---|---|---|---|---|---|---|
| Primary outcome | ||||||
| In-hospital mortality, n (%) | 27/234 (11.5) | 96/596 (16.1) | 0.68 (0.42 to 1.06)† | 0.10 | 0.46 (0.25 to 0.84)† | 0.01 |
| Years of life lost | 9.9 (4.2 to 17.3) | 33.1 (21.3 to 45.1) | −21.13 (−28.18 to −14.08)‡ | <0.001 | −15.54 (−24.39 to −6.65)‡§ | 0.001 |
| Mean ± SD | 12.2 ± 11.0 | 33.4 ± 17.5 | — | — | — | — |
| Secondary clinical outcomes | ||||||
| Viral pneumonitis, n (%) | 121/207 (58.5) | 287/625 (45.9) | 1.66 (1.21 to 2.28)† | 0.002 | 1.91 (1.01 to 3.63)† | 0.05 |
| Superimposed bacterial pneumonia, n (%) | 36/199 (18.1) | 115/625 (18.4) | 0.98 (0.64 to 1.47)† | 0.92 | 1.38 (0.65 to 2.95)† | 0.40 |
| Duration of ventilation, d | 8.0 (4.0 to 16.2) | 8.0 (4.0 to 17.0) | 1.09 (0.87 to 1.35)‖ | 0.46 | 1.16 (0.83 to 1.62)‖ | 0.39 |
| In survivors at hospital discharge, d | 7.0 (4.0 to 13.2) | 8.0 (4.0 to 17.0) | ||||
| ICU mortality, n (%) | 24/235 (10.2) | 83/615 (13.5) | 0.73 (0.44 to 1.16)† | 0.20 | 0.54 (0.28 to 1.02)† | 0.06 |
| ICU length of stay, d¶ | 5.8 (2.6 to 10.9) | 8.0 (3.0 to 16.0) | 1.15 (0.96 to 1.38)‖ | 0.12 | 1.42 (1.04 to 1.95)‖ | 0.03 |
| Truncated on September 7 | 6.0 (2.7 to 12.9) | 8.0 (3.0 to 15.2) | ||||
| Hospital length of stay, d¶ | 12.9 (7.9 to 18.9) | 15.0 (8.0 to 30.0) | 0.96 (0.80 to 1.16)‖ | 0.69 | 1.30 (0.93 to 1.81)‖ | 0.13 |
| Truncated on September 7 | 13.2 (8.7 to 22.8) | 15.0 (8.0 to 28.0) | ||||
| Secondary process-of-care outcomes | ||||||
| Need of invasive ventilation, n (%) | 120/224 (53.6) | 424/621 (68.3) | 0.54 (0.39 to 0.73)† | <0.001 | 0.45 (0.28 to 0.73)† | 0.001 |
| Need of extracorporeal membrane oxygenation, n (%) | 12/215 (5.6) | 41/623 (6.6) | 0.84 (0.41 to 1.58)† | 0.60 | 2.42 (0.66 to 8.91)† | 0.18 |
| Need of vasopressor, n (%) | 105/213 (49.3) | 195/526 (37.1) | 1.65 (1.20 to 2.28)† | 0.002 | 1.06 (0.65 to 1.71)† | 0.82 |
| Need of renal replacement therapy, n (%) | 19/214 (8.9) | 49/530 (9.2) | 0.96 (0.54 to 1.64)† | 0.87 | 0.82 (0.38 to 1.79)† | 0.62 |
| Use of corticosteroids, n (%) | 209/223 (93.7) | 223/531 (42.0) | 20.62 (12.10 to 37.99)† | <0.001 | 23.21 (10.51 to 51.28)† | <0.001 |
| Use of antivirals, n (%) | 132/223 (59.2) | 499/528 (94.5) | 0.08 (0.05 to 0.13)† | <0.001 | 0.06 (0.02 to 0.13)† | <0.001 |
Definition of abbreviations: CI = confidence interval; COVID-19 = coronavirus disease; H1N1 = influenza A; ICU = intensive care unit; SD = standard deviation.
Data are median (quartile 25% to quartile 75%) or n (%). Percentages may not add up to 100% because of rounding.
Adjusted by age, sex, ethnicity, and presence of heart failure or diabetes and including center as a random effect.
Effect estimate is the odds ratio from a generalized linear model with a binomial distribution.
Effect estimate is a mean difference from a generalized linear model with Gaussian distribution.
Not adjusted by age.
Effect estimate is subdistribution hazard ratio from a Fine-Gray competing risk model with death before the event treated as competing risk.
ICU and hospital length of stay consider only patients with a date of discharge available (because of discharge or death).
Across differing categories of BMI, and quartiles of APACHE II, in-hospital mortality was similar in both COVID-19 and H1N1. However, there was an interaction between age, disease, and in-hospital mortality. Thus, patients with COVID-19 appeared at an increased risk of death only when >50 years of age (Figures E3 and E4). This was confirmed after adjustment for sex, ethnicity, heart failure, and diabetes.
COVID-19 attributable mortality fraction was lower after adjusting for age, sex, ethnicity, heart failure, and the presence of diabetes (Table E4). The VLAD analysis showed a cumulative excess of survival compared with the predicted risk of death in both diseases. However, this effect was greater in patients with H1N1 influenza (Figure 3). We observed the same trend in the EWMA analysis, with both diseases showing a decrease in observed versus expected in-hospital mortality over time.
Figure 3.
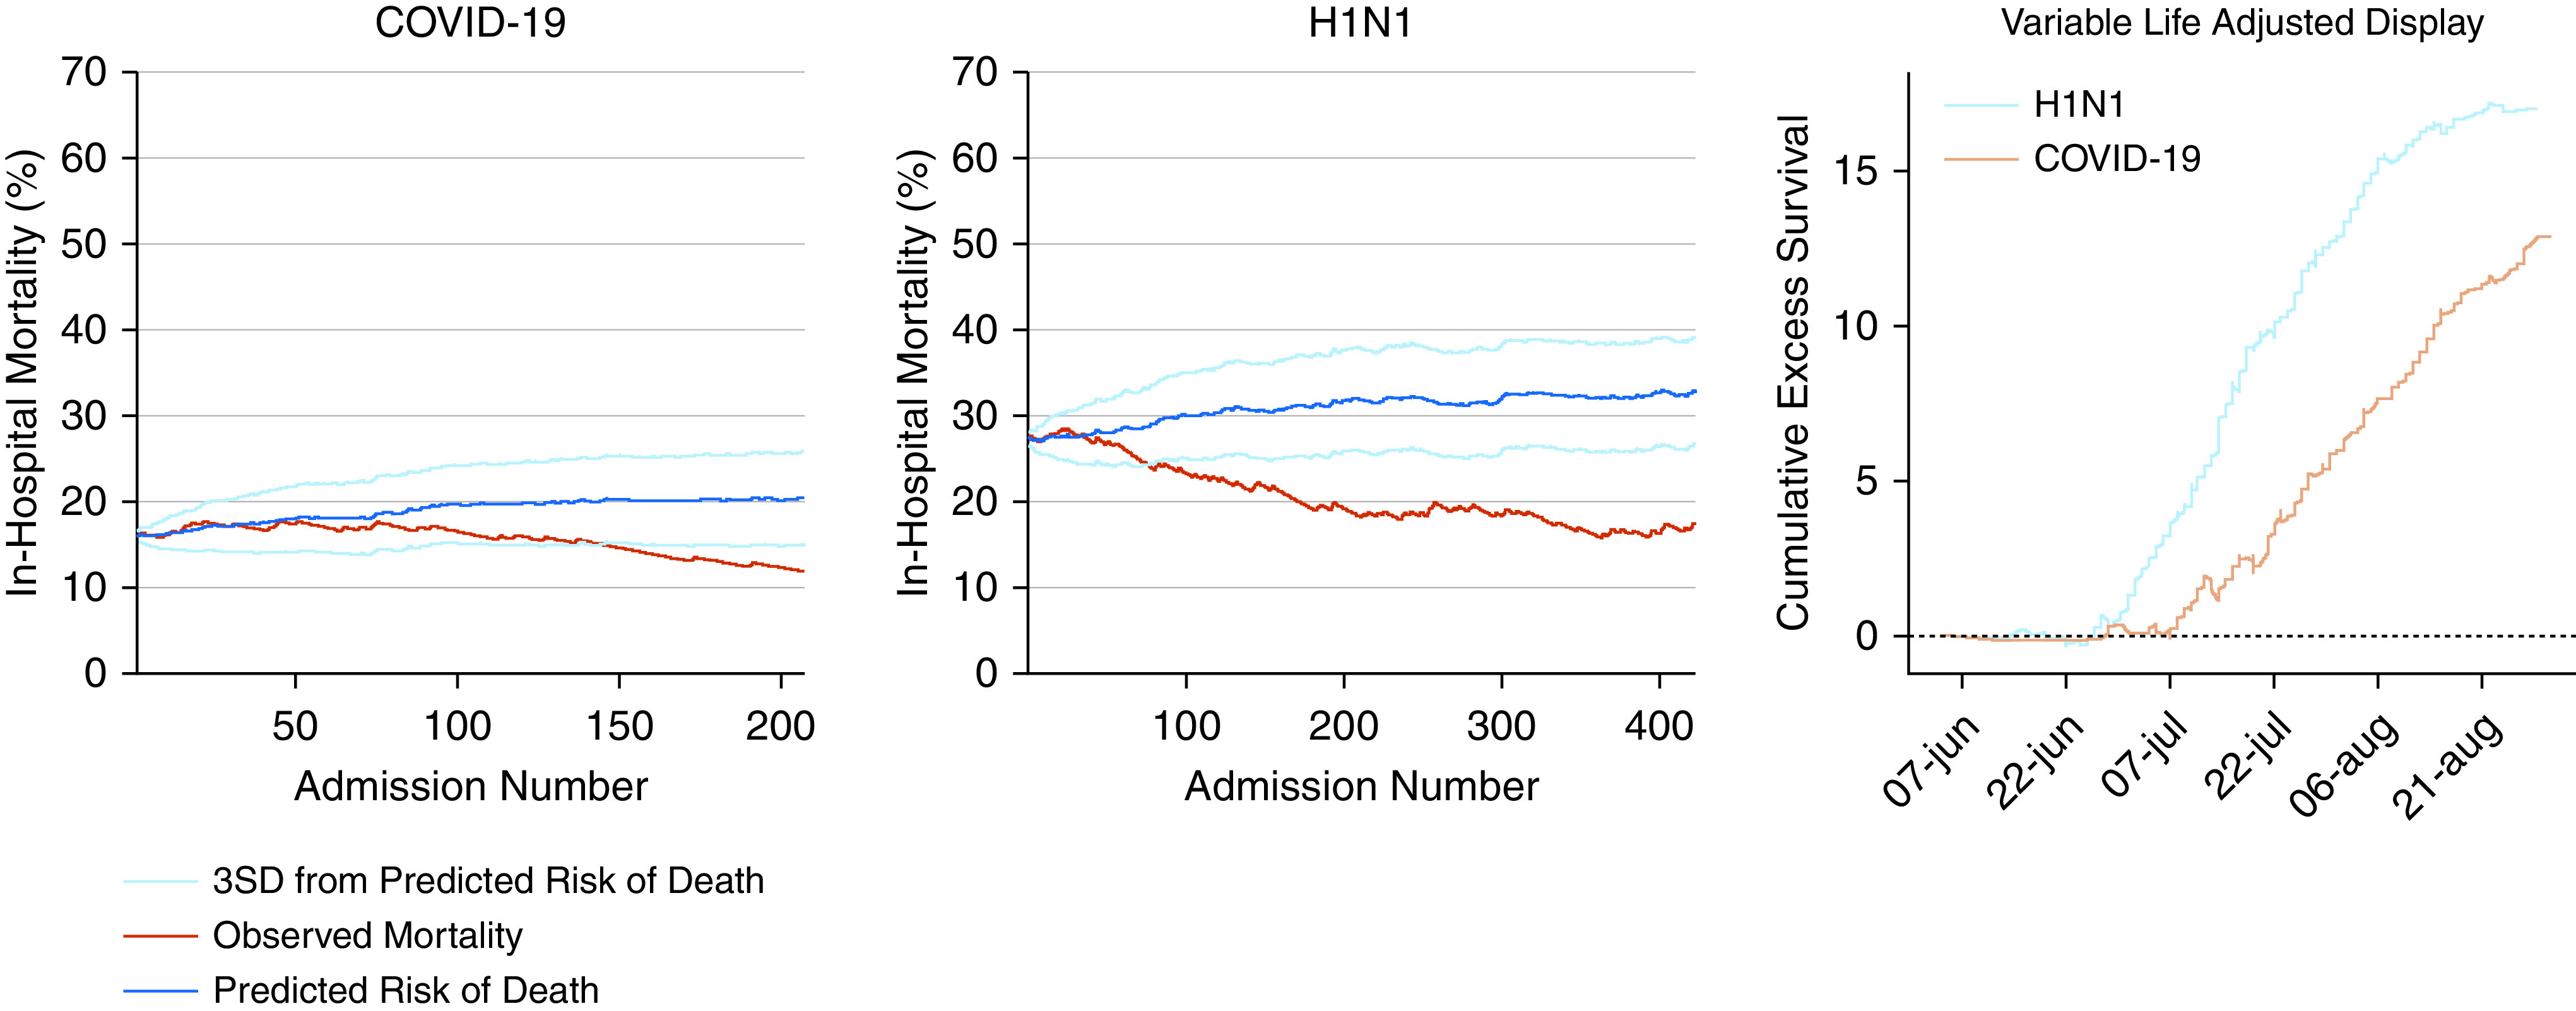
Exponentially weighted moving average and variable adjusted life display. The exponentially weighted moving average was constructed considering the weight of 0.005, a target based on the initial predicted risk of death for each disease, and the boundaries of the predicted risk considered 3 SDs. The variable adjusted life display is presented as the cumulative excess of survival over time and was calculated by adding the patient’s probability of death every time he/she survived and by subtracting it if the patient died. The variable adjusted life display analysis was corrected by the total number of patients in each group. The predicted risk of death was derived from the Acute Physiology and Chronic Health Evaluation II score, considering admission due to respiratory infection. COVID-19 = coronavirus disease; H1N1 = influenza A; SD = standard deviation.
Secondary Outcomes
After adjusting for age, sex, ethnicity, heart failure, and diabetes in patients with COVID-19, ICU length of stay shortened (Table 2 and Figure E5). After adjustment for age, sex, ethnicity, heart failure, and diabetes, patients with COVID-19 received less invasive ventilation and antivirals but more corticosteroids (Table 2).
Sensitivity Analysis
Differences in baseline characteristics among patients receiving mechanical ventilation for COVID-19 as compared with H1N1 influenza mimic those in the overall population. The use of mechanical ventilation on ICU admission was 96.2% (407 of 424 patients) in the H1N1 cohort and 58.2% (64 of 120 patients) in the COVID-19 cohort (Table E5). After adjusting for age, sex, ethnicity, heart failure, and diabetes, hospital mortality was lower in mechanically ventilated patients with COVID-19 (Table E6). Among ventilated patients, vasopressor and corticosteroids use was higher but antiviral use was lower with COVID-19 (Table E6).
Analyses concerning patients admitted to ICUs in Victoria alone are provided in Tables E7–E9 and Figures E6–E8. Disparate with the findings in the overall cohort, the number of cases and daily bed occupancy was higher in Victoria with COVID-19 than H1N1 influenza. However, baseline characteristics and outcomes mimicked those reported in the overall cohort. Moreover, in Victoria, the difference in PYLL between the diseases was similar in direction but less in size than in the overall cohort, (88.8 [95% CI, 80.6–96.9] with H1N1 vs. 51.4 [95% CI, 45.8–57.0]) PYLL per million inhabitants with COVID-19.
Comparison of patients with and without missing data in APACHE II is shown in Table E10. EWMA and VLAD plots after multiple imputations of missing APACHE II data are shown in Figures E9 and E10. The results after multiple imputations were consistent with the results in the complete case analysis.
Discussion
Key Findings
In this large, nationwide, multicenter study, in comparison with 2009 H1N1 influenza, the 2020 COVID-19 pandemic resulted in fewer ICU admissions and lower bed-day occupancy overall in Australia during the winter. Patients younger than 50 years old made up the majority of the H1N1 cohort compared with COVID-19, in which patients were much older. Thus, although unadjusted in-hospital mortality was similar, deaths due to 2009 H1N1 influenza led to an 11-fold increase in the number of PYLL in this group of critically ill patients. Patients with COVID-19 were also more likely to be male and overweight, more likely to have diabetes, less likely to have chronic lung disease, and substantially less likely to be pregnant. In addition, patients with H1N1 influenza had higher APACHE II scores on the day of ICU admission and needed greater vasopressor support, invasive ventilation, ECMO, and renal replacement therapy. Moreover, with both diseases, observed in-hospital mortality fell over time, to a point significantly lower than predicted by illness severity scores. Finally, when the comparison was restricted to the state of Victoria where the Australian COVID-19 epicenter was located, the number of cases and daily bed occupancy was higher with COVID-19. However, even so, H1N1 led to more PYLL than COVID-19.
Relationship with Previous Studies
No prior studies have compared the characteristics and outcomes of patients admitted to ICU in the winter with either COVID-19 or 2009 H1N1 influenza, even though both viruses are transmitted by respiratory secretions and principally result in a viral pneumonitis. As such, this study is unique in providing population-level data, across an entire country, over the same seasonal period, for two distinct viral respiratory pandemics. Moreover, as the COVID-19 pandemic initially involved most northern hemisphere countries in early spring, this study is the first to provide comparative epidemiological data on these two pandemics during winter in the healthcare system of a high-income country.
At a population level, during the H1N1 pandemic, there were 37,500 confirmed cases and 191 associated deaths in Australia before its dissipation in 2010, after the introduction of a vaccination program (22). In contrast, as of October 11, 2020, in Australia there have been 27,285 confirmed cases and 898 deaths due to COVID-19 (23). However, the demographics of deceased patients are dramatically different.
With COVID-19, >99% of deaths have occurred in patients >65 years of age, with a median age of death of 83 years. In contrast, during the 2009 H1N1 pandemic, only 65% of deaths occurred in patients >65 years of age, and the median age of death was 49 years (7, 24). Moreover, because in Australia COVID-19 has so far infected fewer people overall (22, 23), the frequency of ICU admission has been less than 1%, compared with approximately 2.5% for 2009 H1N1 influenza (7, 22–24).
This differential use of resources principally reflects the COVID-19 public health response enacted in Australia (e.g., social distancing measures, lockdown, interstate border closures, mask wearing) in addition to the nature of those most at risk of severe disease, where ICU admission may not have been considered appropriate. Indeed, many older, nursing home patients with COVID-19 with severe comorbidities and/or advanced dementia may not have been deemed appropriate for invasive organ support. Critically, we do not have granular data concerning this complex decision-making process, which would have varied from case to case and would have been informed by the patient’s underlying prognosis, previous state, and documented legally binding healthcare directives. Of note, national guidelines concerning this process were published during the COVID-19 pandemic, reinforcing these principles (25, 26). In addition, it should also be noted that no lockdown, use of masks, or border closure occurred during the 2009 H1N1 pandemic (10).
Study Implications
This study implies that, in Australia, compared with the 2009 H1N1 pandemic, COVID-19 has affected a much older population who more often suffer from diabetes, are overweight, and male. Furthermore, patients with COVID-19 had lower APACHE II scores at ICU admission and the overall use of ICU services was much less than during the 2009 H1N1 pandemic. Victoria had a greater number of COVID-19 cases because of a breach in isolation practices at facilities used to quarantine returned travelers. This was the primary source of the second wave of cases during winter 2020 and is the reason the majority of COVID-19 cases over this period were located in this state (27). ICU occupancy was greater in Victoria with COVID-19, a fact not reflected nationally. This finding reinforces the value of the public health interventions implemented to slow the rate of broader community transmission of COVID-19 in Australia, such as limiting regional and interstate travel. However, even in Victoria, which had a peak winter incidence of 103 cases/million (the current second wave peak incidence is 258 cases/million in the United Kingdom and 184 cases/million in the United States) the number of PYLL was greater with H1N1.
Our data also demonstrate a significant improvement in terms of in-hospital mortality over time in critically ill patients with both infections. This is a unique observation, and although specific therapies have been introduced as COVID-19 has persisted (28), the consistency of this finding across both epochs likely implies either improved processes of care, or an inherent change in host susceptibility or pathogen virulence, or a combination of these factors, as both pandemics evolved.
Although the winter H1N1 pandemic affected Australia in 2009 as a single first wave, the COVID-19 winter pandemic represented a second wave after a short-lived autumn first wave. Nonetheless, given the rapid and dramatic second wave developing in Europe, the United States, and Canada with the arrival of colder weather, it is likely that the winter observations presented here are relevant in defining imminent expectations for the healthcare systems of high-income countries in the northern hemisphere. Indeed, when considering the Australian experience in reference to larger, more densely populated European nations, the public health interventions enacted (and adhered to) provide a clear template to achieve some degree of disease control and preserve healthcare resources and PYLL.
Finally, our findings illustrate the significant disparity in PYLL related to each viral pandemic. Indeed, whereas the mortality rate of COVID-19 in the community has been more than 6-fold greater, the median age of those dying, in reference to currently measured life expectancy in Australia, has resulted in a much lower burden of life-years lost than with 2009 H1N1 influenza.
Strengths and Limitations
To our knowledge, this is the only study comparing critically ill patients admitted to ICU with either 2009 H1N1 influenza, or COVID-19, during winter, separated by 11 years. In both epochs, virtually all major Australian ICUs participated, and all eligible patients were identified and included. In addition, the period of inclusion, and the last follow-up date were the same for both periods. Patient-centered outcomes such as mortality and length of stay were available for the majority of the patients and we have generated robust findings concerning clinical outcomes, temporal improvements over time (in each pandemic), and PYLL.
The present study has limitations. First, to make this report available as soon as possible, we censored hospital outcome data in both cohorts, which may have introduced bias and precluded the detection of worse outcomes beyond the censored point. However, the moment of censoring was exactly the same in both groups. Second, although the data for 2009 H1N1 were gathered early during the pandemic, the data for COVID-19 was gathered mostly during the second wave of the disease in Australia. Thus, it cannot be excluded that the better outcomes observed within COVID-19 reflect the effect of optimized protocols and better care learned from the first wave, as opposed to an inherent difference in the fatality of the condition itself. Third, ascertainment of patients with 2009 H1N1 and COVID-19 who were admitted to an ICU may not have been complete and we cannot rule out the possibility that a small number of cases were not reported. Fourth, although H1N1 cases were spread uniformly throughout Australia, COVID-19 cases were mainly restricted to one state. Fifth, there were no restrictions applied by the state or federal government in Australia for the H1N1 pandemic but very strong restrictions for the COVID-19 pandemic. In addition, different testing policies between the two pandemics may also have affected the measured burden of each disease in the Australian population. However, according to the national guideline, all patients admitted to the hospital with respiratory symptoms during both pandemics were tested. Thus, no difference in testing practice is expected for hospitalized patients during both pandemics. Sixth, the EWMA and VLAD analyses have some limitations. A disadvantage of the EWMA is that it can be slow to react to an increase in mortality if the observed mortality is close to the threshold (inertia problem) (29), although this is not a common occurrence (29). The main limitation of VLAD is that a good run of results may mask a subsequent poor run, which will mean that an excess of deaths is needed to cross the control limit (30). Seventh, cardiac complications are frequently reported in patients with COVID-19. Unfortunately, this type of complication was not collected during the 2009 H1N1 pandemic and could not be considered in the study. Eight, to have the report released as soon as possible, some patients did not have complete data entered for some secondary outcomes. Despite missingness being present in less than 10% of the patients, this could have influenced the analyses. Ninth, the definitions used for the diagnosis of viral pneumonitis and bacterial pneumonia were primarily clinical and did not take into account microbiological confirmation. Thus, misclassification was possible. Tenth, some other important comorbidities (e.g., coronary artery disease) were not available in the H1N1 dataset, and as such, were not able to be included in the adjusted analyses. Finally, APACHE II scores were not available in all patients, but sensitivity analyses using multiple imputations yielded the same results.
Conclusions
In comparison with 2009 H1N1 influenza, in association with marked restrictions, COVID-19 overwinter in Australia resulted in fewer ICU admissions, and lower bed-day occupancy overall. Patients with COVID-19 were generally older, more often overweight, males, with a history of diabetes, and had lower APACHE II at ICU admission. Crude in-hospital mortality among those admitted to ICU was similar between the two pandemics, but because of demographic differences in affected patients, deaths due to 2009 H1N1 influenza led to an 11-fold increase in the number of life-years lost in this group of critically ill patients. With both diseases, observed in-hospital mortality in critically ill patients fell over time, to a point significantly lower than predicted by illness severity scores, suggesting improved processes of care or changes in host susceptibility or disease virulence.
Footnotes
This article has an online supplement, which is accessible from this issue’s table of contents at www.atsjournals.org.
Supported by the Department of Health, Government of Australia, and standing deed SON60002733.
A complete list of the SPRINT-SARI Australia and ANZIC Influenza Investigators may be found in the online supplement.
A de-identified data set will be made available on request to the corresponding authors 1 year after the publication of this study. The request must include a statistical analysis plan. The code is available on request.
Author Contributions: All authors designed the study and were involved in collecting the data with the help of the study collaborators. A.S.N. did the analyses. A.S.N., A.J.C.B., M.B., D.J.C., R.B., and A.U. drafted the manuscript. All authors revised and approved the final version to be published.
Author disclosures are available with the text of this article at www.atsjournals.org.
Contributor Information
Collaborators: on behalf of the SPRINT-SARI Australia and ANZIC Influenza Investigators
References
- 1.Centers for Disease Control and Prevention H1N1 flu: international situation update Atlanta, GA: Centers for Disease Control and Prevention; 2009[accessed 2009 Oct 19]. Available from: http://www.cdc.gov/h1n1flu/ updates/international/ [Google Scholar]
- 2. Webb SA, Pettilä V, Seppelt I, Bellomo R, Bailey M, Cooper DJ, et al. ANZIC Influenza Investigators. Critical care services and 2009 H1N1 influenza in Australia and New Zealand. N Engl J Med. 2009;361:1925–1934. doi: 10.1056/NEJMoa0908481. [DOI] [PubMed] [Google Scholar]
- 3. Lu H, Stratton CW, Tang YW. Outbreak of pneumonia of unknown etiology in Wuhan, China: the mystery and the miracle. J Med Virol. 2020;92:401–402. doi: 10.1002/jmv.25678. [DOI] [PMC free article] [PubMed] [Google Scholar]
- 4. Hui DSI, I Azhar E, Madani TA, Ntoumi F, Kock R, Dar O, et al. The continuing 2019-nCoV epidemic threat of novel coronaviruses to global health: the latest 2019 novel coronavirus outbreak in Wuhan, China. Int J Infect Dis. 2020;91:264–266. doi: 10.1016/j.ijid.2020.01.009. [DOI] [PMC free article] [PubMed] [Google Scholar]
- 5. Huang C, Wang Y, Li X, Ren L, Zhao J, Hu Y, et al. Clinical features of patients infected with 2019 novel coronavirus in Wuhan, China. Lancet. 2020;395:497–506. doi: 10.1016/S0140-6736(20)30183-5. [DOI] [PMC free article] [PubMed] [Google Scholar]
- 6.Australian Government Department of Health and Ageing Guidance for people tested for COVID-19 Canberra, Australian Capital Territory, Australia: Australian Government; 2020[accessed 2020 Nov 19]. Available from: https://www.health.gov.au/sites/default/files/documents/2020/09/coronavirus-covid-19-guidance-for-people-tested-for-covid-19_0.pdf [Google Scholar]
- 7.Australian Government Department of Health and Ageing Coronavirus (COVID-19) at a glance infographic collection Canberra, Australian Capital Territory, Australia: Australian Government; 2020[accessed 2020 Nov 21]. Available from: https://www.health.gov.au/resources/collections/coronavirus-covid-19-at-a-glance-infographic-collection [Google Scholar]
- 8.Worldometer COVID-19 coronavirus pandemic Worldometer; 2020[accessed 2020 Nov 21]. Available from: https://www.worldometers.info/coronavirus/ [Google Scholar]
- 9.Victoria State Government Health and Human Services Victorian coronavirus (COVID-19) data Melbourne, Victoria, Australia: Victoria State Government; 2020[accessed 2020 Nov 21]. Available from: https://www.dhhs.vic.gov.au/victorian-coronavirus-covid-19-data [Google Scholar]
- 10.Australian Government Department of Health and Ageing Review of Australia’s Health Sector Response to Pandemic (H1N1) 2009 Canberra, Australian Capital Territory, Australia: Australian Government; 2011[accessed 2020 Nov 21]. Available from: https://www1.health.gov.au/internet/publications/publishing.nsf/Content/review-2011-l/$File/lessons%20identified-oct11.pdf [Google Scholar]
- 11. Burrell AJC, Pellegrini B, Salimi F, Begum H, Broadley T, Campbell LT, et al. Outcomes of COVID-19 patients admitted to Australian intensive care units during the early phase of the pandemic. Med J Aust. 2021;214:23–30. doi: 10.5694/mja2.50883. [DOI] [PubMed] [Google Scholar]
- 12.Australian Government Department of Health and Ageing Coronavirus disease (COVID-19) epidemiology reports, Australia, 2020 Canberra, Australian Capital Territory, Australia: Australian Government; 2020[accessed 2020 Nov 19]. Available from: https://www1.health.gov.au/internet/main/publishing.nsf/Content/novel_coronavirus_2019_ncov_weekly_epidemiology_reports_australia_2020.htm [Google Scholar]
- 13.Australian Bureau of Statistics 3101.0 - population by age and sex, Australian states and territories Belconnen Australian Capital Territory, Australia: Australian Bureau of Statistics; 2019[accessed 2020 Sep 24] Available from: https://www.abs.gov.au/ausstats/abs@.nsf/0/1CD2B1952AFC5E7ACA257298000F2E76?OpenDocument [Google Scholar]
- 14.Association of Public Health Epidemiologists in Ontario 10 calculating potential years of life lost (PYLL) [Internet] Ontario, Canada: Association of Public Health Epidemiologists in Ontario; 2006[accessed 2020 Sep 24]. Available from: https://web.archive.org/web/20110706164746/http://www.apheo.ca/index.php?pid=190 [Google Scholar]
- 15.Texas Department of State Health Services Years of potential life lost [Internet] Austin, Texas: Texas Department of State Health Services; 2008[accessed 2020 Sep 24]. Available from: https://www.dshs.state.tx.us/chs/vstat/vs05/ypll.shtm [Google Scholar]
- 16. Sukparungsee S, Areepong Y, Taboran R. Exponentially weighted moving average-moving average charts for monitoring the process mean. PLoS One. 2020;15:e0228208. doi: 10.1371/journal.pone.0228208. [DOI] [PMC free article] [PubMed] [Google Scholar]
- 17. Cook DA, Coory M, Webster RA. Exponentially weighted moving average charts to compare observed and expected values for monitoring risk-adjusted hospital indicators. BMJ Qual Saf. 2011;20:469–474. doi: 10.1136/bmjqs.2008.031831. [DOI] [PubMed] [Google Scholar]
- 18. Lawrance RA, Dorsch MF, Sapsford RJ, Mackintosh AF, Greenwood DC, Jackson BM, et al. Use of cumulative mortality data in patients with acute myocardial infarction for early detection of variation in clinical practice: observational study. BMJ. 2001;323:324–327. doi: 10.1136/bmj.323.7308.324. [DOI] [PMC free article] [PubMed] [Google Scholar]
- 19. Sherlaw-Johnson C, Lovegrove J, Treasure T, Gallivan S. Likely variations in perioperative mortality associated with cardiac surgery: when does high mortality reflect bad practice? Heart. 2000;84:79–82. doi: 10.1136/heart.84.1.79. [DOI] [PMC free article] [PubMed] [Google Scholar]
- 20. Tan HB, Cross SF, Goodacre SW. Application of variable life adjusted display (VLAD) in early detection of deficiency in trauma care. Emerg Med J. 2005;22:726–728. doi: 10.1136/emj.2004.017277. [DOI] [PMC free article] [PubMed] [Google Scholar]
- 21.R Core Team R: a language and environment for statistical computing Vienna, Austria: R Foundation for Statistical Computing; 2019[accessed 2021 Jan 2]. Available from: https://www.r-project.org/ [Google Scholar]
- 22.Australian Government Department of Health and Ageing Pandemic (H1N1) Influenza 2009 2010[accessed 2011 Jun 9]. Available from: https://www1.health.gov.au/internet/publications/publishing.nsf/Content/review-2011-l/%24File/lessons%20identified-oct11.pdf
- 23.Australian Government Department of Health and Ageing Coronavirus (COVID-19) current situation and case numbers Canberra, Australian Capital Territory, Australia: Australian Government; 2020[accessed 2020 Oct 5]. Available from: https://www.health.gov.au/news/health-alerts/novel-coronavirus-2019-ncov-health-alert/coronavirus-covid-19-current-situation-and-case-numbers [Google Scholar]
- 24.Dawood F.Rate of death linked to H1N1 15 times higher than previously confirmed Thorofare, NJ: Healio; 2012[accessed Oct 5]. Available from: https://www.healio.com/news/infectious-disease/20120626/rate-of-death-linked-to-h1n1-15-times-higher-than-previously-confirmed [Google Scholar]
- 25. Warrillow S, Austin D, Cheung W, Close E, Holley A, Horgan B, et al. ANZICS guiding principles for complex decision making during the COVID-19 pandemic. Crit Care Resusc. 2020;22:98–102. doi: 10.51893/2020.2.sa1. [DOI] [PMC free article] [PubMed] [Google Scholar]
- 26.Australian and New Zealand Intensive Care Society Guiding principles for complex decision making during pandemic COVID-19 Camberwell, Victoria, Australia: Australian and New Zealand Intensive Care Society; 2020[accessed 2020 Nov 19]. Available from: https://www.anzics.com.au/wp-content/uploads/2020/04/ANZI_3367_Guiding-Principles.pdf [Google Scholar]
- 27.Woolley S.99 per cent of Victoria’s second wave can be traced to one source Sydney, New South Wales, Australia: 7News; 2020[accessed 2020 Nov 19]. Available from: https://7news.com.au/lifestyle/health-wellbeing/99-per-cent-of-victorias-second-wave-can-be-traced-to-one-source-c-1245432 [Google Scholar]
- 28.Horby P, Lim WS, Emberson JR, Mafham M, Bell JL, Linsell L, et al. RECOVERY Collaborative Group Dexamethasone in hospitalized patients with Covid-19 - preliminary report N Engl J Med[online ahead of print] 17 Jul 2020 [Google Scholar]
- 29. Lucas JM, Saccucci MS. Exponentially weighted moving average control schemes: properties and enhancements. Technometrics. 1990;32:1–12. [Google Scholar]
- 30. Roberts G, Tang CB, Harvey M, Kadirkamanathan S. Real-time outcome monitoring following oesophagectomy using cumulative sum techniques. World J Gastrointest Surg. 2012;4:234–237. doi: 10.4240/wjgs.v4.i10.234. [DOI] [PMC free article] [PubMed] [Google Scholar]