

Abstract
Purpose:
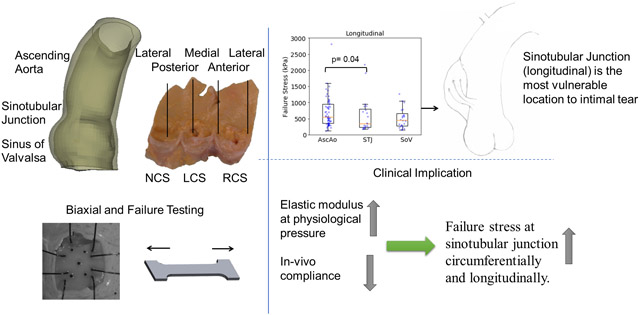
Aortic dissection (AD) is a life-threatening event that occurs when the intimal entry tear propagates and separates inner from outer layers of the aorta. Diameter, the current criterion for aneurysm repair, is far from ideal and additional evidence to optimize clinical decision would be extremely beneficial. Biomechanical investigation of the regional failure properties of aortic tissue is essential to understand and proactively prevent AD. We previously studied biaxial mechanical properties of healthy human aorta. In this study, we investigated the regional failure properties of healthy human ascending aorta (AscAo) including sinuses of Valsalva (SOV), and sinotubular junction (STJ).
Results:
A total of 430 intact tissue samples were harvested from 19 healthy donors whose hearts were excluded from heart transplantation. The donors had mean age of 51±11.7 years and nearly equal gender distribution. Samples were excised from aortic regions and subregions at defined locations. Tissue strips were subjected to either biaxial or uniaxial failure testing. Wall thickness varied regionally being thickest at AscAo (2.08±0.66mm) and thinnest at SOV (1.46±0.31mm). Biaxial testing demonstrated hyperplastic behavior of aortic tissues. Posterior and lateral STJ subregions were found to be stiffer than anterior and medial subregions in both circumferential and longitudinal directions. Failure stresses were significantly higher in the circumferential than longitudinal directions in each subregion of AscAo, STJ, and SOV. Longitudinal failure stresses were significantly greater in AscAo than those in STJ or SOV. Longitudinal failure stresses in AscAo were much smaller anteriorly than posteriorly, and medially than laterally.
Conclusions:
The finding of weakest region at the sinotubular junction along the longitudinal direction corroborates clinical observations of that region being commonly involved as the initial site of intimal tear in aortic dissections. Failure stretch ratios correlated to elastic modulus at each region. Furthermore, strong correlation was seen between STJ failure stresses and elastic modulus at physiological pressure along both circumferential and longitudinal directions. Correlating in-vivo aortic elastic modulus based on in-vivo imaging with experimentally determined elastic modulus at physiological pressure and failure stresses may potentially provide valuable information regarding aortic wall strength. Better understanding of aortic biomechanics in normal physiologic and aneurysmal pathologic states may aid in determining risk factors for predicting dissection in patient-specific fashion.
Keywords: ascending aorta, healthy, failure stress, peak tangent modulus, stretch, biaxial, biomechanics, aortic dissection
Graphical Abstract
Introduction
Aortic complications, including aortic dissection (AD) where the inner layers of the aorta separate from the outer layer and aortic rupture are life-threatening events. About 60% of AD involves the proximal ascending aorta (Type A) while the remainder involves the descending thoracic aorta (type B). Acute type A aortic dissection (TAAD) and aortic rupture carry a very high mortality. Even in the modern era, without surgery, about 20% of patients would die within 24 hours after symptom onset and about 50% would die within 2 weeks(Fann et al., 1995; Tsai et al., 2009)
A major risk factor for aortic complications is ascending thoracic aortic aneurysm (aTAA). Data from the International Registry of Acute Aortic Dissection(IRAD) showed that about 16% of AD patients had known aTAA prior to the onset of AD (Tsai et al., 2009), although this prevalence was likely underestimated since whether aTAA was present prior to AD may not be known. Furthermore, aTAA is increasingly being diagnosed incidentally with computed tomography imaging. Mechanically, as dictated by the LaPlace law, dilation of the ascending aortic (AscAo) wall in aTAA leads to elevated aortic wall stress. When the intimal layer of the aortic wall cannot withstand the stresses, AD can occur due to material failure, while full rupture can also occur from both AD initially or full tear through the wall. Clinically, maximum aTAA diameter is widely used as a surrogate of aortic wall stress to evaluate the risk of aortic complications among aneurysmal patients. Current guidelines recommend surgery for patients with maximum aortic diameter ≥5.5cm and conservative monitoring for patients with maximum aortic diameter <5.5cm (Hiratzka et al., 2010). Aortic diameter alone, however, is known to be a poor predictor of aortic complication risk. Previous data shows that about over half of AD patients have aortic diameter <5.5cm (Jaussaud et al., 2013; Pape et al., 2007). A better risk stratification strategy than the diameter-based approach is therefore clearly needed for better management of aTAA patients. A working hypothesis is that a biomechanics approach, based directly on the principle that tissue failure can result when stress exceeds strength, could greatly improve risk stratification for AD and aortic rupture. For the biomechanics-based approach, knowledge of the aortic wall stress and wall strength, defined as the ultimate stress level where tissue rupture occurs is required.
In this work we sought to explore the regional variation of mechanical properties and failure strength of healthy ascending aortic (AscAo) tissue via stretching experiments. Our previous research focused primarily on regional mechanical properties of the normal aortic root, ascending aorta, as well as aTAA, but did not examine normal aortic failure mechanics (Azadani et al., 2012a; Azadani et al., 2012b). Other groups investigating AscAo biaxial mechanical properties and/or uniaxial failure strength mostly focused on aTAA tissue (Iliopoulos et al., 2009a; Okamoto et al., 2002; Pasta et al., 2012). Limited studies of healthy ascending aorta using autopsy specimens were investigated primarily as a control group to compare with aTAA tissues as opposed to detailed comparisons of regions and subregions within the healthy AscAo (Choudhury et al., 2009; Chung et al., 2020b; Deveja et al., 2018; Iliopoulos et al., 2009b). Other studies focused on the regional failure properties of healthy and aneurysmal SOV (Iliopoulos et al., 2013; Kritharis et al., 2014). The current study compliments our earlier work (Azadani et al., 2012a), by providing a detailed look into normal aortic regional failure properties.
Materials and Methods
Human Aortic tissue Acquisition.
The collection and experimental study of normal human aortic root and ascending aorta was approved by the University of California San Francisco Committee of Human Research and San Francisco Veterans Affairs Institutional Review Board. Twenty-three normal aortic roots and ascending aorta with valve leaflets from the left ventricle outflow tract to the innominate artery were collected when other organs were harvested for transplantation from Donor Network West. The acquired aortic roots and ascending aorta were excluded from heart transplantation due to noncardiac causes. The selection criteria were donors who had no history of cardiovascular disease and had no drug history. Demographics are listed (Table 1).
Table 1.
Patient Demographics
| Gender | |
| Male | n=10 (53%) |
| Female | n=9 (47%) |
| Age | |
| Mean | 51±11.7 |
| Range | 23-70 |
| Ethnicity | |
| Caucasian | 7(37%) |
| Asian | 4(21%) |
| Hispanic | 6(32%) |
| African Americans | 1(5%) |
| Native American | 1(5%) |
| Known risk factors and comorbidities | |
| Hypertension | 7(37%) |
Biomechanical Testing.
The collected samples were cryopreserved using a cryopreservation system after cardioplegic arrest and organ recovery and stored in the −80°C freezer for a few months until testing. The tissues underwent a dedicated cryopreservation protocol to prevent tissue damage, which first began with gradual temperature reduction to −30°C at a rate of 0.5°C/min, followed by temperature reduction to −80°C at 5°C/min. The tissues were thawed in 37°C water bath before testing and were tested within 24 hours after thawing. The protocol was chosen based upon its use for preserving and thawing aortic homografts which clinically are used for surgical aortic root replacement in infective endocarditis. Two sizes of samples were used for testing: 12mmx12mm square for biaxial stretch testing and dog-bone shape for failure testing. The dog-bone area for failure testing was 10mmx2.5mm rectangle (figure 1a). Samples were carefully planned and dissected according to region, ascending aorta (AscAo), sinotubular junction (STJ). or sinuses of Valsalva (SOV), subregion (anterior, medial, posterior, lateral), and orientation (circumferential or longitudinal) (figure 1b). The sinotubular junction was taken as the section immediately superior to where the commissures of the leaflets meet. Biaxial samples underwent equibiaxial stretch testing with up to 70% applied strain. Failure testing samples were stretched fully to break point for failure testing.
Figure 1a.

Sketch of biaxial and failure sample dimensions. 1b. Subregions of ascending aorta and aortic root. 1c. Sketch of the simplified model with distinct diameter and thickness. 1d. Representative plot of failure stress vs stretch. Dotted lines are labeled to describe the point where failure stress and stretch are measured. In addition, two dotted lines are labeled to describe the elastic and peak tangent moduli.
A custom-built planar biaxial stretching system was used to determine material properties. The details of biaxial tensile testing methods and analyses have been described previously (Azadani et al., 2012a; Azadani et al., 2012b). Specimen wall thickness was measured with a digital caliper by lightly sandwiching tissue between two glass slides. Five black micro-ceramic markers were placed on the tissue surface for extensometer tracking for biaxial testing. The specimens were floated in a water bath with Dulbecco’s phosphate buffered saline at 37 °C. The load cell capacity was 5 lbs with 1% accuracy. The strain rate was 0.05mm/s after 10 preconditioning cycles. Uniaxial testing was carried out on the same fixture but with one axis. Strain was derived from the applied displacement due to the extreme deformation of tissues surface during failure testing.
Equations and Definitions.
Terms used to describe the biaxial and failure mechanical properties of aortic root and ascending aorta are briefly explained here for clarity. Aortic tissue deforms with stretch (L is the deformed length and L0 is the unloaded sample length) and true strain εT under applied force F. True stress and true strain for incompressible materials is derived as
| (1) |
| (2) |
where W and T are the unloaded sample width and thickness. Tangent modulus Ei is defined as the slope of the stress–strain curve which describes the tissue stiffness at given point i (i=peak, slope before failure or elastic, slope at physiological pressure).
| (3) |
For the nonlinear property of aortic tissue, elastic tangent modulus was obtained at physiologic stress of AscAo, STJ, and SOV, along the circumferential and longitudinal directions, respectively. Physiologic stress of aortic root and ascending aorta was calculated using a simplified finite element model with distinct diameter and thickness of AscAo (diameter = 22mm, thickness =2.1mm), STJ (diameter=24mm, thickness = 1.9mm) and SOV (diameter = 26mm, thickness=1.5mm) (figure 1c). Circumferential and longitudinal stresses were simulated at mean aortic pressure of 93mmHg (Table 2).
Table 2.
Normalized cylinder dimension and stress at physiological pressure.
| Ascending Aorta |
Sinotubular Junction |
Sinus | |
|---|---|---|---|
| Diameter | 22mm | 24mm | 26mm |
| Thickness | 2.1mm | 1.9mm | 1.5mm |
| Material parameters | |||
| K1 | 1.1 | 14.1 | 18.5 |
| K2 | 29.9 | 47.0 | 55.4 |
| Angle | 33.9 | 28.2 | 33.1 |
| Average stress under mean physiological pressure | |||
| Circumferential | 147.8kPa | 185.3 kPa | 157.8 kPa |
| Longitudinal | 66.7 kPa | 94.9 kPa | 108.2 kPa |
To quantify the failure property, failure stress σf and failure stretch ratio λf are the maximum value of stress or stretch that the aortic tissue can resist.
| (4) |
| (5) |
After failure stress is reached (figure 1d), the aortic tissue starts losing its strength and eventually breaks apart. Failure tangent modulus is defined as the slope of the linear portion of the stress-stretch curve just before aortic tissue failure.
Statistical Analysis.
Normal distribution of tangent modulus, ultimate stress, and failure stretch were first tested for all regions using the Kolmogorov-Smirnov test. Consequently, the Mann–Whitney U test was utilized to compare tangent modulus, ultimate stress, and failure stretch of different regions. Similarly, differences in orientation were assessed with the Mann–Whitney U test. Continuous measurements of sample thickness, failure strain, failure stress, failure stretch, and tangent modulus were presented as median and (25%-75%) interquartile range. Categorical measurements are presented as numbers and percentages. Spearman rank correlation coefficients were used to determine relationship between tangent modulus at physiological range and failure stress and stretch. Statistical analyses were performed using R (R 3.4.0 http://www.r-project.org).
Results
Study Demographics.
Aortic root and ascending aortic tissue from 23 donors were collected for the current study, of which tissues from 4 donors were excluded from the current study due to aneurysmal dilation of the AscAo and/or root (Table 1). Total 233 biaxial and 197 failure testing specimens from 19 donors were subjected to mechanical testing and were included in the statistical analysis. Specimens were categorized into groups according to a) region: AscAo/STJ/SOV; b) subregion: anterior/medial/posterior/lateral, where medial reflects aorta next to pulmonary artery and lateral represents the greater curvature by superior vena cava; and c) orientation: longitudinal/circumferential.
Thickness.
Median AscAo thicknesses were 2.0mm (1.7, 2.2), 1.87mm (1.7, 2.28), 2.18mm (1.8, 2.4), and 2.1mm (1.76, 2.35) at anterior, medial, posterior, and lateral subregions, respectively (fig 2). At STJ, thicknesses were 1.7mm (1.57, 1.97), 1.99mm (1.7, 2.18), 1.9mm (1.6, 2), and 1.82mm (1.62, 2.0) at the anterior, medial, posterior, and lateral subregions, respectively. Thicknesses of SOV were 1.5mm (1.31, 1.6), 1.5mm (1.28, 1.65), and 1.5mm (1.3, 1.6) at the right coronary sinus (RCS), left coronary sinus (LCS), and non-coronary sinus (NCS), respectively. Wall thickness gradually thinned from AscAo to STJ and was thinnest at SOV.
Figure 2:

Thickness in regions and subregions of aortic root and ascending aorta.
Biaxial Testing.
Biaxial stress-strain curves of healthy AscAo at anterior, medial, posterior, and lateral subregions along the circumferential (fig 3a-3d) and longitudinal directions (fig 3e-3h) were nonlinear. The stress-strain relationship was relatively linear when the deformation was small (<10%) but transitioned to canonical exponential relationship when the strain increased. Stresses ranged from 100 to 300kPa for strain within 0.1 to 0.4.
Figure 3:

Biaxial stress-strain curves of subregions of healthy ascending aorta along the circumferential(a-d) and longitudinal directions (e-h).
Biaxial stress-strain curves of STJ at anterior, medial, posterior, and lateral subregions (fig 4a-h) presented similar nonlinear behavior as AscAo. The posterior and lateral subregions were stiffer than the anterior and medial of STJ in both circumferential and longitudinal directions. Biaxial stress-strain curves of SOV were analyzed by RCS, LCS and NCS subregions along the circumferential (fig 5a-c) and longitudinal (figure 5d-f) directions, respectively. No obvious differences of stress-strain relationship were observed among the three sinus locations.
Figure 4:

Biaxial stress-strain curves of the subregions of healthy sinotubular junction along the circumferential(a-d) and longitudinal directions (e-h).
Figure 5:

Biaxial stress-strain curves of the subregions of healthy sinuses of Valsalva along the circumferential(a-c) and longitudinal directions (d-f).
Failure Stress.
Representative failure properties for each region AscAo, STJ, and SOV are shown (fig 6). Failure stresses of AscAo were extracted from each test (fig. 7). Failure stresses were grouped into the same regions as the biaxial testing including AscAo, STJ, and SOV. Failure stresses were significantly smaller in the longitudinal than circumferential direction in the AscAo (1139kPa (868, 1554) vs 546kPa (355, 952), p<0.001, respectively), STJ (1233kPa (693, 1708) vs 348kPa (230, 797), p<0.001, respectively), and SOV (1344kPa (874, 2576) vs 454kPa (279, 657), p<0.001, respectively). Failure stresses in general remained smaller longitudinally than circumferentially for each subregion, anterior/medial/posterior/lateral of AscAo and STJ, and RCS/LCS/NCS of SOV (Supplemental Table 3). AscAo longitudinal failure stresses were significantly greater than those at STJ (546kPa (355, 952) vs 348kPa (230, 797), p=0.04, respectively) (Supplemental Table 4). The failure stress was weakly inversely correlated to age (r = −0.15, p=0.04) and hypertension (r=−0.16, p=0.03).
Figure 6:

Representative failure behavior at regions of aortic root and ascending aorta along the circumferential (a-c) and longitudinal (d-f) directions.
Figure 7:

Failure stresses at regions (a, e) and subregions (b-d, f-h) of aortic root and ascending aorta along the circumferential(a-d) and longitudinal directions (e-h). The raw data (dots) were overlaid on the median and (25%, 75%) interquartile range.
* denotes the statistically significant differences in ascending aorta between circumferential (circ) and longitudinal (long) directions - AscAo circ vs long, p=0.001; AscAo anterior circ vs long, p=0.003; AscAo medial circ vs long, p<0.001; AscAo posterior circ vs long, p=0.013.
# denotes the statistically significant differences in sinotubular junction between circumferential and longitudinal directions - STJ circ vs long, p<0.001; STJ anterior circ vs long, p=0.031; STJ medial circ vs long, p=0.015.
^ denotes the statistically significant differences in sinus of Valsalva between circumferential and longitudinal directions - SOV circ vs long, p<0.001.
Failure Stretch.
Failure stretch ratios at the ultimate stress were determined (fig. 8) for each region. Failure stretch was significantly greater in the longitudinal than circumferential direction only in the STJ region. Regionally, failure stretch ratio was larger circumferentially in the AscAo than STJ (1.94 (1.57, 2.25) vs 1.57 (1.42, 1.90), p=0.003, respectively). Subregionally at the STJ, failure stretch ratio was larger longitudinally in the medial than lateral direction (2.02 (1.88, 2.32) vs 1.70 (1.66, 1.82), p=0.041, respectively) (Table 5 supplement). The failure stretch was inversely correlated to age (r = −0.5, p<0.001) and weakly to hypertension (r=−0.2, p=0.005).
Figure 8:

Failure stretches at regions (a, e) and subregions (b-d, f-h) of aortic root and ascending aorta along the circumferential(a-d) and longitudinal directions (e-h). The raw data (dots) were overlaid on the median and (25%, 75%) interquartile range. The raw data (dots) were overlaid on the median and (25%, 75%) interquartile range.
# denotes the statistically significant differences in sinotubular junction between circumferential and longitudinal directions - STJ circ vs long, p=0.034; STJ medial circ vs long, p=0.023.
^ denotes the statistically significant differences in sinus of Valsalva between circumferential and longitudinal directions - SOV circ vs long, p=0.048.
Peak Tangent Modulus.
Peak tangent modulus defined as the slope of the linear portion of the uniaxial failure stress-stretch curve just before sample failure occurs is shown in fig 9 for AscAo, STJ, and SOV. Similar to failure stresses, peak tangent moduli were significantly higher in the circumferential than longitudinal directions in AscAo (3444 kPa (2398, 4639) vs 1419kPa (918, 2367), p<0.001, respectively), STJ (4272kPa (2830, 8809) vs 1151kPa (536, 2718), p<0.001, respectively) and SOV (5693kPa (2586, 9536) vs 866kPa (397, 1322), p<0.001, respectively) (Supplemental Table 3). Peak tangent moduli were significantly smaller in the AscAo vs STJ (3444kPa (2398, 4639) vs 4272kPa (2830, 8809), p=0.027, respectively) along the circumferential direction but significantly greater in the AscAo vs SOV (1419kPa (918, 2367) vs 866kPa (397, 1322), p=0.005, respectively) along the longitudinal direction (Supplemental Table 4, Figure 9). The peak tangent modulus was not correlated to either age or hypertension.
Figure 9:

Peak tangent moduli at regions (a, e) and subregions (b-d, f-h) of aortic root and ascending aorta along the circumferential(a-d) and longitudinal directions (e-h). The raw data (dots) were overlaid on the median and (25%, 75%) interquartile range.
In * denotes the statistically significant differences in ascending aorta between circumferential (circ) and longitudinal (long) directions - AscAo circ vs long, p=0.001; AscAo anterior circ vs long, p<0.001; AscAo medial circ vs long, p<0.001; AscAo posterior circ vs long p=0.01; AscAo lateral circ vs long p=0.037.
# denotes the statistically significant differences in sinotubular junction between circumferential and longitudinal directions - STJ circ vs long, p<0.001; STJ anterior circ vs long, p=0.015; STJ medial circ vs long p=0.004; STJ lateral circ vs long, p=0.041.
λ denotes the statistically significant differences in sinus of Valsalva between circumferential and longitudinal directions - SOV cir vs long, p<0.001; SOV left coronary sinus circ vs long p=0.042; SOV non-coronary sinus circ vs long, p=0.008.
Discussion
In this work we investigated the regional wall material properties of normal aortic tissue, including their biaxial stretch properties and corresponding failure strength. Aortic tissue samples were collected from donors that were rejected for transplantation but had no cardiac disease or known aortic pathology. The material properties should be considered as representative for normal human aortic roots and ascending aorta. We found that the failure stresses were significantly higher along the circumferential than longitudinal direction in the AscAo, STJ, and SOV. Similarly, peak elastic tangent moduli for AscAo, STJ, and SOV were significantly higher in the circumferential than longitudinal direction. Longitudinal failure stresses were found to be the lowest at the STJ region.
Anisotropic Failure Stresses Along Circumferential and Longitudinal Directions
It is now well established that the collagen fibers are the primary load bearing component in aortic tissue. The macro-scale mechanical behavior is a reflection of the microscale structure of collagen fibers(Cacho, 2007; Sacks, 2003). The mechanical properties and microstructure of collagen fibers have a dominant impact on the measured tissue material properties and failure strength. At the reference configuration, collagen fibers in the aortic wall are crimped to a wavy configuration and the fibers have different waviness or compression levels. When the tissue is stretched, the collagen fibers least compressed and wavy will be straightened first, leading to the initial rise along the stress-strain curve. As the tissue stretch ratio increases, more and more collagen fibers would be straightened. The incremental recruitment of collagen fibers leads to the macro-scale observed nonlinear stress-strain relationship widely observed in aortic tissue where the elastic modulus continuous to rise. Once all collagen fibers straighten, the stress-strain relationship would transition to a linear region. The elastic modulus stops increasing and this is where the peak tangent elastic modulus is observed. As the tissue is stretched further, some collagen fibers that are stretched most would reach the break point ahead of others and start to fail thus giving rise to the yielding of stress-strain relationship as seen in figure 1d. Tissue failure is observed when significant number of collagen fibers have ruptured.
The different mechanical properties that we measured in this study are affected by different collagen fiber microstructure. The initial non-linear stress-stress relationship observed in both the biaxial stretching and uniaxial-failure testing were due to the distribution of fiber compression and quantity of total fibers. Peak tangent modulus was a function of amount of collagen fibers and the elastic modulus of individual fibers. Ultimate failure stress was determined by the amount of collagen fibers and the strength of the individual fibers. Failure stretch ratio, at which rupture of the stretched sample occurs, was a function of the initial compression level of collagen fibers.
In this work, the observed failure stresses (Supplement Table 3) were in general significantly higher in the circumferential than longitudinal directions in each subregion of the AscAo, STJ, and SOV. Peak tangent moduli just before tissue failure were also larger in the circumferential than longitudinal direction. These results are in good agreement with previous microscale observation that collagen fibers are more densely aligned along the circumferential than longitudinal direction in both healthy and aneurysmal aortic tissues(Sokolis et al., 2012; Tsamis et al., 2013). The same directional difference was demonstrated in previous studies of failure properties of healthy aortic controls compared to aneurysms at the region of ascending aorta (Deveja et al., 2018; Iliopoulos et al., 2009b) and sinus of Valsalva (Kritharis et al., 2014). Similarly, intimal and adventitia layers of normal aorta showed the same directional difference of ultimate tensile strength with weaker half on the intimal rather than adventitial side (Pasta et al., 2012). The magnitude of the failure stress, failure stretch, and peak tangent modulus were in good agreement with previous studies of normal aortic controls in those aneurysm studies(Iliopoulos et al., 2009b; Kritharis et al., 2014). Similarly, in biaxial stretching, the circumferential direction generally showed more rapid increase of the nonlinearity which presented as a steeper increase in stress as elongation increased, similar to that seen in our previous biaxial studies of ascending aorta and sinus of Valsalva(Azadani et al., 2013; Azadani et al., 2012a). In contrast, the failure stretch ratios along the circumferential and longitudinal directions were not significantly different except in the STJ (p= 0.03) and SOV (p=0.048), while no directional differences of failure stretch were reported for the ascending aorta (Iliopoulos et al., 2009b) nor the sinus of Valsalva (Kritharis et al., 2014) for healthy tissues. Our evaluation of the STJ separately adds information not previously presented in the literature, which reflects clinical experiences with vulnerability of that region for dissection. Furthermore, all the prior normal controls used “fresh” tissue obtained at autopsy; however, the timing of death and the timing of autopsy can be quite variable without any true tissue preservation in the intervening period. Because our samples were taken from living donors using cardioplegic arrest, tissue preservation solutions, followed by cryopreservation, we were able to capture the specimens without significant degradation time as autopsy specimens.
Clinically, acute AD begins as initial intimal tear, which is most often transverse to the long axis of the aorta(Duprey et al., 2016; Dzau and Creager, 2005; Jaussaud et al., 2013). In over 95% of AD cases, AD begins as a transverse tear through the intima and inner layers of the media, with only 2% to 4% not originating from an intimal tear alone(Ring, 2000). Our data explains this clinically observed initial transverse tear in AD. Because the failure stresses required to exceed wall strength are so much lower in the longitudinal than circumferential direction in the AscAo, STJ, and SOV, the longitudinal break results in a transverse tear.
Regional Susceptibility to AD
Compared with AscAo, STJ longitudinal failure stresses were significantly lower (p=0.04). There were no significant differences in longitudinal failure stresses between STJ and SOV (p=0.4), but tended to be larger in the AscAo than SOV (p=0.05). While rare to compare failure properties among the regions of the ascending aorta, sinotubular junction, and sinus of Valsalva from the same patient/donor, the previously reported average longitudinal failure stresses of sinus of Valsalva was smaller than the longitudinal failure stresses at the ascending aorta of healthy older adults (~500 kPa vs ~1000 kPa) (Iliopoulos et al., 2009b; Kritharis et al., 2014). Clinically, limited studies have described intimal tear locations in acute AD. Our previous study found 18% of intimal tears occurred in SOV, with 29% in STJ, 29% in AscAo, and 24% in arch (Jaussaud et al., 2013). Nissen et al found the proximal intimal tear within the aortic root (SOV) in 24% of AD, in AscAo 61%, arch 10%, and retrograde from descending thoracic aorta 5%(Nissen et al., 2019). Januzzi et al. found initial tear was located in SOV for 24%, STJ for 8%, AscAo for 27%, and 41% for distal to AscAo among 951 patients (Januzzi et al., 2004). Another study showed ~70% of AD originated from a tear in AscAo most commonly just above the STJ, while 20% originated in the descending aorta usually just distal to the left subclavian artery, with only 10% originating within the transverse aortic arch(Ring, 2000). Our data suggests that the STJ region may be mechanically more prone to AD than AscAo at least in this normal population of healthy adults. In a given patient, intimal tear location would be driven by which region had wall stress exceed wall strength. Proportionally greater AscAo wall stresses to strength may result in intimal tear in that location despite weaker wall strength in the STJ if stresses were disproportionately lower.
Interestingly, the longitudinal failure stresses differed in AscAo subregions (Table 5 supplement). Anterior AscAo longitudinal failure stresses were significantly smaller than those in the posterior subregion (p=0.046). Longitudinal failure stresses in medial AscAo were lower than those in the posterior and lateral subregions (p=0.004 and p=0.007, respectively). Our observation of the difference in AscAo subregions supports the prior finding that longitudinal failure stress laterally was higher than anteriorly and medially regions for healthy aortas(Iliopoulos et al., 2009b). No statistically significant differences in failure stresses were demonstrated within the STJ or SOV subregions along the longitudinal direction. Our results suggest that the subregions in AscAo at highest risk of initiating intimal tear were medially along the AscAo lesser curvature followed by anterior AscAo.
Correlation between failure property and physiological elastic modulus.
Currently, we cannot directly measure in vivo aortic wall failure strength as it requires destruction of aortic tissue. The best alternative is to use surrogate markers that are relatively easy to acquire to estimate failure strength. In this work, we investigated usability of relative aortic elastic modulus within the physiological range as a surrogate for aortic wall strength. In most subregions, we found that the correlation between relative elastic modulus and aortic wall strength was quite poor. The only region that reached statistical significance was the STJ, along both the circumferential and longitudinal directions (r=0.46, p=0.009 and r=0.66, p=0.001, respectively) (fig 9). It should be noted that the physiological elastic modulus that we measured in this work is the incremental elastic modulus under physiological pressure loading conditions. This quantity is often measured as the change of aortic diameter or area over the change of aortic blood pressure with in vivo imaging as in vivo distensibility. Finite element analysis (FEA) technology can be used to link these distensibility parameters quantitatively. However, these results were found in normal not diseased aortic tissue and may not be applicable to aneurysmal disease or dissection related to aneurysmal disease. One study showed bicuspid aortic valve associated-aneurysms had higher elastic modulus than normal aortas especially when measured in the longitudinal direction(Chung et al., 2020a). However, no significant differences were seen in inner vs outer curvature given the small number of normal aortic controls (n=9). In general, aneurysmal disease has medial degeneration, loss of anisotropy, changes in collagen curvature that impact elastic modulus(Chung et al., 2017; Jones et al., 2020). Our results may be applicable in patients susceptible to dissection with non-aneurysmal disease—the clinical correlation being dissection occurring in patients with normal aortas that use cocaine or methamphetamines and present acutely. Nonetheless, further investigation is required to determine if elastic modulus can be a surrogate to estimate wall strength in vivo in normal aortic tissue at the STJ region.
In addition, the failure stretches did correlate to physiological elastic modulus at physiological pressure in all the regions and along both the circumferential and longitudinal directions (fig 10). Correlation coefficients of failure stretch ratio to elastic modulus in the AscAo were r=−0.84, p<0.001, in STJ were r=−0.65, p<0.001, and in SOV were r=−0.62, p=0.02 along the circumferential direction; and were r=−0.65, p<0.001 in the AscAo, r=−0.72, p<0.001 in the STJ, and r=−0.72, p<0.001 in the SOV along the longitudinal direction, respectively. As we discussed earlier because failure stretch is determined by the compression level and amount of collagen fibers, and these parameters affect aortic tissue distensibility, the correlation between failure stretch and physiological elastic modulus is partly due to collagen fiber structure at the microscale level. The impact of failure stretch ratio and compliance at STJ at failure clinically is unknown without examining what occurs in the STJ of diseased aneurysms for comparison.
Figure 10.

Correlation between failure stresses and relative elastic tangent modulus at sinotubular junction along the circumferential and longitudinal directions.
Lastly, we also found highly positive correlation of failure stress with peak tangent modulus as reported by Sokolis’s group (Deveja et al., 2018); however, peak tangent modulus is not an in-vivo measurable parameter. While the opposite is true for diseased aneurysmal tissue with medial degeneration and disruption of collagen fiber organization, these results reflect that of normal aortic tissue without such derangements. Increased collagen content and preferred collagen fiber alignment would intuitively be expected to lead to increased peak tangent modulus. The collagen fiber waviness distribution would impact at what stretch ratio the tissue would fail. The peak tangent elastic modulus was significantly higher in the circumferential direction than the longitudinal direction, suggesting there is preferential alignment of fibers in aortic wall. The regional differences of tangent modulus could be an indication that there are regional differences in terms of collagen fiber content and/or alignment. Our findings here warrant future study of microscale collagen fiber structures and their relationship to the macro-scale tissue material properties.
Limitations
The current study concentrated on the mechanical evaluation of healthy aortic tissue. Tissue microstructure was not investigated in this study. While experimental studies of the effects of cryopreservation on mechanical properties of arteries have mixed conclusions (Chow and Zhang, 2011; Devireddy et al., 2003; Hemmasizadeh et al., 2012; Venkatasubramanian et al., 2006; Venkatasubramanian et al., 2010), the potential effect of cryopreservation does not affect our conclusions regarding the results from region and subregion aortic comparisons because all aortic specimens were subjected to the same cryopreservation and thawing procedure. This protocol was derived from those used for aortic homografts which are used clinically in surgery to replace the aortic root and ascending aorta. Our study had the advantage of diversity in age, gender, and ethnic groups, but the sample size was not sufficiently large to determine the effects of age, gender, and ethnicity on the failure properties of healthy aortic tissue. Future study with larger cohorts will be needed to determine the impact of those considerations on failure properties. The physiological stress calculated from the computational simulation was based on a simplified cylindrical model which did not reflect the curvature and diameter of each specific aortic root and ascending aorta. We used that as a consistent threshold to analyze the failure parameters among specimens. While the calculated physiological stress was within close approximation for each aorta because the stress-strain curve was in a relative linear region under physiological pressure, future studies will examine the physiologic stresses in a donor-specific fashion using finite element modeling. Such analyses were beyond the scope of this study. While the sinotubular junction was demonstrated to be the weakest region subject to transverse intima tear, it may not hold true for the specific patient with aortic pathophysiology or aneurysms because those tissues have weakened medial degeneration and the biomechanical properties will be affected by the microstructure changes(Chung et al., 2017; Jones et al., 2020).
Conclusions
We presented a comprehensive experimental study of healthy human aortic tissue. Correlation was found between failure stress and elastic modulus at physiological pressure at the sinotubular junction along both the circumferential and longitudinal directions. Also, failure stretch ratios were correlated to elastic modulus at all regions. The weakest region was the sinotubular junction along the longitudinal direction with the lowest failure stresses. Failure stresses were significantly lower along the longitudinal than circumferential direction in the same subregion. Failure stretches were similar in all subregions.
Supplementary Material
Figure 11.

Correlation between failure stretch ratio and elastic tangent modulus at regions of aortic root and ascending aorta along the circumferential and longitudinal directions.
Funding:
The study was funded by National Institutes of Health R01HL119857, National Institutes of Health K25HL150408, American Heart Association Postdoctoral Fellowship 16POST31420013, and AHA 20POST35211107, and Marfan Foundation Victor A. McKusick Fellowship.
Abbreviations:
- STJ
sinotubular junction
- AD
Aortic dissection
- AscAo
ascending aorta
- SOV
sinuses of Valsalva
- mm
millimeter
- kPa
kilopascal
- MPa
megapascal
Footnotes
Conflict of Interest Statement: The authors have no conflicts of interest to declare.
References
- Azadani AN, Chitsaz S, Mannion A, Mookhoek A, Wisneski A, Guccione JM, Hope MD, Ge L, Tseng EE, 2013. Biomechanical properties of human ascending thoracic aortic aneurysms. Ann Thorac Surg 96, 50–58. [DOI] [PubMed] [Google Scholar]
- Azadani AN, Chitsaz S, Matthews PB, Jaussaud N, Leung J, Tsinman T, Ge L, Tseng EE, 2012a. Comparison of mechanical properties of human ascending aorta and aortic sinuses. Ann Thorac Surg 93, 87–94. [DOI] [PubMed] [Google Scholar]
- Azadani AN, Chitsaz S, Matthews PB, Jaussaud N, Leung J, Wisneski A, Ge L, Tseng EE, 2012b. Biomechanical comparison of human pulmonary and aortic roots. European journal of cardio-thoracic surgery : official journal of the European Association for Cardio-thoracic Surgery 41, 1111–1116. [DOI] [PubMed] [Google Scholar]
- Cacho F, Elbischger PJ, Rodríguez JF, Doblaré M, Holzapfel GA, 2007. A constitutive model for fibrous tissues considering collagen fiber crimp. International Journal of Non-Linear Mechanics 42, 391–402. [Google Scholar]
- Choudhury N, Bouchot O, Rouleau L, Tremblay D, Cartier R, Butany J, Mongrain R, Leask RL, 2009. Local mechanical and structural properties of healthy and diseased human ascending aorta tissue. Cardiovascular Pathology 18, 83–91. [DOI] [PubMed] [Google Scholar]
- Chow MJ, Zhang Y, 2011. Changes in the mechanical and biochemical properties of aortic tissue due to cold storage. J Surg Res 171, 434–442. [DOI] [PubMed] [Google Scholar]
- Chung J, Lachapelle K, Cartier R, Mongrain R, Leask RL, 2017. Loss of mechanical directional dependency of the ascending aorta with severe medial degeneration. Cardiovasc Pathol 26, 45–50. [DOI] [PubMed] [Google Scholar]
- Chung JC, Wong E, Tang M, Eliathamby D, Forbes TL, Butany J, Simmons CA, Ouzounian M, 2020a. Biomechanics of Aortic Dissection: A Comparison of Aortas Associated With Bicuspid and Tricuspid Aortic Valves. Journal of the American Heart Association 9, e016715. [DOI] [PMC free article] [PubMed] [Google Scholar]
- Deveja RP, Iliopoulos DC, Kritharis EP, Angouras DC, Sfyris D, Papadodima SA, Sokolis DP, 2018. Effect of aneurysm and bicuspid aortic valve on layer-specific ascending aorta mechanics. The Annals of thoracic surgery 106, 1692–1701. [DOI] [PubMed] [Google Scholar]
- Devireddy RV, Neidert MR, Bischof JC, Tranquillo RT, 2003. Cryopreservation of collagen-based tissue equivalents. I. Effect of freezing in the absence of cryoprotective agents. Tissue engineering 9, 1089–1100. [DOI] [PubMed] [Google Scholar]
- Duprey A, Trabelsi O, Vola M, Favre J-P, Avril S, 2016. Biaxial rupture properties of ascending thoracic aortic aneurysms. Acta biomaterialia 42, 273–285. [DOI] [PubMed] [Google Scholar]
- Dzau VJ, Creager MA, 2005. Diseases of the aorta. HARRISONS PRINCIPLES OF INTERNAL MEDICINE 16, 1481. [Google Scholar]
- Fann JI, Smith JA, Miller DC, Mitchell RS, Moore KA, Grunkemeier G, Stinson EB, Oyer PE, Reitz BA, Shumway NE, 1995. Surgical management of aortic dissection during a 30-year period. Circulation 92, 113–121. [DOI] [PubMed] [Google Scholar]
- Hemmasizadeh A, Darvish K, Autieri M, 2012. Characterization of changes to the mechanical properties of arteries due to cold storage using nanoindentation tests. Ann Biomed Eng 40, 1434–1442. [DOI] [PMC free article] [PubMed] [Google Scholar]
- Hiratzka LF, Bakris GL, Beckman JA, Bersin RM, Carr VF, Casey DE Jr., Eagle KA, Hermann LK, Isselbacher EM, Kazerooni EA, Kouchoukos NT, Lytle BW, Milewicz DM, Reich DL, Sen S, Shinn JA, Svensson LG, Williams DM, 2010. 2010 ACCF/AHA/AATS/ACR/ ASA/SCA/ SCAI/SIR/STS/SVM Guidelines for the diagnosis and management of patients with thoracic aortic disease. A Report of the American College of Cardiology Foundation/American Heart Association Task Force on Practice Guidelines, American Association for Thoracic Surgery, American College of Radiology,American Stroke Association, Society of Cardiovascular Anesthesiologists, Society for Cardiovascular Angiography and Interventions, Society of Interventional Radiology, Society of Thoracic Surgeons,and Society for Vascular Medicine. J Am Coll Cardiol 55, e27–e129. [DOI] [PubMed] [Google Scholar]
- Iliopoulos DC, Deveja RP, Kritharis EP, Perrea D, Sionis GD, Toutouzas K, Stefanadis C, Sokolis DP, 2009a. Regional and directional variations in the mechanical properties of ascending thoracic aortic aneurysms. Medical engineering & physics 31, 1–9. [DOI] [PubMed] [Google Scholar]
- Iliopoulos DC, Kritharis EP, Boussias S, Demis A, Iliopoulos CD, Sokolis DP, 2013. Biomechanical properties and histological structure of sinus of Valsalva aneurysms in relation to age and region. Journal of biomechanics 46, 931–940. [DOI] [PubMed] [Google Scholar]
- Iliopoulos DC, Kritharis EP, Giagini AT, Papadodima SA, Sokolis DP, 2009b. Ascending thoracic aortic aneurysms are associated with compositional remodeling and vessel stiffening but not weakening in age-matched subjects. The Journal of thoracic and cardiovascular surgery 137, 101–109. [DOI] [PubMed] [Google Scholar]
- Januzzi JL, Isselbacher EM, Fattori R, Cooper JV, Smith DE, Fang J, Eagle KA, Mehta RH, Nienaber CA, Pape LA, International Registry of Aortic, D., 2004. Characterizing the young patient with aortic dissection: results from the International Registry of Aortic Dissection (IRAD). Journal of the American College of Cardiology 43, 665–669. [DOI] [PubMed] [Google Scholar]
- Jaussaud N, Chitsaz S, Meadows A, Wintermark M, Cambronero N, Azadani AN, Saloner DA, Chuter TA, Tseng EE, 2013. Acute type A aortic dissection intimal tears by 64-slice computed tomography: a role for endovascular stent-grafting? J Cardiovasc Surg (Torino) 54, 373–381. [PubMed] [Google Scholar]
- Jones B, Tonniges JR, Debski A, Albert B, Yeung DA, Gadde N, Mahajan A, Sharma N, Calomeni EP, Go MR, Hans CP, Agarwal G, 2020. Collagen fibril abnormalities in human and mice abdominal aortic aneurysm. Acta biomaterialia 110, 129–140. [DOI] [PMC free article] [PubMed] [Google Scholar]
- Kritharis EP, Iliopoulos DC, Papadodima SA, Sokolis DP, 2014. Effects of aneurysm on the mechanical properties and histologic structure of aortic sinuses. The Annals of thoracic surgery 98, 72–79. [DOI] [PubMed] [Google Scholar]
- Nissen AP, Ocasio L, Tjaden BL Jr., Sandhu HK, Riascos RF, Safi HJ, Estrera AL, Charlton-Ouw KM, 2019. Imaging characteristics of acute type A aortic dissection and candidacy for repair with ascending aortic endografts. J Vasc Surg 70, 1766–1775 e1761. [DOI] [PubMed] [Google Scholar]
- Okamoto RJ, Wagenseil JE, DeLong WR, Peterson SJ, Kouchoukos NT, Sundt TM, 2002. Mechanical properties of dilated human ascending aorta. Annals of Biomedical Engineering 30, 624–635. [DOI] [PubMed] [Google Scholar]
- Pape LA, Tsai TT, Isselbacher EM, Oh JK, O'Gara P,T, Evangelista A, Fattori R, Meinhardt G, Trimarchi S, Bossone E, Suzuki T, Cooper JV, Froehlich JB, Nienaber CA, Eagle KA, 2007. Aortic diameter >or = 5.5 cm is not a good predictor of type A aortic dissection: observations from the International Registry of Acute Aortic Dissection (IRAD). Circulation 116, 1120–1127. [DOI] [PubMed] [Google Scholar]
- Pasta S, Phillippi JA, Gleason TG, Vorp DA, 2012. Effect of aneurysm on the mechanical dissection properties of the human ascending thoracic aorta. J Thorac Cardiovasc Surg 143, 460–467. [DOI] [PMC free article] [PubMed] [Google Scholar]
- Ring WS, 2000. Congenital Heart Surgery Nomenclature and Database Project: aortic aneurysm, sinus of Valsalva aneurysm, and aortic dissection. The Annals of thoracic surgery 69, 147–163. [DOI] [PubMed] [Google Scholar]
- Sacks MS, Sun W, 2003. Multiaxial Mechanical Behavior of Biological Materials. Annual Review of Biomedical Engineering 5, 251–284. [DOI] [PubMed] [Google Scholar]
- Sokolis DP, Kritharis EP, Giagini AT, Lampropoulos KM, Papadodima SA, Iliopoulos DC, 2012. Biomechanical response of ascending thoracic aortic aneurysms: association with structural remodelling. Computer methods in biomechanics and biomedical engineering 15, 231–248. [DOI] [PubMed] [Google Scholar]
- Tsai TT, Trimarchi S, Nienaber C, 2009. Acute aortic dissection: perspectives from the International Registry of Acute Aortic Dissection (IRAD). European Journal of Vascular and Endovascular Surgery 37, 149–159. [DOI] [PubMed] [Google Scholar]
- Tsamis A, Phillippi JA, Koch RG, Pasta S, D'Amore A, Watkins SC, Wagner WR, Gleason TG, Vorp DA, 2013. Fiber micro-architecture in the longitudinal-radial and circumferential-radial planes of ascending thoracic aortic aneurysm media. J Biomech 46, 2787–2794. [DOI] [PMC free article] [PubMed] [Google Scholar]
- Venkatasubramanian RT, Grassl ED, Barocas VH, Lafontaine D, Bischof JC, 2006. Effects of freezing and cryopreservation on the mechanical properties of arteries. Ann Biomed Eng 34, 823–832. [DOI] [PubMed] [Google Scholar]
- Venkatasubramanian RT, Wolkers WF, Shenoi MM, Barocas VH, Lafontaine D, Soule CL, Iaizzo PA, Bischof JC, 2010. Freeze-thaw induced biomechanical changes in arteries: role of collagen matrix and smooth muscle cells. Ann Biomed Eng 38, 694–706. [DOI] [PubMed] [Google Scholar]
Associated Data
This section collects any data citations, data availability statements, or supplementary materials included in this article.