

SUMMARY
Amino acids are essential building blocks of life. However, increasing evidence suggests that elevated amino acids cause cellular toxicity associated with numerous metabolic disorders. How cells cope with elevated amino acids remains poorly understood. Here, we show that a previously identified cellular structure, the mitochondrial-derived compartment (MDC), functions to protect cells from amino acid stress. In response to amino acid elevation, MDCs are generated from mitochondria, where they selectively sequester and deplete SLC25A nutrient carriers and their associated import receptor Tom70 from the organelle. Generation of MDCs promotes amino acid catabolism, and their formation occurs simultaneously with transporter removal at the plasma membrane via the multi-vesicular body (MVB) pathway. Combined loss of vacuolar amino acid storage, MVBs and MDCs renders cells sensitive to high amino acid stress. Thus, we propose that MDCs operate as part of a coordinated cell network that facilitates amino acid homoeostasis through post-translational nutrient transporter remodeling.
Graphical Abstract
Mitochondrial-derived compartments (MDCs) are enigmatic mitochondrial subdomains that have been observed in aged yeast cells experiencing lysosome dysfunction. Schuler et al. now show that MDCs are generated in response to acute elevation in cellular amino acids and that these domains facilitate cellular adaptation to amino acid overabundance.
INTRODUCTION
Amino acids are essential metabolites utilized as fuels, signaling molecules, and precursors for the biosynthesis of proteins, lipids, heme, nucleotides, and other cellular molecules (Ljungdahl and Daignan-Fornier, 2012). Cells must maintain appropriate amino acid levels at all times and do so by monitoring cellular amino acid content and adjusting the rates of amino acid acquisition, storage, and utilization accordingly (Efeyan et al., 2015). We know much about the impact of amino acid starvation on cells, as well as the signaling pathways and remodeling systems that operate to maintain cellular health when amino acids are in short supply (Efeyan et al., 2015; Rabinowitz and White, 2010). On the other hand, elevated amino acids can lead to cellular toxicity and are associated with aging and numerous metabolic disorders, including insulin resistance and a host of inborn errors of amino acid metabolism (Aliu et al., 2018; Newgard et al., 2009; Ruiz et al., 2017; Soultoukis and Partridge, 2016). In contrast to our knowledge of cellular adaptation to amino acid starvation, we understand little about the mechanisms that drive amino acid toxicity and pathways that protect cells from amino acid overload (Wellen and Thompson, 2010).
We recently showed that the yeast vacuole, which is analogous to the mammalian lysosome, functions as a safeguard against cellular amino acid toxicity through its ability to import and sequester amino acids (Hughes and Gottschling, 2012; Hughes et al., 2020). Defects in vacuolar amino acid compartmentation impair mitochondrial respiration and negatively impact cellular health (Hughes and Gottschling, 2012; Hughes et al., 2020). In addition, prior work in yeast indicates that the regulation of nutrient transporters on the plasma membrane (PM) via the multi-vesicular body (MVB) pathway serves as a key mechanism to regulate cellular amino acid uptake (Katzmann et al., 2002; Risinger et al., 2006; Rubio-Texeira and Kaiser, 2006; Ruiz et al., 2017). However, it remains unclear if cells utilize additional mechanisms beyond these systems to prevent amino acid overload.
While investigating functional links between vacuoles and mitochondria, we identified a new cellular structure, the mitochondrial-derived compartment (MDC), that forms from mitochondria when vacuolar acidification is impaired (Hughes et al., 2016). Upon formation, MDCs selectively incorporate a number of mitochondrial proteins including Tom70, an outer membrane (OM) import receptor for mitochondrial nutrient transporters (Sollner et al., 1990). By contrast, MDCs exclude most other mitochondrial proteins, including those in the mitochondrial matrix, the intermembrane space, and the majority of inner membrane (IM) proteins (Hughes et al., 2016). After formation, MDCs can be released from mitochondria via mitochondrial fission and are degraded by autophagy (Hughes et al., 2016). However, we understand little about the dynamics and regulation of MDC formation, as well as the function of this cellular compartment.
Here, we investigated the function and regulation of MDCs, and find that these structures are dynamic mitochondrial subdomains that are generated in response to intracellular amino acid elevation. We show that upon formation, MDCs sequester SLC25A metabolite carriers and their associated import receptor Tom70 from mitochondria while leaving the remainder of the organelle intact. Finally, we provide evidence that MDCs operate as part of a coordinated cellular network that modulates cellular metabolism under conditions of amino acid excess.
RESULTS
MDCs Are Dynamic Structures Capable of Stable Association with Mitochondria
We previously identified MDCs in budding yeast, S. cerevisiae, as foci that form from mitochondria during aging or in response to acute pharmacological disruption of vacuolar acidification with concanamycin A (ConcA), an inhibitor of the evolutionarily conserved vacuolar H+-ATPase (V-ATPase) proton pump (Hughes et al., 2016). ConcA treatment triggered formation of foci containing GFP-tagged Tom70 (Figure 1A), a mitochondrial import receptor of the translocase of the outer membrane (TOM) complex (Sollner et al., 1990; Steger et al., 1990). Line-scan analysis demonstrated that MDCs exhibited enrichment of Tom70 compared to the rest of the mitochondria and excluded the IM protein Tim50-mCherry (Yamamoto et al., 2002), a subunit of the pre-sequence translocase of the inner membrane (TIM23) complex, that we previously showed is absent from MDCs (Figure 1A). We further validated our results by showing that acute, genetic disruption of V-ATPase function induced MDC formation (Supplemental Figure S1A-D). Genetic impairment of the V-ATPase was achieved by fusing its subunit Vma2 to an inducible degron (AID*) which targets the tagged protein for proteasomal degradation upon addition of the plant hormone auxin (Morawska and Ulrich, 2013). Auxin-induced depletion of Vma2 impaired vacuolar acidification within one hour and subsequently induced MDC formation (Supplemental Figure S1A-D). We also confirmed that endogenous, untagged Tom70 localized to MDCs (Supplemental Figure S1E), suggesting MDCs are not caused by GFP-tagging.
Figure 1. MDCs are Dynamic, Mitochondria-Associated Structures that Form in Response to V-ATPase Inhibition.

(A) Widefield images and line-scan analysis of ConcA-induced MDC formation in yeast cells expressing Tom70-GFP and Tim50-mCherry.
(B) Super-resolution images and line-scan analysis of ConcA-induced MDC formation in yeast cells expressing Tom70-GFP and Tim50-mCherry. Left and right line-scan Y axis indicate Tom70-GFP and Tim50-mCherry fluorescence intensities, respectively.
(C) Super-resolution image of ConcA treated yeast cells expressing Oac1-GFP and Tom70-mCherry.
(D) Super-resolution image of ConcA treated yeast cells expressing Ilv2-GFP and Tom70-mCherry.
(E) Super-resolution images of ConcA treated yeast cells expressing Tom70-GFP, stained with DAPI to label mitochondrial DNA. 0 ± 0% of MDCs stained with DAPI. N = 3 replicates with n = 50 MDCs per replicate.
(F) Super-resolution images of ConcA treated yeast cells expressing Tom70-GFP stained with the ΔΨ indicator TMRM. 0 ± 0% of MDCs stained with TMRM. N = 3 replicates with n = 30 MDCs per replicate.
(G) Time-lapse images of ConcA-induced MDC formation in yeast cells expressing Tom70-GFP. Images were acquired over 120 min. Arrowhead marks MDC. Bar = 2 μm.
(A-F) White arrow marks MDC. White line marks fluorescence intensity profile position. Black arrow marks mitochondrial tubule. Bracket marks MDC. Bar = 2 μm.
Utilizing super-resolution microscopy, we found that MDCs are mitochondrial-associated structures that appear to contain distinct lumens and reach diameters approaching one micrometer (Figure 1B). As shown previously (Hughes et al., 2016), these Tom70-enriched domains selectively incorporated the mitochondrial IM localized oxaloacetate carrier Oac1 (Figure 1C and Supplemental Figure S1F) but excluded the IM protein Tim50 and the matrix-localized acetolactate synthase Ilv2 (Figure 1B+D). Moreover, MDCs did not stain with the mitochondrial DNA (mtDNA) probe DAPI (Figure 1E) or the mitochondrial IM potential (ΔΨ)-dependent dye TMRM (Figure 1F).
To elucidate the kinetics and dynamics of MDC formation, we utilized super-resolution time-lapse imaging to visualize MDC formation over a two-hour time period (Movie S1). As shown in Figure 1G, MDCs first appeared as small foci with an enrichment of Tom70-GFP compared to the rest of the tubule, usually within 20-30 minutes of ConcA addition (Figure 1G, 26- and 29-minute panels). MDCs remained stably associated with the mitochondrial tubule and grew in size over the two-hour time-course with lumens becoming visible at late stages of formation (Figure 1G, Supplemental Figure S1G, and Movies S1-2). During and after formation, MDCs exhibited dynamic properties including frequent elongation and tubulation (Figure 1G, Supplemental Figure S1G, and Movies S1-2). Tubulation often preceded the appearance of a clear lumen, suggesting this may be a general feature of MDC formation (Figure 1G, Supplemental Figure S1G and Movies S1-2). Two hours after MDC induction, 60% of all cells had formed at least one MDC (Supplemental Figure S1H). Similar, but slightly delayed kinetics and reduced frequencies were observed for MDCs that formed in response to auxin-induced depletion of Vma2 (Supplemental Figure S1C). Altogether, MDCs are dynamic, sub-organellar domains with a distinct proteome that lack mtDNA and ΔΨ, form in direct response to loss of V-ATPase function and are capable of long-term mitochondrial association.
MDC Formation Coincides with Perturbations in Amino Acid Homeostasis Stemming from Vacuole Impairment
To determine the function of MDCs, we sought to identify the signal originating from dysfunctional vacuoles that activates MDC formation. Recently, we demonstrated that the yeast vacuole is linked to mitochondrial function through its role in spatially compartmentalizing amino acids (Hughes and Gottschling, 2012; Hughes et al., 2020). Specifically, we showed that acute V-ATPase inhibition induces global cellular rewiring at the mRNA level, with decreased expression of proteins involved in the amino acid biosynthesis and upregulation of pathways that promote amino acid catabolism (Hughes et al., 2020). Consistently, we found that the total cellular abundance of several amino acids declined upon inhibition of vacuole function, whereas the levels of proline, glutamate and pyroglutamate, a proxy for glutamine, increased or remained constant upon ConcA treatment (Figure 2A). By contrast, cellular nucleotide and fatty acid metabolite steady states were largely unperturbed in V-ATPase-inhibited cells (Supplemental Figure S2A).
Figure 2. V-ATPase Inhibition Activates Cellular Re-Modeling of Amino Acid and Glucose Metabolism.
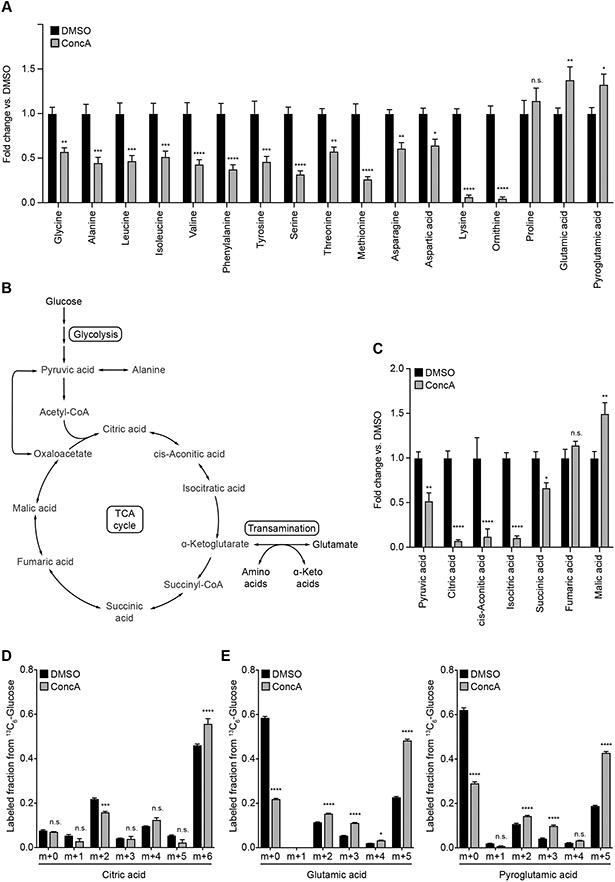
(A) Analysis of whole cell amino acid (AA) levels in yeast cells treated with ConcA for three hours.
(B) Diagram of cellular glucose, TCA cycle, and AA metabolism.
(C) Analysis of TCA cycle metabolite levels in yeast cells treated with ConcA for three hours.
(D-E) Analysis of 13C-labeling of citrate (D) or glutamate and pyroglutamate (E) from glucose carbons in yeast cells treated for three hours with ConcA in the presence of 13C6-glucose. Error bars show mean labeled fraction ± SE of N = four replicates. Statistical comparison shows difference to the corresponding DMSO control. n.s., not significant, *p < 0.0333, ***p < 0.0002, ****p < 0.0001, two-way ANOVA with Holm-Šídák test.
(A, C) Error bars show mean ± SE of N = four replicates. Statistical comparison shows difference to the corresponding DMSO control. n.s., not significant, *p < 0.0333, **p < 0.0022, ***p < 0.0002, ****p < 0.0001, two-way ANOVA with Holm-Šídák test.
Glutamate is a byproduct of amino acid catabolism by transamination, the first step in the degradation of the BCAAs leucine, isoleucine, and valine, as well as several other amino acids (Figure 2B) (Hazelwood et al., 2008). Since this reaction consumes the tricarboxylic acid (TCA) cycle intermediate α-ketoglutarate (αKG) (Figure 2B), we analyzed whether V-ATPase inhibition affects the steady state abundance of TCA cycle metabolites. While we were unable to reliably measure αKG levels by GC-MS, analysis of the TCA cycle revealed that metabolites directly upstream and downstream of αKG were depleted with ConcA treatment (Figure 2C). By contrast, fumarate and malate pools, which can be replenished by carboxylation of pyruvate or via the malate-aspartate shuttle, remained unchanged or were moderately increased (Figure 2C). To determine if these changes arose from increased consumption or decreased production of TCA cycle intermediates, we assessed the cellular glucose utilization upon V-ATPase impairment. Tracing of 13C6-labeled glucose revealed that V-ATPase inhibition moderately increased the incorporation of glucose carbons into the TCA cycle intermediates citrate, succinate, and fumarate, as well as the glycolytic intermediate pyruvate (Figure 2D and Supplemental Figure S2B), whereas ConcA treatment strongly increased the labeling of glutamate and glutamine from glucose (Figure 2E). Thus, the ConcA-induced depletion of early TCA cycle intermediates is likely not caused by a decline in TCA cycle activity, but instead linked to an increased out flow of these metabolites towards the production of glutamate from αKG (Figure 2B). Interestingly, we also observed increased isotope labeling of alanine, aspartate, and ornithine, metabolites that are directly related to the TCA cycle or glutamate (Supplemental Figure S2C). By contrast, isotope incorporation into other glucose-derived amino acids, such as serine, threonine, and valine, was largely unchanged in V-ATPase impaired cells (Supplemental Figure S2D). These results suggest that loss of vacuolar acidification activates cellular metabolic programs that promote the conversion of non-preferred amino acids into glutamate and glutamine, a reaction that consumes the TCA cycle intermediate αKG.
MDCs Are Responsive to the Cellular Amino Acid Content
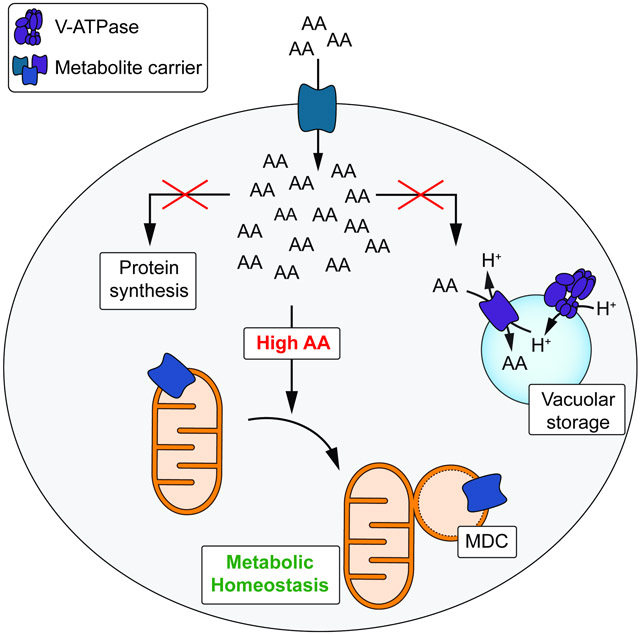
The observed metabolic and transcriptional changes that occur in V-ATPase-impaired cells are consistent with our previously published model that loss of vacuolar acidification leads to acute cytoplasmic amino acid surplus (Hughes et al., 2020) and subsequent activation of cellular programs that antagonize excess amino acids. Because MDCs form within minutes after inhibition of V-ATPase function (Figure 1G), we hypothesized that acute cytoplasmic amino acid surplus may activate MDC biogenesis (Figure 3A). Consistent with a role for amino acids in triggering MDC formation, inhibition of V-ATPase function with ConcA activated MDC biogenesis when cells were cultured in medium containing high levels of amino acids (High AA), but not in synthetic medium containing low levels of amino acids (Low AA), or in minimal medium completely lacking all amino acids (No AA) (Figure 3B). Steady-state amino acid analysis confirmed that cells grown under the latter two conditions contained lower intracellular amino acid pools when compared to cells grown in rich medium (Supplemental Figure S3A). Supplementation of cells with amino acids in the form of hydrolyzed casein (Cas AA) restored MDC formation in medium containing low or no amino acids (Figure 3B). Thus, MDC formation upon vacuole inhibition is responsive to the intracellular amino acid content, with high amino acids promoting MDC formation and low amino acids preventing activation of MDCs.
Figure 3. Elevated Cellular Amino Acids Activate MDC Formation.

(A) Model of intracellular AA homeostasis. AAs are metabolized, utilized for protein biosynthesis or stored in the yeast vacuole. Defects in these processes cause AA buildup in the cytoplasm.
(B) Quantification of ConcA-induced MDC formation in media containing high, low or no AAs. Cas AA indicates where bulk AAs were added back in the form of hydrolyzed casein.
(C) Super-resolution images and line-scan analysis of CHX-induced MDC formation in yeast cells expressing Tom70-GFP and Tim50-mCherry. Left and right Y line-scan axis correspond to Tom70-GFP and Tim50-mCherry fluorescence intensities, respectively.
(D) Quantification of CHX-induced MDC formation in media containing high, low or no AAs. Cas AA indicates where bulk AAs were added back in the form of hydrolyzed casein.
(E) Super-resolution images and line-scan analysis of Rap-induced MDC formation in yeast cells expressing Tom70-GFP and Tim50-mCherry. For DMSO, left and right line-scan Y axis correspond to Tom70-GFP and Tim50-mCherry fluorescence intensities, respectively.
(F) Quantification of Rap-induced MDC formation in media containing high, low or no AAs. Cas AA indicates where bulk AAs were added back in the form of hydrolyzed casein.
(G) Quantification of MDC formation in yeast cells treated with ConcA, oligomycin (Oligo), antimycin A (AntA), FCCP, CoCl2, tunicamycin (Tunica) or H2O2.
(H) Quantification of MDC formation in yeast cells treated with ConcA or the iron chelator BPS in presence or absence of exogenous iron.
(B, D, F-H) Error bars show mean ± SE of N = three replicates with n = 100 cells per replicate.
(C, E) White arrow marks MDC. White line marks fluorescence intensity profile position. Black arrow marks mitochondrial tubule. Bracket marks MDC. Bar = 2 μm.
To further test the idea that MDCs are formed in response to cytoplasmic amino acid surplus, we created acute intracellular amino acid surplus by two alternative mechanisms. First, we treated cells with cycloheximide (CHX), which blocks incorporation of free amino acids into proteins (Beugnet et al., 2003) (Figure 3A). Like ConcA, CHX also activated formation of large Tom70-enriched domains that were cargo selective, approached sizes close to one micrometer in diameter (Figures 3C and Supplemental Figure S3B-C), and lacked mtDNA and ΔΨ (Supplemental Figure S3D-E). Additionally, CHX-induced MDCs displayed formation kinetics similar to ConcA-induced MDCs, albeit in a higher percentage of cells (Supplemental Figure S3F and Movie S3). Depletion of amino acids prevented CHX-induced MDC formation, and supplementation with Cas AA restored MDCs, indicating that MDC induction by CHX is amino acid-dependent and not simply due to inhibition of protein synthesis (Figure 3D).
Second, we tested if activation of cellular programs that promote amino acid acquisition induce MDC formation in nutrient-replete conditions. In yeast, inhibition of the mechanistic Target of Rapamycin (mTOR) kinase (Saxton and Sabatini, 2017), which occurs naturally during amino acid starvation, enhances nutrient availability by blocking protein translation (Barbet et al., 1996), stimulating expression of the general amino acid permease Gap1 (Cardenas et al., 1999), and activating autophagy (Noda and Ohsumi, 1998). Therefore, acute inhibition of mTOR signaling in nutrient-replete conditions creates intracellular amino acid overload (Supplemental Figure S3G) as previously reported (Chen and Kaiser, 2003). Interestingly, tracing of glucose carbons in cells treated with the mTOR inhibitor rapamycin (Rap) revealed that these excess amino acids were converted into glutamate and glutamine (Supplemental Figure S3H), indicating the activation of similar metabolic programs in V-ATPase-impaired and mTOR-inhibited cells. Consistent with a model in which acute amino acid surplus activates MDC formation, treatment of cells with Rap caused formation of cargo-selective, Tom70-enriched domains on mitochondria with characteristics identical to ConcA- and CHX-induced MDCs (Figure 3E, Supplemental Figure S3I-M, and Movie S4). As with ConcA and CHX, Rap-induced MDC formation was reduced in low amino acid medium, blocked in amino acid-free medium, and restored upon re-addition of Cas AA (Figure 3F).
In recent studies, we and others demonstrated that defects in vacuolar amino acid storage cause mitochondrial depolarization by altering the bioavailability of intracellular iron through an oxidant-based mechanism (Chen et al., 2020; Dimmer et al., 2002; Hughes and Gottschling, 2012; Hughes et al., 2020; Merz and Westermann, 2009; Ohya et al., 1991; Weber et al., 2020; Yambire et al., 2019). We thus considered the possibility that mitochondrial depolarization, oxidative stress, or iron deprivation may activate MDC formation downstream of elevated amino acids. Treatment of cells with the mitochondrial ATP synthase inhibitor oligomycin, the mitochondrial respiratory chain poison antimycin A, or the depolarizing agent FCCP did not induce MDC formation (Figure 3G). Likewise, other cellular stressors including the hypoxia mimetic CoCl2, the endoplasmic reticulum (ER) stress inducer tunicamycin, or the oxidant hydrogen peroxide did not activate MDCs (Figure 3G). MDC formation was also not linked to defects in the cellular iron homeostasis that occur in V-ATPase impaired cells (Chen et al., 2020; Hughes et al., 2020), as treatment of cells with the iron chelator BPS did not activate MDC biogenesis. Moreover, iron addition to ConcA-treated cells, which is sufficient to restore mitochondrial respiration in absence of a functioning vacuole (Chen et al., 2020; Hughes et al., 2020), did not inhibit MDC formation (Figure 3H). Together, these results suggest that MDCs are formed in response to acute elevation of intracellular amino acids, whereas they are unresponsive to many other cellular stresses.
BCAAs and Their Catabolites Activate MDC Formation
Because MDCs responded to excess amino acids, we sought to identify specific amino acids that activate MDC formation. Addition of single amino acids to low amino acid medium restored MDC formation in the presence of ConcA to different extents (Figure 4A). Leucine was the most potent activator of MDC formation, followed by methionine and isoleucine, while several other amino acids, including arginine and proline, did not induce MDCs (Figure 4A). In yeast, the most potent MDC activators, including the BCAAs leucine and isoleucine as well as methionine, are all metabolized via the Ehrlich pathway, which converts amino acids to their corresponding α-keto acid via transamination, followed by decarboxylation to an aldehyde and oxidation to an alcohol (Figure 4B) (Hazelwood et al., 2008). Notably, expression of Ehrlich pathway enzymes is increased in V-ATPase-impaired cells (Hughes et al., 2020), and analysis of cellular amino acid levels indicated an increased conversion of amino acids to glutamate (Figure 3), the first step in the Ehrlich pathway (Figure 4B). We thus tested whether downstream metabolic products of leucine catabolism activated MDC formation. To this end, we compared MDC induction by leucine to its catabolites ketoisocaproic acid (KIC), isovaleraldehye (IVA), and isoamylalcohol (IAA) (Figure 4C). Addition of KIC and IVA to low amino acid medium restored MDC formation in the presence of ConcA to the same extent or even more robustly than leucine, while IAA had no effect (Figure 4C). Remarkably, IVA alone, without impairment of V-ATPase function or inhibition of protein synthesis, potently activated MDC formation (Figure 4D-E). Like ConcA, CHX, and Rap, IVA-activated MDCs were cargo selective, reached sizes of nearly one micrometer, and lacked mtDNA and ΔΨ (Figures 4E and Supplemental Figure S4A-E). Similar results were obtained with the aldehyde derivative of methionine, which stimulated MDC formation both in the presence and absence of vacuole impairment (Supplemental Figure S4F-M).
Figure 4. Branched-Chain Amino Acids and Their Derivatives Activate MDC Formation.

(A) Quantification of ConcA-induced MDC formation in high or low AA medium supplemented with the indicated AA.
(B) Diagram of BCAA catabolism via the Ehrlich Pathway.
(C) Quantification of ConcA-induced MDC formation in low AA medium supplemented with leucine (Leu), ketoisocaproic acid (KIC), isovaleraldehyde (IVA) or isoamylalcohol (IAA).
(D) Quantification of MDC formation in high AA medium supplemented with Leu, KIC, IVA or IAA in the absence of drug treatment.
(E) Super-resolution images of IVA-induced MDC formation in yeast cells expressing Tom70-GFP and Tim50-mCherry. White arrow marks MDC. Bar = 2 μm.
(F) Quantification of ConcA-, CHX-, and Rap-induced MDC formation in wild-type, bat1Δ, bat2Δ, and bat1Δbat2Δ cells.
(G) Quantification of ConcA-induced MDC formation in wild-type and bat1Δbat2Δ cells grown in high AA media or low AA media supplemented with leucine, KIC or IVA.
(H) Quantification of IVA-induced MDC formation in wild-type and bat1Δbat2Δ cells grown in high AA media.
(A, C, D, F-H) Error bars show mean ± SE of N = three replicates with n = 100 cells per replicate.
MDCs form under conditions that promote amino acid degradation, and amino acids and their derivatives are potent activators of MDCs, raising the possibility that amino acid catabolism is a major driver of MDC biogenesis in yeast. Consistent with this model, simultaneous deletion of the BCAA transaminases BAT1 and BAT2, which mediate the first step in BCAA catabolism via the Ehrlich pathway (Hazelwood et al., 2008), impaired MDC formation in rich medium (Figure 4F), as well as leucine-induced MDC formation in low AA media (Figure 4G). However, re-addition of the leucine-derived metabolites KIC or IVA did not restore MDC formation in bat1Δbat2Δ cells to wild-type levels (Figure 4G), suggesting that BCAA transaminases may play additional roles in the MDC pathway. As Bat1 and Bat2 also mediate the last step in BCAA biosynthesis (Kohlhaw, 2003), we considered that a decrease in cellular BCAA steady-state abundance may explain these unexpected results. However, deletion of ILV2, a key enzyme in BCAA biosynthesis (Kohlhaw, 2003) did not impair MDC formation in complete medium (Supplemental Figure S4N). Thus, single amino acids and their catabolites promote MDC formation and amino acid transamination plays an important role in activating the MDC pathway. However, as loss of BAT1 and BAT2 cannot be bypassed by re-addition of leucine-derived catabolites, the mechanisms by which amino acids, keto acids, and aldehydes activate MDCs remain unclear. Interestingly, we found that deletion of GCN2, GLN3, GPA2, GPR1, and SSY1, which dismantle a variety of nutrient signaling systems in yeast (Donaton et al., 2003; Hinnebusch, 2005; Ljungdahl, 2009), had no impact on MDC formation in response to various MDC inducers (Supplemental Figure S4O). Together, our data indicate that a broad range of amino acids and their related metabolites activate MDCs and that this occurs independently of known nutrient sensing systems.
MDCs Regulate Mitochondrial Levels of SLC25A Carriers and Tom70
Through microscopy-based screening, we previously found that the cargo localized to MDCs included Tom70, a mitochondrial OM receptor required for import of the SLC25A nutrient transporters into mitochondria (Hines et al., 1990; Ryan et al., 1999; Sollner et al., 1990; Steger et al., 1990; Young et al., 2003), members of the IM-localized SLC25A family themselves, as well as a few other OM proteins that are known to be Tom70 clients (Hughes et al., 2016). The conserved SLC25A protein family consists of over 30 members in yeast and is responsible for the exchange of most metabolites across the mitochondrial IM (Palmieri and Monne, 2016). Interestingly, many mitochondrial carriers function in amino acid biosynthetic pathways (Monne et al., 2019), and their expression decreases upon V-ATPase inhibition (Hughes et al., 2020). Because MDCs respond to elevated cellular amino acids, we wondered whether these structures could acutely modulate the levels of SLC25A carriers on mitochondria. Consistent with this idea, we found that the carrier receptor Tom70, the mitochondrial oxaloacetate carrier Oac1, the oxo-dicarboxylate carrier Odc1, the manganese trafficking factor Mtm1, and the yeast mitochondrial carrier for glutamate biosynthesis Ymc2, were three-to-six-fold enriched in MDCs compared to the mitochondrial tubule (Figure 5A-D). Moreover, Rap-induced MDC formation led to a ~50% reduction in the abundance of MDC substrates in the mitochondrial network (Figure 5E-F), and similar decreases for Tom70 and Oac1 were observed across all known MDC inducers (Supplemental Figure S5A-B). By contrast, Tom20, an OM import receptor required for mitochondrial targeting of proteins with a canonical mitochondrial targeting sequence (Abe et al., 2000; Moczko et al., 1994; Moczko et al., 1993), was not enriched in MDCs when compared to the mitochondrial tubule (Supplemental Figure S5C-D) and not depleted from the mitochondrial network under MDC inducing conditions (Supplemental Figure S5E). Similarly, mitochondrial levels of Tim50 and Ilv2, IM and matrix proteins that do not associate with MDCs, did not decline upon treatment with MDC inducers (Supplemental Figure S5F-G). We recently showed that MDCs form at sites of contact between mitochondria and the ER and that their formation requires the conserved mitochondrial GTPase Gem1 (English et al., 2020). Importantly, ablation of MDC formation by deleting GEM1 prevented depletion of Tom70 and SLC25A carriers from the mitochondrial network in response to MDC activating treatments (Figure 5E-F and Supplemental Figure S5A-B).
Figure 5. MDCs Selectively Sequester Carriers of the SLC25A Family and Their Import Receptor Tom70 From Mitochondria.

(A) Super-resolution images and line-scan analysis of Rap-induced MDC formation in yeast cells expressing Tom70-GFP. Right image (Tom70*) shows where the fluorescence intensity has been increased post imaging to visualize the mitochondrial tubule.
(B) Box plot showing the normalized fluorescence intensity of GFP-tagged Tom70 in Rap-induced MDCs compared to the adjacent mitochondrial tubule.
(C) Super-resolution images and line-scan analysis of Rap-induced MDC formation in yeast cells expressing Tom70-mCherry and the indicated GFP-tagged SLC25A carrier.
(D) Box plots showing the normalized fluorescence intensity of the indicated GFP-tagged protein in Rap-induced MDCs compared to the adjacent mitochondrial tubule.
(E-F) Normalized mitochondrial fluorescence of the indicated GFP-tagged protein in wild-type (WT) and gem1Δ cells treated with Rap compared to DMSO.
(G) Quantification of ConcA-induced MDC formation in TOM70 overexpressing or empty vector (EV) control cells in high and low AA media.
(H) Quantification of ConcA, CHX, Rap, IVA and MTPA-induced MDC formation in WT, tom70Δ and tom70Δtom71Δ cells.
(I-J) Quantification of MDC formation in cells expressing the indicated SLC25A carrier in high AA media in absence of drug treatment (I) or low AA media in presence of ConcA (J).
(A, C) White arrow marks MDC. White line marks fluorescence intensity profile position. Black arrow marks mitochondrial tubule. Bracket marks MDC. Bar = 2 μm.
(B, D) Error bars show median ± 95 % CI of n = 45 cells from N = three per replicates with n = 15 cells per replicate.
(E-F) Error bars show mean ± SE of N = three replicates with n = 15 cells per replicate.
(G-J) Error bars show mean ± SE of N = three replicates with n = 100 cells per replicate.
To confirm these results, we analyzed steady-state protein levels of putative MDC cargo and non-cargo in mitochondria isolated from wild-type and gem1Δ cells treated with a combination of the MDC inducers ConcA and Rap, both treatments that route MDCs to the vacuole (Hughes et al., 2016) and therefore allow partial biochemical separation of mitochondria from vacuole-localized MDCs. While global changes in carrier expression levels (Supplemental Figure S5H) (Hughes et al., 2020) prevented us from analyzing the acute effects of MDC formation on the mitochondrial SLC25A content, we found that MDC formation caused a decline in mitochondrial Tom70 abundance (Supplemental Figure S5I). By contrast, levels of Tom20 and its IM and matrix clients Tim50 and Ssc1 remained constant (Supplemental Figure S5I). Consistent with these results, MDC-dependent depletion of Tom70 from the mitochondrial surface impaired in vitro binding of the DHFR-fused carrier protein Aac2 to the TOM complex (Supplemental Figure S5J). Together, our data indicate that MDCs specifically target Tom70 and its carrier clients in response to elevated amino acids.
Given that MDCs sequester machinery and clients of the carrier import pathway in response to elevated amino acids (Hughes et al., 2016), we reasoned that MDC formation may provide cells with a mechanism to coordinate mitochondrial SLC25A levels with the cellular amino acid content. A prediction of this model is that MDC formation should be sensitive to modulation of SLC25A levels on mitochondria. Indeed, overexpression of TOM70, which provides more binding sites for carriers on the mitochondrial surface, caused constitutive MDC formation in cells grown in rich medium and stimulated MDC formation in ConcA-treated cells grown in low amino acid medium where MDC formation is normally not apparent (Figure 5G). Moreover, deletion of TOM70 alone or in combination with its paralog TOM71 (Schlossmann et al., 1996), which prevents localization of chaperone-bound carriers to mitochondria (Ryan et al., 1999; Young et al., 2003), severely reduced MDC formation in response to all known MDC inducers (Figure 5H). By contrast, MDC formation was largely unaffected in cells overexpressing or deficient for TOM20 (Supplemental Figure S5K-L).
To more directly analyze the impact of carrier abundance on the MDC pathway, we overexpressed 28 individual members of the SLC25A family in wild-type cells (Table S1) and screened for carriers that impacted the magnitude of MDC formation (Supplemental Figure S5M-N). We identified numerous SLC25A carriers that constitutively activated MDC formation when overexpressed in cells grown in rich medium and stimulated MDC formation in ConcA-treated cells grown in low amino acid medium (Figure 5I-J and Supplemental Figure S5M-N). Importantly, deletion of Tom70 blocked MDC induction in response to carrier overexpression (Supplemental Figure S5O), indicating that mitochondrial localization of SLC25A proteins is required for activation of MDCs. Interestingly, the top MDC-inducing carriers (Figure 5I-J) are all MDC substrates (Figure 5C), and many of these carrier proteins play critical roles in amino acid biosynthetic pathways (Monne et al., 2019). By contrast, overexpression of the IM protein Tim50, which does not localize to MDCs, did not activate MDCs (Supplemental Figure S5P). Collectively, these results support a model in which MDCs function to acutely sequester Tom70 and SLC25A carriers away from the mitochondrial network during amino acid elevation stress.
MDCs Promote Metabolic Adaptation to Amino Acid Excess
Mitochondrial SLC25A carriers are central nodes in cellular metabolism as they mediate the transport of numerous metabolites across the IM (Palmieri and Monne, 2016). Since MDCs sequester carriers away from the mitochondrial network, we wondered if MDC formation contributes to the metabolic adaptations that occur in response to acute inhibition of vacuole function (Figure 3 and Supplemental Figure S3). To test this idea, we analyzed whole cell metabolite levels in ConcA-treated wild-type and gem1Δ cells, the latter of which do not form MDCs (English et al., 2020). In wild-type cells, acute inhibition of vacuolar acidification caused a decline in cellular amino acid pools (Figure 6A), an increase in cellular glutamate and glutamine levels (Figure 6A), and depletion of TCA cycle intermediates directly upstream or downstream of αKG (Figure 6B). By contrast, gem1Δ cells deficient for MDC formation maintained their cellular amino acid content and TCA cycle metabolite pools upon treatment with ConcA (Figure 6A-B). Under steady state conditions, cells lacking GEM1 displayed lower levels of the MDC inducing amino acids leucine, isoleucine, and valine, as well as reduced glycine and threonine levels, suggesting that these mutants may activate mechanisms that compensate for the loss of MDC formation (Figure 6A). The levels of several other cellular metabolites were comparable between wild-type and GEM1-deficient cells and remained mostly stable upon V-ATPase inhibition, suggesting the metabolic differences in gem1Δ cells are likely not attributable to alterations in mitochondrial function (Supplemental Figure S6A).
Figure 6. MDC Formation Promotes Cellular Metabolic Remodeling in Response to V-ATPase Inhibition.
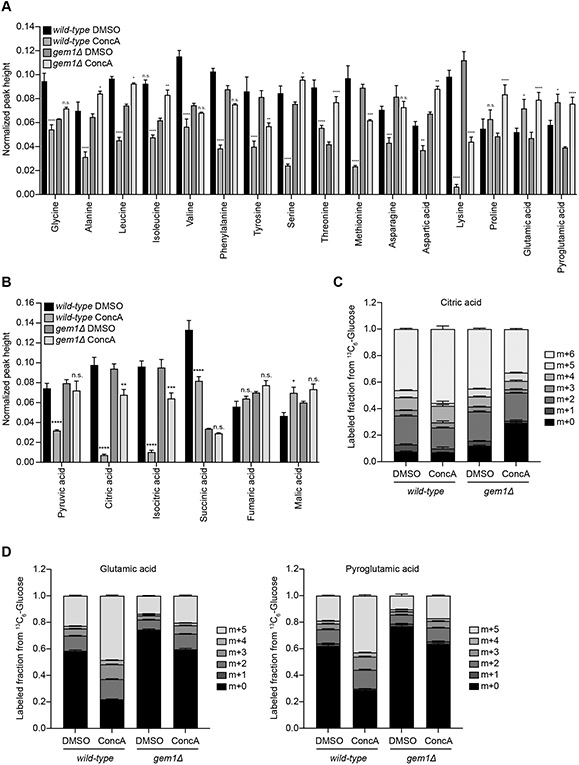
(A-B) Normalized whole cell AA levels (A) and TCA metabolite abundance (B) in wild-type (WT) and gem1Δ cells treated with ConcA for three hours. These graphs show additional data generated in the experiments used for Figures 2A and 2C. WT control graphs were normalized to the sum of all corresponding metabolite intensity levels (peak heights) to allow for better comparison to gem1Δ cells. Error bars show mean ± SE of N = four replicates. Statistical comparison shows difference to the corresponding DMSO control. n.s., not significant, *p < 0.0333, **p < 0.0022, ***p < 0.0002, ****p < 0.0001, two-way ANOVA with Holm-Šídák test.
(C-D) Analysis of 13C-labeling of citrate (C) or glutamate and pyroglutamate (D) from glucose carbons in wild-type and gem1Δ cells treated for three hours with ConcA in the presence of 13C6-glucose. These graph shows additional data generated in the experiments used for Figures 2D and 2E. WT control graphs were duplicated for comparison. Error bars show mean fraction labeled ± SE of N = four replicates.
Next, we compared the incorporation of 13C6-labeled glucose into the TCA cycle and related metabolites in wild-type and gem1Δ cells. While the flux of glucose carbons into the TCA cycle (Figure 6C and Supplemental Figure S6B) and towards production of glutamate and glutamine increased upon treatment of wild-type cells with ConcA (Figure 6D), deletion of GEM1 almost completely blocked this change in cellular glucose utilization (Figure 6C-D and Supplemental Figure S6B). This effect cannot be explained by defects in glucose uptake or conversion via glycolysis as labeling of pyruvate from glucose was comparable in both strains (Supplemental Figure S6C). Notably, upon ConcA treatment wild-type and gem1Δ cells both showed increased labeling of alanine, aspartate, and ornithine from glucose, suggesting that changes in glucose flux towards these amino acids occurs independently of MDC formation (Supplemental Figure S6D). Lastly, labeling of the glucose-derived amino acids serine, threonine, and valine remained unchanged in ConcA-treated wild-type and gem1Δ cells (Supplemental Figure S6E). Thus, formation of MDCs in response to defects in vacuolar amino acid storage alters the metabolic fate of glucose carbons and promotes adaptation of the cellular amino acid content.
MDCs Act in Parallel with the Vacuole and the MVB Pathway to Promote Survival in the Presence of High Amino Acids
Finally, we sought to determine whether MDCs play a role in regulating cellular health under conditions of elevated amino acids. Since gem1Δ cells fail to adjust their metabolic program and amino acid content in response to V-ATPase inhibition, we tested whether deletion of GEM1 impacted cell growth in the presence of excess amino acids. Serial-dilution growth assays demonstrated mild to no growth defects in gem1Δ strains when grown in the presence of ConcA combined with leucine or methionine addition, conditions that activate the MDC pathway (Supplemental Figure S7A). Since gem1Δ strains did not exhibit robust growth phenotypes under MDC inducing conditions, we considered the existence of redundant pathways that protect cells from amino acid stress in the absence of MDCs. A strong candidate for such a system is the endosomal sorting complexes required for transport (ESCRT)-dependent MVB pathway. This pathway post-translationally regulates levels of nutrient transporters at the PM via ubiquitin-mediated internalization and destruction in the vacuole, and mutants in this system exhibit elevated amino acid uptake from the environment (Katzmann et al., 2002; Rubio-Texeira and Kaiser, 2006).
Prior studies showed that the ESCRT/MVB system downregulates PM transporters in response to the inhibition of protein translation or mTOR signaling, two conditions that also activate MDCs (Hatakeyama and De Virgilio, 2019; Lin et al., 2008; Nikko and Pelham, 2009). We confirmed these results utilizing the PM-localized BCAA permease Bap2, a transporter for leucine, isoleucine, and valine, as a model substrate (Grauslund et al., 1995). Treatment of cells expressing GFP-tagged Bap2 with Rap or CHX triggered removal of Bap2-GFP from the PM and a corresponding increase in Bap2-GFP processing in the vacuole as observed by the accumulation of free GFP (Figure 7A-B). The proteolytic cleavage of Bap2-GFP was dependent on the vacuolar aspartyl protease (PEP4) (Figure 7B), a vacuolar master protease required for the post-translational precursor maturation of vacuolar proteases (Ammerer et al., 1986). Remarkably, internalization and PEP4-dependent processing of Bap2-GFP also occurred in other conditions that activate MDCs, including treatment with ConcA, IVA or MTPA (Figure 7A-B). Consistent with previous reports, Bap2 internalization and degradation was prevented in cells lacking components of the ESCRT machinery required for MVB-dependent degradation of PM localized nutrient transporters (Hurley and Emr, 2006), including the vacuolar protein sorting factor 27 (VPS27), an ESCRT-0 protein, and the Doa4-independent degradation protein (DID4), an ESCRT-III factor (Figure 7C-D and Supplemental Figure7B-C). Thus, under conditions of amino acid excess, cells simultaneously activate MDC-dependent removal of SLC25A carriers from mitochondria and reduce levels of PM nutrient transporters via the ESCRT/MVB system.
Figure 7. MDCs Cooperate with MVBs and Lysosomes to Protect Cells from Toxic Levels of Amino Acids.

(A) Images showing internalization of Bap2-GFP upon treatment with Rap, CHX, ConcA, IVA, or MTPA. Bar = 2 μm.
(B) Western blot analysis of Bap2-GFP clipping upon treatment with ConcA, CHX, Rap, IVA, and MTPA in wild-type and pep4Δ cells.
(C) Images showing stabilization of Bap2-GFP on the plasma membrane in Rap, CHX, ConcA, IVA or MTPA treated vps27Δ cells. Bright structures are class E compartments found in ESCRT mutants. Bar = 2 μm.
(D) Western blot analysis of Bap2-GFP clipping upon treatment with Rap, CHX, ConcA, IVA and MTPA in wild-type and vps27Δ cells.
(E-F) Quantification of MDC formation in low AA media supplemented with the indicated amount of leucine in wild-type (WT) and vps27Δ cells in absence (E) or presence (F) of ConcA treatment. Error bars show mean ± SE of N = three replicates with n = 100 cells per replicate.
(G) Growth of WT, gem1Δ, vps27Δ, or gem1Δvps27Δ strains in presence and absence of ConcA on low AA media supplemented with 10mg/ml of the indicated AA.
(H) The MVB pathway, MDCs, and vacuolar AA transporters cooperate to maintain cellular metabolic homeostasis. Combined loss off nutrient transporter control on all three cellular membranes renders cells sensitive to AA excess.
Based on these results, we reasoned that the ESCRT-dependent MVB pathway and MDCs may act in parallel to protect cells from amino acid stress. Consistent with this idea, addition of leucine alone was sufficient to activate MDC formation in cells lacking the ESCRT components VPS27 or DID4 (Figures 7E and Supplemental Figure S7D), and this effect was further enhanced by blocking vacuolar amino acid storage with ConcA (Figures 7F and Supplemental Figure S7E). Thus, loss of MVB formation hyperactivates the MDC pathway, suggesting these systems fulfill similar functions in controlling cellular amino acid pools. In support of this model, simultaneous loss of both systems was detrimental in the presence of high leucine or methionine, and severely inhibited growth when combined with loss of V-ATPase function (Figure 7G and Supplemental Figure S7F). By contrast, cells lacking either GEM1 or components of the ESCRT machinery alone exhibited mild to no growth defects on high amino acids Figure 7G and Supplemental Figure S7F). Growth inhibition only occurred in response to the MDC-inducing amino acids leucine and methionine, and was not caused by arginine or proline, two amino acids that do not activate the MDC pathway (Figure 7G and Supplemental Figure S7F).
We analyzed whole-cell metabolite pools in cells deficient in either MDC or MVB formation, as well as mutants deficient for both systems. Activation of MDC formation in low amino acid media supplemented with excess leucine caused a decline in TCA cycle metabolite and amino acid levels in wild-type cells, and these changes were largely suppressed in gem1Δ strains (Supplemental Figure S7G). Similar to wild-type cells, strains lacking VPS27 maintained metabolite regulation in response to vacuole inhibition with ConcA (Supplemental Figure S7G). However, cells deficient for both systems (gem1Δ vps27Δ strains) displayed elevated levels of amino acids under control conditions and failed to adjust their cellular amino acid content in response to ConcA treatment (Supplemental Figure S7G). We also observed low levels of TCA cycle intermediates in these mutants, suggesting a global breakdown in cellular and mitochondrial metabolism (Supplemental Figure S7G). These results indicate that MDCs act in parallel with vacuoles and the ESCRT-dependent MVB pathway to ensure cellular survival under conditions of amino acid overabundance stress (Figure 7H).
DISCUSSION
Here, we demonstrate that a previously identified structure associated with mitochondria, the MDC (Hughes et al., 2016), is a dynamic, cellular domain that is generated from mitochondria in response to intracellular amino acid overload. Upon formation, MDCs selectively sequester SLC25A metabolite carriers and their associated import receptor Tom70 away from the rest of the mitochondrial network. Loss of MDC formation impairs cellular metabolic adaptation to defects in vacuolar amino acid compartmentation and sensitizes cells to amino acid excess. Based on our data, we speculate that one function of MDCs is to protect cells from amino acid overload, potentially by acting as part of a broad cellular network that coordinately regulates intracellular nutrient distribution (Figure 7H). The three nodes of this network are the ESCRT-dependent MVB pathway that controls metabolite transporters at the PM (Katzmann et al., 2002), the vacuole, which sequesters and stores amino acids in its lumen (Klionsky et al., 1990; Wiemken and Dürr, 1974), and the MDC, which regulates SLC25A metabolite carriers on mitochondria (this study). Consistent with the idea that these systems act coordinately to preserve intracellular amino acid homeostasis, a collapse in the function of one of these systems impacts the activity of the others, and loss of all three impairs growth in presence of high amino acids. These results highlight the importance of maintaining proper amino acid homeostasis and suggest cells contain dedicated systems to cope with amino acid surplus.
The discovery of a new nutrient-sensitive compartment raises many important questions for future exploration. Central among them is how MDCs prevent toxicity from excess amino acids. Our data indicate that MDCs sequester SLC25A metabolite carriers from mitochondria into a domain that lacks ΔΨ required for optimal activity of these proteins. Thus, MDC formation may provide cells with a mechanism to acutely regulate the activity of SLC25A carriers, central nodes in cellular metabolism. In support of this idea, we find that cells deficient in MDC formation fail to adjust their amino acid content in response to acute defects in vacuolar amino acid storage. Interestingly, our data indicates that generation of MDCs on mitochondria increases the flux of glucose carbons into the TCA cycle, which may support amino acid catabolism via transaminases of the Ehrlich pathway. Notably, the Ehrlich pathway mediates degradation of the BCAAs leucine, isoleucine and valine, as well as methionine (Hazelwood et al., 2008), all potent activators of MDCs. This raises the exciting possibility that MDCs may function as a fusel alcohol generator, thereby promoting the degradation of non-preferred amino acids. However, due to technical limitations we were unable to detect BCAA derivatives and fusel alcohols under the culture conditions used in our assays. Thus, additional studies will be required to determine the precise molecular mechanism(s) by which sequestration of SLC25A carriers in MDCs promotes cellular metabolic homeostasis in response to amino acid elevation. An important line of investigation in these future studies will be determining whether the MDC promotes amino acid homeostasis by functioning as a sorting platform to remove proteins from the mitochondrial network, or whether MDCs operate as distinct sub-organelles. In support of the first model, we previously reported that MDCs can be degraded by autophagy in some instances (Hughes et al., 2016), suggesting MDC formation may promote the degradation of SLC25A carriers. However, since MDCs are generated over the course of two hours and persist in cells for long periods of time, it is possible that MDCs also perform specialized functions as a sub-organelle. Why such distinct fates exist for MDCs remains an important question moving forward.
We show that MDCs are responsive to elevated levels of intracellular amino acids, with BCAAs and downstream catabolites being the most potent MDC inducers. Surprisingly, we find that canonical nutrient sensing pathways appear to be dispensable for the activation of MDC formation in response to amino acid excess. Thus, it remains to be determined how signals arising from elevated amino acids and their metabolites are relayed to the MDC formation machinery. We anticipate that clues to this question may come from studies of other nutrient responsive systems, including the autophagosome and MVB pathways. Each of these systems contains machinery that integrate nutrient cues into remodeling of cellular membranes. In contrast to MDCs and the MVB pathway, autophagosomes are generated in response to nutrient deprivation, and nutrient cues are relayed to the autophagosome machinery via well-characterized nutrient sensing systems such as mTOR (Saxton and Sabatini, 2017; Yin et al., 2016). At this point, it appears that MDCs are activated in the exact opposite scenario as autophagosomes—under nutrient replete conditions. Interestingly, all treatments that stimulate MDC production also activate the degradation of PM nutrient transporters via the MVB pathway. Thus, it seems plausible that these two pathways utilize similar nutrient sensing systems, the identify of which is unknown at this time. Moving forward, it will be important to determine how the MDC and MVB systems act coordinately with vacuoles and protein translation machinery to regulate cellular amino acid homoeostasis, and how deficiencies in these systems impact cellular health.
Limitations of the Study
Here, we provide evidence that supports a role for MDCs in the regulation of cellular metabolism in response to amino acid excess. Because our understanding of MDC biogenesis is incomplete, the functional interrogation of the role of MDCs in amino acid metabolism relied on use of a genetic deletion of the conserved GTPase Gem1, which we recently showed is critical for MDC biogenesis (English et al., 2020). Since Gem1 is also involved in other mitochondrial pathways, it is possible that some phenotypes presented here may be attributable to other, non-MDC related functions of Gem1. Fully elucidating the function of MDCs within cells will require identification of additional machinery involved in MDC biogenesis, or the discovery of mutations within Gem1 that only impact its function in the MDC pathway.
STAR METHODS
Resource Availability
Lead Contact
Further information and requests for resources and reagents should be directed to and will be fulfilled by the Lead Contact, Adam Hughes (hughes@biochem.utah.edu). All unique/stable reagents generated in this study are available from the Lead Contact without restrictions.
Materials Availability
All unique/stable reagents generated in this study are available from the Lead Contact without restrictions.
Data and Code Availability
Metabolomics data have been deposited at the National Metabolomics Data Repository (https://www.metabolomicsworkbench.org/) as project ID PR001196, doi: 10.21228/M83X4N, and are publicly available as of the date of the publication. Accession numbers are also listed in the Key Resources Table. All other data reported in this paper will be shared by the lead contact upon request.
This paper does not report original code.
Any additional information required to reanalyze the data reported in this paper is available from the lead contact upon request.
KEY RESOURCES TABLE
| REAGENT or RESOURCE | SOURCE | IDENTIFIER |
|---|---|---|
| Antibodies | ||
| Mouse monoclonal anti-FLAG M2 | Sigma-Aldrich | Cat # F1804; RRID:AB_262044 |
| Mouse monoclonal anti-GFP clones 7.1 and 13.1 | Roche | Cat # 11814460001; RRID:AB_390913 |
| Mouse monoclonal anti-HA clone 12CA5 | Roche | Cat # 11583816001; RRID:AB_514505 |
| Mouse monoclonal anti-PGK1 clone 22C5D8 | Abcam | Cat # ab113687; RRID:AB_10861977 |
| Rabbit polyclonal anti-FLAG affinity purified | Sigma-Aldrich | Cat # F7425; RRID:AB_439687 |
| Rabbit polyclonal anti-Ssc1 | Pfanner Lab | N/A |
| Rabbit polyclonal anti-Tim50 | Pfanner Lab | N/A |
| Rabbit polyclonal anti-Tom20 | Pfanner Lab | N/A |
| Rabbit polyclonal anti-Tom70 | Pfanner Lab | N/A |
| Bacterial and Virus Strains | ||
| Escherichia coli DH5α | N/A | N/A |
| S. cerevisiae ORF collection (pDONR201/221) | Harvard Institute of Proteomics | N/A |
| Chemicals, Peptides, and Recombinant Proteins | ||
| α-Ketomethiobutyric acid (KMTB) | Sigma-Aldrich | Cat # K6000; CAS # 595-37-9 |
| 13C6-Glucose | Cambridge Isotope Laboratories | Cat # CLM-1396-PK; CAS #110187-42-3 |
| 3-Indoleacetic acid (Auxin) | Sigma-Aldrich | Cat # I3750 ; CAS # 87-51-4 |
| 3-Methylthiopropanal (MTPA) | Sigma-Aldrich | Cat # 277460; CAS # 123-38-6 |
| 3-Methylthiopropanol (MTP) | Sigma-Aldrich | Cat # 318396; CAS # 505-10-2 |
| 4,6-Diamidino-2-phenylindole dihydrochloride (DAPI) | ThermoFisher | Cat # D1306; CAS # 47165-04-8 |
| Ammonium Iron(II) Sulfate Hexahydrate | Sigma-Aldrich | Cat # 215406; CAS # 7783-85-9 |
| Antimycin A | Sigma-Aldrich | Cat # A8674; CAS # 1397-94-0 |
| Bathophenanthrolinedisulfonic Acid Disodium Salt Hydrate (BPS) | Sigma-Aldrich | Cat # 146617; CAS # 52746-49-3 |
| Carbonyl cyanide 4-(trifluoromethoxy)phenylhydrazone (FCCP) | Sigma-Aldrich | Cat # C2920; CAS # 370-86-5 |
| Casamino acids | US Biological | Cat # 0012501A; CAS # 65072-00-6 |
| Cobalt(II) chloride hexahydrate (CoCl2) | Sigma-Aldrich | Cat # C8661; CAS # 7791-13-1 |
| Concanamycin A | Santa Cruz Biotechnology | Cat # sc-202111; CAS # 80890-47-7 |
| Concanavalin A | Sigma-Aldrich | Cat # L7647; CAS # 11028-71-0 |
| Cycloheximide | Sigma-Aldrich | Cat # C1988; CAS # 66-81-9 |
| D4-Succinic acid | Sigma-Aldrich | Cat # 293075; CAS #14493-42-6 |
| Dimethyl sulfoxide (DMSO) | Sigma-Aldrich | Cat # D2650; CAS # 67-68-5 |
| EasyTag™ L-[35S]-Methionine | PerkinElmer | Cat # NEG709A; CAS #3654-96-4 |
| Hydrogen Peroxide (H2O2) | Sigma-Aldrich | Cat # H1009; CAS # 7722-84-1 |
| Isoamylalcohol (IAA) | Sigma-Aldrich | Cat # W205702; CAS # 123-51-3 |
| Isovaleraldehyde (IVA) | Sigma-Aldrich | Cat # 146455; CAS # 590-86-3 |
| Ketoisocaproic acid (KIC) | Sigma-Aldrich | Cat # 68255; CAS # 816-66-0 |
| Oligomycin A | Sigma-Aldrich | Cat # 75351; CAS # 1404-19-9 |
| Rapamycin | LC Laboritories | Cat # R-5000; CAS # 53123-88-9 |
| Tetramethylrhodamine methyl ester perchlorate (TMRM) | ThermoFisher | Cat # T668; CAS # 115532-50-8 |
| Torin1 | R&D Systems | Cat # 4247; CAS # 1222998-36-8 |
| Tunicamycin | Sigma-Aldrich | Cat # T7765; CAS # 66054-36-2 |
| Zymolyase 100T | Amsbio | Cat # 120493-1; CAS #37340-57-1 |
| Critical Commercial Assays | ||
| Bicinchoninic Acid Protein Assay | G Biosciences | Cat # 786-844 |
| Gateway LR Clonase II Enzyme Mix | Thermo Fisher | Cat # 11791020 |
| TNT SP6 Quick Coupled Transcription/Translation System | Promega | Cat # L2081 |
| Deposited Data | ||
| Metabolomics Data Deposited at National Metabolomics Data Repository (www.metabolomicsworkbench.org) | This study | Project ID PR001196, doi: 10.21228/M83X4N |
| Experimental Models: Organisms/Strains | ||
| BY4741 MATa his3Δ1 leu2Δ0 ura3Δ0 met15Δ0 | Brachmann et al., 1998; ATCC | Cat # 201388 |
| BY4743 MATa/MATα his3Δ1/his3Δ1 leu2Δ0/leu2Δ0 ura3Δ0/ura3Δ0 met15Δ0/+ lys2Δ0/+ | Brachmann et al., 1998; ATCC | Cat # 201390 |
| BY4741 BAP2-yEGFP:HisMX | This study | AHY10005 |
| BY4741 BAP2-yEGFP:HisMX did4Δ::URA3 | This study | AHY10156 |
| BY4741 BAP2-yEGFP:HisMX pep4Δ::URA3 | This study | AHY10495 |
| BY4741 BAP2-yEGFP:HisMX vps27Δ::URA3 | This study | AHY10154 |
| BY4741 DIC1-yEGFP:HisMX | This study | AHY9131 |
| BY4741 DIC1-yEGFP:HisMX gem1Δ::HygMX | This study | AHY10502 |
| BY4741 did4Δ::KanMX | This study | AHY9913 |
| BY4741 did4Δ::KanMX gem1Δ::HygMX | This study | AHY10145 |
| BY4741 gem1Δ::HygMX | This study | AHY4230 |
| BY4741 OAC1-HA:KanMX | This study | AHY6166 |
| BY4741 OAC1-HA:KanMX gem1Δ::HygMX | This study | AHY9415 |
| BY4741 TIM50-yEGFP:KanMX | This study | AHY1447 |
| BY4741 TOM70-mCherry:HygMX TIM50-yEGFP:HisMX OAC1-5xFLAG-KanMX | This study | AHY10546 |
| BY4741 TOM70-yEGFP:KanMX TIM50-mCherry:KanMX | This study | AHY7753 |
| BY4741 TOM70-yEGFP:KanMX TIM50-mCherry:KanMX ilv2Δ::URA3 | This study | AHY8345 |
| BY4741 vps27Δ::KanMX | This study | AHY9873 |
| BY4741 vps27Δ::KanMX gem1Δ::HygMX | This study | AHY10141 |
| BY4741 YMC2-yEGFP:HisMX | This study | AHY10456 |
| BY4741 YMC2-yEGFP:HisMX gem1Δ::HygMX | This study | AHY10496 |
| BY4743 ILV2-yEGFP:SpHIS5MX/+ TIM50-mCherry:KanMX/+ | This study | AHY7808 |
| BY4743 ILV2-yEGFP:SpHIS5MX/ILV2-yEGFP:SpHIS5MX TOM70-mCherry:KanMX/TOM70-mCherry:KanMX | This study | AHY8529 |
| BY4743 Tcd2-yEGFP:KanMX/+ Tim50-mCherry:KanMX/+ | This study | AHY9354 |
| BY4743 Tcd2-yEGFP:KanMX/+ Tim50-mCherry:KanMX/+ chr 1(199456-199457)::PGPD1-empty-TermCYC1-URA3/+ | This study | AHY10765 |
| BY4743 Tcd2-yEGFP:KanMX/+ Tim50-mCherry:KanMX/+ chr 1(199456-199457)::PGPD1-MTM1-TermCYC1-URA3/+ | This study | AHY10769 |
| BY4743 Tcd2-yEGFP:KanMX/+ Tim50-mCherry:KanMX/+ chr 1(199456-199457)::PGPD1-AAC1-TermCYC1-URA3/+ | This study | AHY10773 |
| BY4743 Tcd2-yEGFP:KanMX/+ Tim50-mCherry:KanMX/+ chr 1(199456-199457)::PGPD1-DIC1-TermCYC1-URA3/+ | This study | AHY10777 |
| BY4743 Tcd2-yEGFP:KanMX/+ Tim50-mCherry:KanMX/+ chr 1(199456-199457)::PGPD1-ODC1-TermCYC1-URA3/+ | This study | AHY10781 |
| BY4743 Tcd2-yEGFP:KanMX/+ Tim50-mCherry:KanMX/+ tom70Δ::URA3/tom70Δ::URA3 | This study | AHY9356 |
| BY4743 Tcd2-yEGFP:KanMX/+ Tim50-mCherry:KanMX/+ tom70Δ::URA3/tom70Δ::URA3 tom71Δ::LEU2/tom71Δ::LEU2 | This study | AHY9360 |
| BY4743 Tcd2-yEGFP:KanMX/+ Tim50-mCherry:KanMX/+ tom70Δ::URA3/tom70Δ::URA3 chr 1(199456-199457)::PGPD1-empty-TermCYC1-URA3/+ | This study | AHY10767 |
| BY4743 Tcd2-yEGFP:KanMX/+ Tim50-mCherry:KanMX/+ tom70Δ::URA3/tom70Δ::URA3 chr 1(199456-199457)::PGPD1-MTM1-TermCYC1-URA3/+ | This study | AHY10771 |
| BY4743 Tcd2-yEGFP:KanMX/+ Tim50-mCherry:KanMX/+ tom70Δ::URA3/tom70Δ::URA3 chr 1(199456-199457)::PGPD1-AAC1-TermCYC1-URA3/+ | This study | AHY10775 |
| BY4743 Tcd2-yEGFP:KanMX/+ Tim50-mCherry:KanMX/+ tom70Δ::URA3/tom70Δ::URA3 chr 1(199456-199457)::PGPD1-DIC1-TermCYC1-URA3/+ | This study | AHY10779 |
| BY4743 Tcd2-yEGFP:KanMX/+ Tim50-mCherry:KanMX/+ tom70Δ::URA3/tom70Δ::URA3 chr 1(199456-199457)::PGPD1-ODC1-TermCYC1-URA3/+ | This study | AHY10783 |
| BY4743 Tcd2-yEGFP:KanMX/+ Tim50-mCherry:KanMX/+ tom71Δ::LEU2/tom71Δ::LEU2 | This study | AHY9358 |
| BY4743 TIM50-mCherry:KanMX/+ OAC1-yEGFP:KanMx/+ | This study | AHY6259 |
| BY4743 TIM50-mCherry:KanMX/+ OAC1-yEGFP:KanMx/+ gem1Δ::HygMX/gem1Δ::HygMX | This study | AHY7802 |
| BY4743 TIM50-yEGFP:KanMX/+ TOM70-mCherry:KanMX/+ | This study | AHY7816 |
| BY4743 TOM20-yEGFP:KanMX/+ TIM50-mCherry:KanMX/+ | This study | AHY7804 |
| BY4743 TOM20-yEGFP:KanMX/+ TIM50-mCherry:KanMX/+ gem1Δ::HygMX/gem1Δ::HygMX | This study | AHY7806 |
| BY4743 TOM70-mCherry:KanMX/+ DIC1-yEGFP:hisMX/+ | This study | AHY10448 |
| BY4743 TOM70-mCherry:KanMX/+ DIC1-yEGFP:HisMX/+ gem1Δ::HygMX/gem1Δ::HygMX | This study | AHY10554 |
| BY4743 TOM70-mCherry:KanMX/+ MTM1-yEGFP:HisMX/+ | This study | AHY10468 |
| BY4743 TOM70-mCherry:KanMX/+ MTM1-yEGFP:HisMX/+ gem1Δ::HygMX/gem1Δ::HygMX | This study | AHY10548 |
| BY4743 TOM70-mCherry:KanMX/+ OAC1-yEGFP:KanMx/+ | This study | AHY6257 |
| BY4743 TOM70-mCherry:KanMX/+ ODC1-yEGFP:HisMX/+ | This study | AHY10466 |
| BY4743 TOM70-mCherry:KanMX/+ ODC1-yEGFP:HisMX/+ gem1Δ::HygMX/gem1Δ::HygMX | This study | AHY10552 |
| BY4743 TOM70-mCherry:KanMX/+ YMC2-yEGFP:HisMX/+ | This study | AHY10470 |
| BY4743 TOM70-mCherry:KanMX/+ YMC2-yEGFP:HisMX/+ gem1Δ::HygMX/gem1Δ::HygMX | This study | AHY10550 |
| BY4743 TOM70-mCherry:KanMX/TOM70-mCherry:KanMX TOM20-yEGFP:SpHIS5MX/TOM20-yEGFP:SpHIS5MX | This study | AHY8531 |
| BY4743 TOM70-yEGFP:HisMX/TOM70 TIM50-mCherry:SpHIS5MX/TIM50 vps27Δ::KanMX/vps27Δ::KanMX | This study | AHY10083 |
| BY4743 TOM70-yEGFP:HisMX/TOM70 TIM50-mCherry:SpHIS5MX/TIM50 vps27Δ::KanMX/vps27Δ::KanMX | This study | AHY10087 |
| BY4743 TOM70-yEGFP:KanMX/+ TIM50-mCherry:KanMX/+ | English et al., 2020 | AHY1480 |
| BY4743 TOM70-yEGFP:KanMX/+ TIM50-mCherry:KanMX/+ chr 1(199456-199457)::PGPD1-empty-TermCYC1-URA3/+ | This study | AHY7624 |
| BY4743 TOM70-yEGFP:KanMX/+ TIM50-mCherry:KanMX/+ chr 1(199456-199457)::PGPD1-TOM70-TermCYC1-URA3/+ | This study | AHY9119 |
| BY4743 TOM70-yEGFP:KanMX/+ TIM50-mCherry:KanMX/+ chr 1(199456-199457)::PGPD1-TOM20-TermCYC1-URA3/+ | This study | AHY9632 |
| BY4743 TOM70-yEGFP:KanMX/+ TIM50-mCherry:KanMX/+ chr 1(199456-199457)::PGPD1-TIM50-TermCYC1-URA3/+ | This study | AHY9724 |
| BY4743 TOM70-yEGFP:KanMX/+ TIM50-mCherry:KanMX/+ chr 1(199456-199457)::PGPD1-OAC1-TermCYC1-URA3/+ | This study | AHY7850 |
| BY4743 TOM70-yEGFP:KanMX/+ TIM50-mCherry:KanMX/+ chr 1(199456-199457)::PGPD1-AAC3-TermCYC1-URA3/+ | This study | AHY7852 |
| BY4743 TOM70-yEGFP:KanMX/+ TIM50-mCherry:KanMX/+ chr 1(199456-199457)::PGPD1-RIM2-TermCYC1-URA3/+ | This study | AHY7853 |
| BY4743 TOM70-yEGFP:KanMX/+ TIM50-mCherry:KanMX/+ chr 1(199456-199457)::PGPD1-AGC1-TermCYC1-URA3/+ | This study | AHY7854 |
| BY4743 TOM70-yEGFP:KanMX/+ TIM50-mCherry:KanMX/+ chr 1(199456-199457)::PGPD1-FLX1-TermCYC1-URA3/+ | This study | AHY7855 |
| BY4743 TOM70-yEGFP:KanMX/+ TIM50-mCherry:KanMX/+ chr 1(199456-199457)::PGPD1-ANT1-TermCYC1-URA3/+ | This study | AHY7864 |
| BY4743 TOM70-yEGFP:KanMX/+ TIM50-mCherry:KanMX/+ chr 1(199456-199457)::PGPD1-MME1-TermCYC1-URA3/+ | This study | AHY7865 |
| BY4743 TOM70-yEGFP:KanMX/+ TIM50-mCherry:KanMX/+ chr 1(199456-199457)::PGPD1-LEU5-TermCYC1-URA3/+ | This study | AHY7866 |
| BY4743 TOM70-yEGFP:KanMX/+ TIM50-mCherry:KanMX/+ chr 1(199456-199457)::PGPD1-TPC1-TermCYC1-URA3/+ | This study | AHY7867 |
| BY4743 TOM70-yEGFP:KanMX/+ TIM50-mCherry:KanMX/+ chr 1(199456-199457)::PGPD1-SFC1-TermCYC1-URA3/+ | This study | AHY7868 |
| BY4743 TOM70-yEGFP:KanMX/+ TIM50-mCherry:KanMX/+ chr 1(199456-199457)::PGPD1-ODC2-TermCYC1-URA3/+ | This study | AHY7869 |
| BY4743 TOM70-yEGFP:KanMX/+ TIM50-mCherry:KanMX/+ chr 1(199456-199457)::PGPD1-YHM1-TermCYC1-URA3/+ | This study | AHY7870 |
| BY4743 TOM70-yEGFP:KanMX/+ TIM50-mCherry:KanMX/+ chr 1(199456-199457)::PGPD1-YHM2-TermCYC1-URA3/+ | This study | AHY7884 |
| BY4743 TOM70-yEGFP:KanMX/+ TIM50-mCherry:KanMX/+ chr 1(199456-199457)::PGPD1-CRC1-TermCYC1-URA3/+ | This study | AHY7885 |
| BY4743 TOM70-yEGFP:KanMX/+ TIM50-mCherry:KanMX/+ chr 1(199456-199457)::PGPD1-YMC1-TermCYC1-URA3/+ | This study | AHY7886 |
| BY4743 TOM70-yEGFP:KanMX/+ TIM50-mCherry:KanMX/+ chr 1(199456-199457)::PGPD1-ODC1-TermCYC1-URA3/+ | This study | AHY7887 |
| BY4743 TOM70-yEGFP:KanMX/+ TIM50-mCherry:KanMX/+ chr 1(199456-199457)::PGPD1-DIC1-TermCYC1-URA3/+ | This study | AHY7888 |
| BY4743 TOM70-yEGFP:KanMX/+ TIM50-mCherry:KanMX/+ chr 1(199456-199457)::PGPD1-MTM1-TermCYC1-URA3/+ | This study | AHY7889 |
| BY4743 TOM70-yEGFP:KanMX/+ TIM50-mCherry:KanMX/+ chr 1(199456-199457)::PGPD1-HEM25-TermCYC1-URA3/+ | This study | AHY7890 |
| BY4743 TOM70-yEGFP:KanMX/+ TIM50-mCherry:KanMX/+ chr 1(199456-199457)::PGPD1-PIC2-TermCYC1-URA3/+ | This study | AHY7891 |
| BY4743 TOM70-yEGFP:KanMX/+ TIM50-mCherry:KanMX/+ chr 1(199456-199457)::PGPD1-MRX21-TermCYC1-URA3/+ | This study | AHY7892 |
| BY4743 TOM70-yEGFP:KanMX/+ TIM50-mCherry:KanMX/+ chr 1(199456-199457)::PGPD1-MIR1-TermCYC1-URA3/+ | This study | AHY7893 |
| BY4743 TOM70-yEGFP:KanMX/+ TIM50-mCherry:KanMX/+ chr 1(199456-199457)::PGPD1-MRS3-TermCYC1-URA3/+ | This study | AHY7894 |
| BY4743 TOM70-yEGFP:KanMX/+ TIM50-mCherry:KanMX/+ chr 1(199456-199457)::PGPD1-MRS4-TermCYC1-URA3/+ | This study | AHY7895 |
| BY4743 TOM70-yEGFP:KanMX/+ TIM50-mCherry:KanMX/+ chr 1(199456-199457)::PGPD1-ORT1-TermCYC1-URA3/+ | This study | AHY7896 |
| BY4743 TOM70-yEGFP:KanMX/+ TIM50-mCherry:KanMX/+ chr 1(199456-199457)::PGPD1-AAC1-TermCYC1-URA3/+ | This study | AHY7897 |
| BY4743 TOM70-yEGFP:KanMX/+ TIM50-mCherry:KanMX/+ chr 1(199456-199457)::PGPD1-YMC2-TermCYC1-URA3/+ | This study | AHY7898 |
| BY4743 TOM70-yEGFP:KanMX/+ TIM50-mCherry:KanMX/+ chr 1(199456-199457)::PGPD1-CTP1-TermCYC1-URA3/+ | This study | AHY7899 |
| BY4743 TOM70-yEGFP:KanMX/+ TIM50-mCherry:KanMX/+ gem1Δ::HygMX/ gem1Δ::HygMX pHLUM | This study | AHY9666 |
| BY4743 TOM70-yEGFP:KanMX/+ TIM50-mCherry:KanMX/+ gem1Δ::HygMX/gem1Δ::HygMX | English et al., 2020 | AHY4057 |
| BY4743 TOM70-yEGFP:KanMX/+ TIM50-mCherry:KanMX/+ pHLUM | This study | AHY4706 |
| BY4743 Tom70-yEGFP:KanMX/+ Tim50-mCherry:KanMX/+ tom20Δ::URA3/tom20Δ::URA3 | This study | AHY10032 |
| BY4743 TOM70-yEGFP:KanMX/TOM70-yEGFP:KanMX | English et al., 2020 | AHY5082 |
| BY4743 TOM70-yEGFP:KanMX/TOM70-yEGFP:KanMX TIM50-mCherry:KanMX/TIM50-mCherry:KanMX | This study | AHY7620 |
| BY4743 TOM70-yEGFP:KanMX/TOM70-yEGFP:KanMX TIM50-mCherry:KanMX/TIM50-mCherry:KanMX VMA2-6xFLAG:HygMX/VMA2-6xFLAG:HygMX LEU2:PGPD1-OsTir1-TermCYC1/leu2Δ0 | This study | AHY8322 |
| BY4743 TOM70-yEGFP:KanMX/TOM70-yEGFP:KanMX TIM50-mCherry:KanMX/TIM50-mCherry:KanMX VMA2-AID*-6xFLAG:HygMX/VMA2-AID*-6xFLAG:HygMX LEU2:PGPD1-OsTir1-TermCYC1/leu2Δ0 | This study | AHY8320 |
| BY4743 TOM70-yEGFP:KanMX/TOM70-yEGFP:KanMX TIM50-mCherry:KanMX/TIM50-mCherry:KanMX gcn2Δ::LEU2/gcn2Δ::LEU2 | This study | AHY8090 |
| BY4743 TOM70-yEGFP:KanMX/TOM70-yEGFP:KanMX TIM50-mCherry:KanMX/TIM50-mCherry:KanMX gln3Δ::LEU2/gln3Δ::LEU2 | This study | AHY8092 |
| BY4743 TOM70-yEGFP:KanMX/TOM70-yEGFP:KanMX TIM50-mCherry:KanMX/TIM50-mCherry:KanMX ssy1Δ::LEU2/ssy1Δ::LEU2 | This study | AHY8094 |
| BY4743 TOM70-yEGFP:KanMX/TOM70-yEGFP:KanMX TIM50-mCherry:KanMX/TIM50-mCherry:KanMX gpa2Δ::LEU2/gpa2Δ::LEU2 | This study | AHY8096 |
| BY4743 TOM70-yEGFP:KanMX/TOM70-yEGFP:KanMX TIM50-mCherry:KanMX/TIM50-mCherry:KanMX gpr1Δ::LEU2/gpr1Δ::LEU2 | This study | AHY8098 |
| BY4743 TOM70-yEGFP:KanMX/TOM70-yEGFP:KanMX TIM50-mCherry:KanMX/TIM50-mCherry:KanMX bat1Δ::HIS3/bat1Δ::HIS3 | This study | AHY9238 |
| BY4743 TOM70-yEGFP:KanMX/TOM70-yEGFP:KanMX TIM50-mCherry:KanMX/TIM50-mCherry:KanMX bat2Δ::URA3/bat2Δ::URA3 | This study | AHY9240 |
| BY4743 TOM70-yEGFP:KanMX/TOM70-yEGFP:KanMX TIM50-mCherry:KanMX/TIM50-mCherry:KanMX bat1Δ::HIS3/bat1Δ::HIS3 bat2Δ::URA3/bat2Δ::URA3 | This study | AHY9242 |
| BY4743 TOM70-yEGFP:SpHIS5MX/TOM70 TIM50-mCherry:SpHIS5MX/TIM50 did4Δ::KanMX/did4Δ::KanMX | This study | AHY10116 |
| BY4743 TOM70-yEGFP:SpHIS5MX/TOM70-yEGFP:SpHIS5MX TIM50-mCherry:KanMX/TIM50-mCherry:KanMX | English et al., 2020 | AHY7053 |
| BY4743 VMA2-6xFLAG:HygMX/VMA2-6xFLAG:HygMX LEU2:PGPD1-OsTir1-TermCYC1/ leu2Δ0 | This study | AHY8355 |
| BY4743 VMA2-AID*-6xFLAG:HygMX/VMA2-AID*-6xFLAG:HygMX LEU2:PGPD1-OsTir1-TermCYC1/leu2Δ0 | This study | AHY8353 |
| Oligonucleotides | ||
| See Table S2 | N/A | N/A |
| Recombinant DNA | ||
| Plasmid: pAG306GPD-AAC1 chr 1 | This study | N/A |
| Plasmid: pAG306GPD-AAC3 chr 1 | This study | N/A |
| Plasmid: pAG306GPD-AGC1 chr 1 | This study | N/A |
| Plasmid: pAG306GPD-ANT1 chr 1 | This study | N/A |
| Plasmid: pAG306GPD-ccdB chr 1 | Hughes and Gottschling, 2012 | N/A |
| Plasmid: pAG306GPD-CRC1 chr 1 | This study | N/A |
| Plasmid: pAG306GPD-CTP1 chr 1 | This study | N/A |
| Plasmid: pAG306GPD-DIC1 chr 1 | This study | N/A |
| Plasmid: pAG306GPD-empty chr 1 | Hughes and Gottschling, 2012 | N/A |
| Plasmid: pAG306GPD-FLX1 chr 1 | This study | N/A |
| Plasmid: pAG306GPD-HEM25 chr 1 | This study | N/A |
| Plasmid: pAG306GPD-LEU5 chr 1 | This study | N/A |
| Plasmid: pAG306GPD-MIR1 chr 1 | This study | N/A |
| Plasmid: pAG306GPD-MME1 chr 1 | This study | N/A |
| Plasmid: pAG306GPD-MRS3 chr 1 | This study | N/A |
| Plasmid: pAG306GPD-MRS4 chr 1 | This study | N/A |
| Plasmid: pAG306GPD-MRX21 chr 1 | This study | N/A |
| Plasmid: pAG306GPD-MTM1 chr 1 | This study | N/A |
| Plasmid: pAG306GPD-OAC1 chr 1 | This study | N/A |
| Plasmid: pAG306GPD-ODC1 chr 1 | This study | N/A |
| Plasmid: pAG306GPD-ODC2 chr 1 | This study | N/A |
| Plasmid: pAG306GPD-ORT1 chr 1 | This study | N/A |
| Plasmid: pAG306GPD-PIC2 chr 1 | This study | N/A |
| Plasmid: pAG306GPD-RIM2 chr 1 | This study | N/A |
| Plasmid: pAG306GPD-SFC1 chr 1 | This study | N/A |
| Plasmid: pAG306GPD-TIM50 chr 1 | This study | N/A |
| Plasmid: pAG306GPD-TOM20 chr 1 | This study | N/A |
| Plasmid: pAG306GPD-TOM70 chr 1 | This study | N/A |
| Plasmid: pAG306GPD-TPC1 chr 1 | This study | N/A |
| Plasmid: pAG306GPD-YHM1 chr 1 | This study | N/A |
| Plasmid: pAG306GPD-YHM2 chr 1 | This study | N/A |
| Plasmid: pAG306GPD-YMC1 chr 1 | This study | N/A |
| Plasmid: pAG306GPD-YMC2 chr 1 | This study | N/A |
| Plasmid: pGEM4-AAC2-DHFR | Ryan et al., 1999 | N/A |
| Plasmid: pHLUM | Mulleder et al., 2012; Addgene | Plasmid # 40276 |
| Plasmid: pHyg-6FLAG | This study | N/A |
| Plasmid: pHyg-AID*-6FLAG | Morawska and Ulrich, 2013; Addgene | Plasmid # 99519 |
| Plasmid: pKT127 | Sheff and Thorn, 2004; Addgene | Plasmid # 8728 |
| Plasmid: pKT127-mCherry | Daniel Gottschling (Calico) | N/A |
| Plasmid: pKT128 | Sheff and Thorn, 2004; Addgene | Plasmid # 8729 |
| Plasmid: pNH605-pGPD1-osTIR1 | Chan et al., 2018 | N/A |
| Plasmid: pRS305 | Sikorski and Hieter, 1989 | N/A |
| Plasmid: pRS306 | Sikorski and Hieter, 1989 | N/A |
| Plasmid: pRS40Hyg | Daniel Gottschling | N/A |
| Plasmid: pRS410 | Addgene | Plasmid # 11258 |
| Software and Algorithms | ||
| FIJI | Schindelin et al., 2012 | Version 1 |
| Image Lab | Bio-Rad | Version 6 |
| MassHunter Qual | Agilent | Version B.07.00 |
| MassHunter Quant | Agilent | Version B.07.00 |
| Photoshop CC | Adobe | Version 19 |
| Prism | GraphPad Software, Inc. | Version 9 |
| SnapGene | GSL Biotech | Version 4.2 |
| ZEN Black Edition | Carl Zeiss Microscopy | Version 2.3 |
| ZEN Blue Edition | Carl Zeiss Microscopy | Version 2.6 |
Experimental Model and Subject Details
Yeast Strains
All yeast strains are derivatives of Saccharomyces cerevisiae S288c (BY) (Brachmann et al., 1998). Strains expressing fluorescently tagged TOM70, TIM50, TOM20, ILV2, TCD2, BAP2, OAC1, ODC1, MTM1, YMC2 and/or AID*-6xFLAG/6xFLAG tagged VMA2 from their native loci were created by one step PCR-mediated carboxy-terminal endogenous epitope tagging using standard techniques and oligo pairs listed in Table S2. Plasmid templates for fluorescent epitope tagging were from the pKT series of vectors (Sheff and Thorn, 2004). Plasmids used for AID*-6xFLAG/6xFLAG tagging and integration of GPD-OsTir1 into the LEU2 locus are described below. Correct integrations were confirmed by a combination of colony PCR across the chromosomal insertion site and correctly localized expression of the fluorophore by microscopy. Deletion strains for TOM70, TOM71, TOM20, GEM1, PEP4, ILV2, BAT1 and/or BAT2, VPS27 and/or DID4 were generated by one step PCR-mediated gene replacement with the indicated selection cassette using standard techniques and oligo pairs listed in Table S2. Plasmid templates for gene replacement were from the pRS series of vectors (Sikorski and Hieter, 1989). Correct insertion of the selection cassette into the target gene was confirmed by colony PCR across the chromosomal insertion site. Yeast strains constitutively expressing TOM70, TOM20, TIM50 or the indicated mitochondrial carrier protein from the GPD promoter were generated by integration of the expression cassette into yeast chromosome I (199456-199457). Plasmids for integration of the GPD-driven expression cassette are described below. Correct insertion of the expression cassette into chromosome I was confirmed by colony PCR across the chromosomal insertion site.
Wild-type yeast strain AHY4706, which was rendered prototrophic with pHLUM (see below) to prevent complications caused by amino acid auxotrophies in the BY strain background, was used to quantify amino acid dependencies of MDC formation and for analysis of whole cell metabolite levels. Wild-type yeast strains AHY5082, AHY7053, AHY7620, AHY8529, AHY8531, AHY6257, AHY10448, AHY10466, AHY10468 and AHY10470 were used for super resolution and/or time-lapse imaging. AHY1447 and AHY10546 were used for indirect immuno fluorescence analysis. Wild-type and gem1Δ yeast strains AHY4706, AHY4057, AHY6259, AHY7802, AHY10448, AHY10554, AHY10466, AHY10552, AHY10468, AHY10548, AHY10470, AHY10550, AHY7808, AHY7816, AHY7804 and AHY7806 were used for quantification of MDC-dependent removal of proteins from mitochondria and protein enrichment in the MDC. Metabolite analysis was performed in AHY4706, AHY9666, BY4741, AHY4230, AHY9873 and AHY10141. Growth assays were performed with BY4741, AHY4230, AHY9873, AHY10141, AHY9913 and AHY10145. A complete list of all strains used in this manuscript can be found in the Key Resources Table.
Yeast Cell Culture and Media
Yeast cells were grown exponentially for 15 hours at 30 °C to a maximum density of 6×10⁶ cells/mL before the start of all experiments described in the paper, including MDC and spot assays. This period of overnight log-phase growth was carried out to ensure vacuolar and mitochondrial uniformity across the cell population and is essential for consistent MDC activation. Cells were cultured as indicated in media containing high amino acids (1 % yeast extract, 2 % peptone, 0.005 % adenine, 2 % glucose) or low amino acids (0.67 % yeast nitrogen base without amino acids, 2 % glucose, supplemented nutrients 0.074 g/L each adenine, alanine, arginine, asparagine, aspartic acid, cysteine, glutamic acid, glutamine, glycine, histidine, myo-inositol, isoleucine, lysine, methionine, phenylalanine, proline, serine, threonine, tryptophan, tyrosine, uracil, valine, 0.369 g/L leucine, 0.007 g/L para-aminobenzoic acid). For growth in medium lacking all amino acids (0.67 % yeast nitrogen base without amino acids, 2 % glucose), cells were cultured in low amino acid medium and then shifted to medium containing no amino acids at time of drug treatment. Where casamino acids were added to low or no amino acid media, casamino acids were added at time of drug treatment to a final concentration of 2 %. For single amino acid re-addition experiments, individual amino acids were added to medium containing low amino acids at the time of drug treatment. All amino acids were added to a final concentration of 20 mg/mL, except indicated otherwise, with the exception of cysteine and tyrosine, which were added at final concentrations of 5 mg/mL and 1 mg/mL respectively, due to toxicity and/or solubility issues. Leucine and methionine catabolites were added at a final concentration of 10 mM at the time of drug treatment. Drugs were added to cultures at final concentrations of concanamycin A (500 nM), cycloheximide (10 μg/mL), rapamycin (250 nM), torin1 (5 μM), antimycin A (40 μM), FCCP (10 μM), oligomycin (10 μM), H2O2 (10 μM), CoCl2 (1 mM), tunicamycin (5 μg/ml) and BPS (250 μM). Iron was added to cultures as (NH4)2Fe(SO4)2(H2O)6 at a final concentration of 2 mM.
Method Details
Plasmids
Plasmids used in this study are listed in the Key Resources Table. pHLUM, a yeast plasmid expressing multiple auxotrophic marker genes from their endogenous promoters, was obtained from Addgene (#40276) (Mulleder et al., 2012). pHyg-AID*-6FLAG (Morawska and Ulrich, 2013) and pNH605-pGPD1-osTIR1 (Chan et al., 2018) were described previously. To integrate GPD1-osTIR1 into the LEU2 locus, pNH605-pGPD1-osTIR1 was digested with Swa1. pHyg-6FLAG was generated by inserting 6FLAG amplified from pHyg-AID*-6FLAG into Kpn1/Xba1 digested pHyg-AID*-6FLAG. The plasmid for in vitro transcription and translation of AAC2-DHFR was a kind gift from Nikolaus Pfanner and has been described previously (Ryan et al., 1999). Plasmids for GPD-driven expression of TOM70, TOM20, TIM50 or the indicated mitochondrial carrier protein were generated by gateway mediated transfer of the corresponding ORF (Harvard Institute of Proteomics) from pDONR201/221 into pAG306GPD-ccdB chromosome I (Hughes and Gottschling, 2012) using Gateway™ LR Clonase™ II Enzyme mix (ThermoFisher) according to the manufacturer's instructions. To integrate the resulting expression plasmid into yeast chromosome I (199456-199457), pAG306GPD-ORF chromosome I was digested with NotI. All insert sequences were verified by the University of Utah Sequencing Core.
Yeast MDC assays
For yeast MDC assays, overnight log-phase cell cultures were grown in the presence of dimethyl sulfoxide (DMSO) or the indicated drug or metabolite for two hours. To acutely inhibit V-ATPase function by Auxin-inducible degradation of Vma2, overnight log-phase cell cultures were treated with 1 mM Auxin in high amino acid medium for the indicated times. For amino acid re-addition MDC assays, overnight log-phase cell cultures grown in low amino acid medium were shifted to low amino acid medium supplemented with the indicated amino acid and drug and grown for two hours. For amino acid addbacks in strains deficient for ILV2 or BAT1 and/or BAT2, the mutant strains and the corresponding wild-type controls were grown in high amino acid media overnight and shifted to low amino acid media supplemented with the indicated amino acid at time of drug treatment. After incubation, cells were harvested by centrifugation, resuspended in imaging buffer (5 % Glucose, 10 mM HEPES pH 7.6) and optical z-sections of live yeast cells were acquired with an AxioImager M2 (Carl Zeiss) or, for super-resolution images, an Airyscan LSM800 (Carl Zeiss) or Airyscan LSM880 (Carl Zeiss). The percentage of cells with MDCs was quantified in each experiment at the two-hour time point from maximum intensity projected wide field images generated in ZEN (Carl Zeiss). MDCs were identified as Tom70-enriched, Tim50-negative structures of varying size and shape. In tom70Δ and tom70Δ tom71Δ strains, GFP-tagged Tcd2, another MDC substrate (Hughes et al., 2016) was used to identify MDCs. A single focal plane is displayed for all yeast images with the exception of time-lapse images (see below).
Yeast Time-Lapse Imaging
For time-lapse imaging of yeast treated with ConcA, overnight log-phase cultures grown in high amino acid medium were treated with ConcA for 30 minutes. Cells were harvested by centrifugation, resuspended in low amino acid medium plus casamino acids and ConcA, and pipetted into flow chamber slides as previously described (Fees et al., 2017). Briefly, flow chambers were made using standard microscope slides and coverslips. Strips of parafilm were used to seal a coverslip to a slide and created the walls of the chamber. Flow chambers were coated with concanavalin A prior to loading cells. Melted Vaseline was used to seal the chamber. MDC formation was imaged every minute for 120 minutes. For time-lapse imaging of yeast treated with cycloheximide, overnight log-phase cultures grown in high amino acid medium were treated with cycloheximide for two minutes. Cells were harvested by centrifugation, resuspended in low amino acid medium plus casamino acids and cycloheximide, and pipetted into flow chamber slides. MDC formation was imaged every minute for 120 minutes. For time-lapse imaging of yeast treated with Rap, overnight log-phase cultures grown in high amino acid medium were treated with Rap for 15 minutes. Cells were harvested by centrifugation, resuspended in low amino acid medium supplemented with Cas AA and Rap, and pipetted into flow chamber slides. MDC formation was imaged every minute for 119 minutes. 300 nm optical z-sections of live yeast cells were acquired with an Airyscan LSM880 in Airyscan fast mode. Time-lapse images of yeast MDC formation show maximum intensity projections.
Yeast Indirect Immunofluorescence (IIF) Staining
For IIF staining, overnight log-phase cell cultures were grown to a final density of 4×10⁶ cells/ml and treated as indicated. Cells were harvested by centrifugation and fixed with 4 % paraformaldehyde in high amino acid medium for one hour. Fixed yeast cells were washed twice with wash buffer (0.1 M Tris/HCl pH 8, 1.2 M sorbitol) and incubated in DTT Buffer (10 mM DTT in 0.1 M Tris/HCl pH 9.4) at room temperature (RT) for ten minutes. Spheroplasts were generated by incubating cells in zymolyase buffer (0.1 M KPi pH 6.5, 1.2 M sorbitol, 0.25 mg/ml zymolyase 100T) at 30 °C for 30 minutes. Spheroplasts were gently diluted 1:40 using wash buffer and attached to glass slides pre-coated with 0.1 % poly-L-lysine (2 mg/ml). Samples were permeabilized with cold 0.1 % Triton X-100 in phosphate buffered saline (PBS) for ten minutes at 4 °C, briefly dried, and blocked in wash buffer containing 1 % bovine serum albumin (BSA) at RT for 30 minutes. After blocking, samples were incubated with primary antibody (monoclonal anti-FLAG M2 antibody produced in mouse, 1:200 diluted in wash buffer containing 1 % BSA; Tom70 antibody produced in rabbit, 1:250 diluted in wash buffer containing 1 % BSA) for one hour and 30 minutes at RT and secondary antibody (goat anti-mouse IgG (H+L) cross-absorbed secondary antibody, Alexa Fluor 488, 1:300 diluted in wash buffer containing 1 % BSA) for 45 minutes at RT. After incubation with primary and secondary antibodies, samples were washed ten times with wash buffer containing 1 % BSA and 0.1 % Tween-20. Finally, slides were washed twice with wash buffer before sealing, and mounted with HardSet medium (ProLong Glass Antifade Mountant with NucBlue Stain; Invitrogen) overnight. Wide-field images were acquired as described above.
Fluorescent Staining
In order to visualize mitochondrial DNA in yeast, cells were incubated with 2 μg/mL DAPI in high amino acid medium for 30 minutes at RT. To visualize the mitochondrial membrane potential in yeast, cells were reisolated by centrifugation, washed with imaging buffer and stained with 50 nM tetramethylrhodamine methyl ester (TMRM) for 15 minutes at RT. In case of ConcA treatment, media were supplemented with 2 mM iron during the treatment period to prevent loss of the mitochondrial membrane potential as previously described (Hughes et al., 2020). To visualize vacuolar acidity in yeast, cells were reisolated by centrifugation and stained with 20 μM Quinacrine in high amino acid medium supplemented with 50 mM HEPES pH 7.6 for ten minutes at 30 °C followed by a five-minute incubation on ice. Prior to imaging, cells were washed twice with imaging buffer.
Microscopy and Image Analysis
For quantification of MDC formation or fluorescence intensities, 200 nm optical z-sections of live yeast cells were acquired with an Axiolmager M2 (Carl Zeiss) equipped with an edge 4.2 CMOS camera (PCO) and 63× or 100× oil-immersion objectives (Carl Zeiss, Plan Apochromat, NA 1.4). Super resolution images showing MDC formation in live yeast cells were acquired with an LSM800 or LSM880 (Carl Zeiss) equipped with an Airyscan detector (Carl Zeiss) and 63× oil-immersion objective (Carl Zeiss, Plan Apochromat, NA 1.4). Widefield images were acquired with ZEN (Carl Zeiss), processed with Fiji (Schindelin et al., 2012), and represent single Z-sections. Super-resolution images were acquired with ZEN (Carl Zeiss), processed using the automated Airyscan processing algorithm in ZEN (Carl Zeiss) and Fiji, and represent single 200 nM z-sections (with the exception of time-lapse images). Individual channels of all images were minimally adjusted in Fiji to match the fluorescence intensities between channels for better visualization. Line-scan analysis was performed on non-adjusted, single z-sections from super resolution images. Fluorescence intensity analysis was performed on non-adjusted, maximum intensity projected wide-field images. To quantify the residual mitochondrial fluorescence upon MDC formation, the mean fluorescence intensity was measured along the entire mitochondrial tubule, excluding the MDC, using the freehand selection tool in Fiji and normalized to the untreated control sample. For analysis of fluorescence enrichment in the MDC, mean fluorescence intensities were measured in along the brightest part of the MDC using the line tool in Fiji and normalized to the mean fluorescence intensity in the directly adjacent mitochondrial tubule.
Isolation of Yeast Mitochondria
Yeast cells were grown in overnight in log-phase as described above, then treated with either DMSO or a combination of ConcA and rapamycin for 6 hours to a maximum density of 2×10⁷ cells/ml. Cells were then reisolated by centrifugation, washed with dH2O and the pellet weight was determined. Subsequently, cells were resuspended in 2 ml/g pellet dithiothreitol (DTT) buffer (0.1 M Tris, 10 mM DTT) and incubated for 20 minutes at 30 °C under constant shaking. After re-isolation by centrifugation, DTT treated cells were washed once with zymolyase buffer (1.2 M sorbitol, 20 mM K2HPO4, pH 7.4 with HCl) and cell walls were digested for 30 minutes at 30 °C under constant shaking in 7 ml/g pellet zymolyase buffer containing 1 mg/g pellet zymolyase 100T. After zymolyase digestion, cells were reisolated by centrifugation, washed with zymolyase buffer and lysed by mechanical disruption in 6.5 ml/g pellet homogenization buffer (0.6 M sorbitol, 10 mM Tris pH 7.4, 1 mM ethylenediaminetetraacetate (EDTA) pH 8.0 with KOH, 0.2 % BSA, 1 mM phenylmethylsulfonylfluoride) at 4 °C. Cell debris were removed from the homogenate twice by centrifugation at 5000 ×g for five min at 4 °C and mitochondria were pelleted at 14000 ×g for 15 min at 4 °C. The mitochondrial pellet was resuspended in SEM buffer (250 mM sucrose, 1 mM EDTA pH 8.0 with KOH, 10 mM 3-(N-morpholino)-propansulfonic acid pH 7.2), reisolated by differential centrifugation as described above, resuspended in SEM buffer and mitochondria were shock frozen in liquid nitrogen and stored at −80 °C.
Analysis of AAC2-DHFR Binding to the TOM Complex
35S-radiolabeled AAC2-DHFR was synthesized in rabbit reticulocyte lysate (TNT® SP6 Quick Coupled Transcription/Translation System; Promega) according to the manufacturer′s description. For in vitro analysis of precursor binding to the TOM complex, mitochondria were diluted in import buffer (3 % BSA, 250 mM sucrose, 80 mM KCl, 5 mM MgCl2, 5 mM methionine, 10 mM KH2PO4, 10 mM MOPS, pH 7.2 with KOH) supplemented with 5 mM creatine phosphate, 0.1 mg/ml creatine kinase, 2 mM ATP, 2 mM NADH. Subsequently the membrane potential was dissipated with 8 μM antimycin A, 1 μM valinomycin and 20 μM oligomycin (AVO) and samples were prewarmed to 25 °C. Radiolabeled AAC2-DHFR precursors were pre-incubated with 10 μM methotrexate (MTX), to fold the DHFR domain and thereby prevent precursor translocation across the OM, and the binding assay was started by adding 5 % (v/v) radiolabeled precursor and stopped by transfer on ice after the indicated times.
Mitochondria were reisolated by centrifugation at 20000 ×g for ten minutes at 4 °C, unbound precursor proteins were removed by washing pellets twice with SEM buffer containing 10 μM MTX and AVO, and samples were subjected to blue-native (BN) gel electrophoresis to separate protein complexes under non-denaturing conditions on a polyacrylamide gel (Schagger and von Jagow, 1991). Briefly, samples were solubilized in BN solubilization buffer (20 mM Tris/HCl pH 7.4, 0.1 mM EDTA/KOH pH 8.0, 50 mM NaCl, 10 % glycerol) containing 1 % digitonin (Calbiochem) and incubated for 15 minutes on ice before 10× BN loading dye (5 % Coomassie brilliant blue G 250, 0.5 M ε-amino-n-caproic acid, 0.1 M Bis/Tris, pH 7.0 with HCl) was added. Subsequently, non-solubilized membrane fractions were removed by centrifugation and 20000 ×g for ten min at 4 °C and the supernatant was subjected to a BN gradient gel (50 mM Bis/Tris, 60 mM ε-amino-n-caproic acid, pH 7.0 with HCl; stacking gel: 4 % acrylamide/bis-acrylamide (49.5 % T, 3 % C); separation gel: 4 % - 13 % acrylamide/bis-acrylamide (49.5 % T, 3 % C)). The gel was run at 600 V and 15 mA (cathode buffer: 50 mM Tricine, 15 mM Bis/Tris, 0.02 % Coomassie brilliant blue G 250; anode buffer: 50 mM Bis/Tris pH 7.0 with HCl), stained with Coomassie solution (40 % methanol, 7 % acetic acid, 1 % Coomassie brilliant blue R 250), de-stained (20 % methanol, 10 % acetic acid) to confirm equal protein loading, and dried. Binding of radiolabeled AAC2-DHFR to the TOM complex was analyzed by autoradiography.
Protein Preparation and Immunoblotting
For western blot analysis of protein levels, overnight log-phase cultures were treated as indicated and 5×10⁷ yeast cells were reisolated by centrifugation, washed with dH2O and incubated in 0.1 M NaOH for five minutes at RT. Subsequently, cells were reisolated by centrifugation at 16,000 ×g for ten minutes at 4 °C and lysed for five minutes at 95 °C in lysis buffer (10 mM Tris pH 6.8, 100 mM NaCl, 1 mM EDTA, 1 mM EDTA, 1 % SDS). Upon lysis, protein concentrations were determined by bicinchoninic acid assay (G Biosciences) and samples were denatured in Laemmli buffer (63 mM Tris pH 6.8, 2 % SDS, 10% glycerol, 1 mg/ml bromophenol blue, 1 % β-mercaptoethanol) for five minutes at 95 °C. To separate proteins based on molecular weight, equal amounts of protein were subjected to SDS polyacrylamide gel electrophoresis and transferred to PVDF membrane (Millipore) by wet transfer. Nonspecific antibody binding was blocked by incubation with Tris buffered saline (TBS) containing 5 % dry milk (Sigma Aldrich) for one hour at RT. After incubation with the primary antibodies for two hours at RT or at 4 °C overnight, membranes were washed five times with TBS and incubated with secondary antibody (goat-anti-rabbit/mouse HRP-conjugated, 1:2000 in TBS + 5 % dry milk, Sigma Aldrich) for 45 minutes at RT. Membranes were washed five times with TBS, enhanced chemiluminescence solution (Thermo Fisher) was applied and the antibody signal was detected with a BioRad Chemidoc MP system. All blots were exported as TIFFs using ImageLab 6.0 (BioRad) and cropped in Adobe Photoshop CC. Western blots show one representative blot from N = three replicates performed in parallel with the associated MDC assay.
RNA Isolation and RT-qPCR
For RNA isolation, 5×10⁷ of overnight log-phase yeast cell cultures grown in high amino acid media were harvested and resuspended in Trizol reagent to a final density of 6×10⁶ cells/ml. Cells were lysed with glass beads using an Omni Bead Ruptor 12 Homogenizer. Lysis was performed in six cycles of 20 seconds and was followed by centrifugation at 10,000 ×g for one minute at 4 °C. Supernatants were transferred to a new tube and ethanol was added to a final concentration of 50 %. RNA was isolated following the instruction of RNeasy Mini Kit (QIAGEN) and the concentration was determined by Nanodrop. RNA samples were treated with TURBO DNase kit (Invitrogen, AM2238) to clear DNA contamination. High Capacity cDNA Reverse Transcription Kits (Applied Biosystems, 4368814) were used for reverse transcription of RNA samples, followed by RT-qPCR using Lightcycler (Roche). MRL1 was used as internal control. Oligo pairs used for RT-qPCR are listed in Table S2.
Extraction of Whole Cell Metabolites from Yeast
For analysis of whole cell metabolite levels in high amino acid media, cells were grown exponentially in high amino acid media for 15 hours to a maximum density of 6×10⁶ cells/mL, resuspended in fresh media to a maximum density of 1.85×10⁷ cells/mL, and treated for three hours with the indicated drugs. 5×10⁷ total yeast cells were harvested by centrifugation for two minutes at 5000 ×g, washed once with ice cold water, and cell pellets were shock frozen in liquid nitrogen. Glucose tracing experiments were performed as described above, but cells were resuspended in high amino acid media containing 2 % 13C6-Glucose (Cambridge Isotope Laboratories). For analysis of whole cell metabolite levels in low amino acid media supplemented with leucine, cells were grown exponentially in low amino acid media for 15 hours to a maximum density of 6×10⁶ cells/mL, resuspended in low amino acid media supplemented with 10 mg/ml leucine to a maximum density of 1.85×10⁷ cells/mL and treated for three hours with ConcA. 5×10⁷ total yeast cells were harvested by fast quenching into four volumes of 100 % methanol at −40 °C (final 80 % methanol), pelleted by centrifugation for two minutes at 5000 ×g in a pre-cooled rotor at −20 °C, washed once with −40 °C cold 80 % methanol, and cell pellets were shock frozen in liquid nitrogen.
Whole cell metabolites were extracted from yeast cell pellets as previously described with slight modifications (Canelas et al., 2009). Briefly, 0.4 μg of the internal standard succinic-d4 acid (Sigma Aldrich 10907HD) was added to each sample. Subsequently, 5 mL of boiling 75% EtOH were added to each cell pellet, followed by vortex mixing and incubation at 90°C for five minutes. Cell debris were removed by centrifugation for three minutes at 7000 ×g and supernatants were transferred to new tubes and dried en vacuo. Pooled quality control samples were made by removing a fraction of collected supernatant from each sample and process blanks were made using only extraction solvent and no cell culture pellet.
GC-MS Analysis
GC-MS analysis was performed with an Agilent 5977B GC-MS MSD-HES or an Agilent 7200 GC-QToF-MS both using an Agilent 7693A automatic liquid sampler. Dried samples were suspended in 40 μl of a 40 mg/ml O-methoxylamine hydrochloride (MOX) (MP Bio #155405) in dry pyridine (EMD Millipore #PX2012-7) and incubated for one hour at 37 °C in a sand bath. 25 μl of this solution was added to auto sampler vials. 60 μl of N-methyl-N-trimethylsilyltrifluoracetamide (MSTFA with 1%TMCS, Thermo #TS48913) was added automatically via the auto sampler and incubated for 30 minutes at 37 °C. After incubation, samples were vortexed and 1 μl of the prepared sample was injected into the gas chromatograph inlet in the split mode with the inlet temperature held at 250°C. A 10:1 split ratio was used for analysis of the majority of metabolites. For those metabolites that saturated the instrument at the 10:1 split concentration, a split of 100:1 was used for analysis. The gas chromatograph had an initial temperature of 60°C for one minute followed by a 10°C/min ramp to 325°C and a hold time of 5 minutes followed by a 100°C/min ramp to 375°C. A 30-meter Phenomenex Zebron AB-5HT with 5m inert Guardian capillary column was employed for chromatographic separation. Helium was used as the carrier gas at a rate of 1 ml/min.
Data was collected using MassHunter software (Agilent). Metabolites were identified and their peak area was recorded using MassHunter Quant. This data was transferred to an Excel spread sheet (Microsoft, Redmond WA). Metabolite identity was established using a combination of an in-house metabolite library developed using pure purchased standards, the NIST library, and the Fiehn library. Values for each metabolite were normalized to the internal standard in each sample and are displayed as fold change compared to the control sample except otherwise indicated in the figure legend. For isotope tracer analysis the area under the curve for each isotope was extracted using MHQuant software (Agilent). This data was exported as a.csv file and isotopically corrected using an in house modified version of DeuteRater (Naylor et al., 2017). All error bars show the mean ± SE from N = three to four biological replicates analyzed in the same GC-MS run.
Yeast Growth Assay
To analyze growth of yeast cells on plates containing high levels of single amino acids, five-fold serial dilutions of over-night log-phase cultures grown in low amino acid medium were prepared in low amino acid medium and 3 μl of each dilution were spotted onto the agar medium (3% agar) denoted in each figure legend. Total cells plated in each dilution spot were 5,000, 1,000, 200, 40, and 8.
Quantification and Statistical Analysis
All experiments were repeated at least three times. All attempts at replication were successful. Sample sizes were as large as possible to be representative, but of a manageable size for quantifications. Specifically, for yeast MDC assays, N = three replicates, with n = 100 cells for each replicate, for quantification of fluorescence intensity analysis N = 45 cells from N = three replicates with N = 15 cells per replicate. For whole cell metabolite analysis and 13C6-Glucose tracing experiments, N = three to four biological replicates analyzed in the same GC-MS run. All statistical analysis was performed in Prism (GraphPad) and the used statistical test is indicated in the corresponding figure legend. No data were excluded from the analyses, with the exception of some metabolomics samples that did not meet the quality control cutoff. In the latter case, all samples of the affected biological replicate were excluded from any further analysis. No randomization or blinding was used as all experiments were performed with defined laboratory reagents and yeast strains of known genotypes.
Supplementary Material
Movie S1. Concanamycin A-Induced MDC Formation, Related to Figure 1.
An example of concanamycin A-induced MDC formation. Maximum intensity projection video of yeast expressing Tom70-GFP treated with concanamycin A. Images were taken every minute and are shown at 2 frames per second.
Movie S2. Dynamic MDC Behavior, Related to Figure 1.
An example of dynamic MDC behavior. Maximum intensity projection video of yeast expressing Tom70-GFP treated with concanamycin A. Images were taken every minute and are shown at 2 frames per second.
Movie S3. Cycloheximide-Induced MDC Formation, Related to Figure 3.
An example of cycloheximide-induced MDC formation. Maximum intensity projection video of yeast expressing Tom70-GFP treated with cycloheximide. Images were taken every minute and are shown at 2 frames per second.
Movie S4. Rapamycin-Induced MDC Formation, Related to Figure 3.
An example of rapamycin-induced MDC formation. Maximum intensity projection video of yeast expressing Tom70-GFP treated with rapamycin. Images were taken every minute and are shown at 2 frames per second.
Table S1. Analysis of carrier transcript levels in SLC25A overexpressing strains, Related to STAR Methods
Table S2. Oligonucleotides Used in This Study, Related to STAR Methods
Mitochondrial-derived compartments (MDCs) are micron-sized organelle subdomains
Formation of MDCs occurs in response to elevated amino acid levels
MDCs sequester the mitochondrial protein import receptor Tom70 and SLC25A carriers
MDC formation promotes cellular adaptation to amino acid excess
ACKNOWLEDGEMENTS
We thank members of the A.L.H. and J.M.S. laboratories, J. Rutter (Utah) and G. Ducker (Utah) for manuscript comments. We thank L. VanderMeer (Utah) and P. Guo (Utah) for technical assistance. Metabolomics analysis was performed at the University of Utah Metabolomics Core directed by J. Cox and supported by National Institutes of Health (NIH) grants 1S10OD016232-01, 1S10OD021505-01 and 1U54DK110858-01. Research was supported by NIH grants AG043095, GM119694, AG061376, and AG055648 (A.L.H.), NIH T32GM007464 (A.M.E.), NIH GM53466 and GM84970 (J.M.S.), AHA 18PRE33960427 (M.H.S.) and the Howard Hughes Medical Institute (J.M.S.). A.L.H. was further supported by an American Federation for Aging Research Junior Research Grant, United Mitochondrial Disease Foundation Early Career Research Grant, Searle Scholars Award, and Glenn Foundation for Medical Research Award.
Footnotes
DECLARATION OF INTERESTS
The authors declare no competing interests.
Publisher's Disclaimer: This is a PDF file of an unedited manuscript that has been accepted for publication. As a service to our customers we are providing this early version of the manuscript. The manuscript will undergo copyediting, typesetting, and review of the resulting proof before it is published in its final form. Please note that during the production process errors may be discovered which could affect the content, and all legal disclaimers that apply to the journal pertain.
REFERENCES
- Abe Y, Shodai T, Muto T, Mihara K, Torii H, Nishikawa S, Endo T, and Kohda D (2000). Structural basis of presequence recognition by the mitochondrial protein import receptor Tom20. Cell 100, 551–560. [DOI] [PubMed] [Google Scholar]
- Aliu E, Kanungo S, and Arnold GL (2018). Amino acid disorders. Ann Transl Med 6, 471. [DOI] [PMC free article] [PubMed] [Google Scholar]
- Ammerer G, Hunter CP, Rothman JH, Saari GC, Valls LA, and Stevens TH (1986). PEP4 gene of Saccharomyces cerevisiae encodes proteinase A, a vacuolar enzyme required for processing of vacuolar precursors. Mol Cell Biol 6, 2490–2499. [DOI] [PMC free article] [PubMed] [Google Scholar]
- Barbet NC, Schneider U, Helliwell SB, Stansfield I, Tuite MF, and Hall MN (1996). TOR controls translation initiation and early G1 progression in yeast. Mol Biol Cell 7, 25–42. [DOI] [PMC free article] [PubMed] [Google Scholar]
- Beugnet A, Tee AR, Taylor PM, and Proud CG (2003). Regulation of targets of mTOR (mammalian target of rapamycin) signalling by intracellular amino acid availability. Biochem J 372, 555–566. [DOI] [PMC free article] [PubMed] [Google Scholar]
- Brachmann CB, Davies A, Cost GJ, Caputo E, Li J, Hieter P, and Boeke JD (1998). Designer deletion strains derived from Saccharomyces cerevisiae S288C: a useful set of strains and plasmids for PCR-mediated gene disruption and other applications. Yeast 14, 115–132. [DOI] [PubMed] [Google Scholar]
- Canelas AB, ten Pierick A, Ras C, Seifar RM, van Dam JC, van Gulik WM, and Heijnen JJ (2009). Quantitative evaluation of intracellular metabolite extraction techniques for yeast metabolomics. Anal Chem 81, 7379–7389. [DOI] [PubMed] [Google Scholar]
- Cardenas ME, Cutler NS, Lorenz MC, Di Como CJ, and Heitman J (1999). The TOR signaling cascade regulates gene expression in response to nutrients. Genes Dev 13, 3271–3279. [DOI] [PMC free article] [PubMed] [Google Scholar]
- Chan LY, Mugler CF, Heinrich S, Vallotton P, and Weis K (2018). Non-invasive measurement of mRNA decay reveals translation initiation as the major determinant of mRNA stability. Elife 7. [DOI] [PMC free article] [PubMed] [Google Scholar]
- Chen EJ, and Kaiser CA (2003). LST8 negatively regulates amino acid biosynthesis as a component of the TOR pathway. J Cell Biol 161, 333–347. [DOI] [PMC free article] [PubMed] [Google Scholar]
- Chen KL, Ven TN, Crane MM, Brunner MLC, Pun AK, Helget KL, Brower K, Chen DE, Doan H, Dillard-Telm JD, et al. (2020). Loss of vacuolar acidity results in iron-sulfur cluster defects and divergent homeostatic responses during aging in Saccharomyces cerevisiae. Geroscience 42, 749–764. [DOI] [PMC free article] [PubMed] [Google Scholar]
- Dimmer KS, Fritz S, Fuchs F, Messerschmitt M, Weinbach N, Neupert W, and Westermann B (2002). Genetic basis of mitochondrial function and morphology in Saccharomyces cerevisiae. Mol Biol Cell 13, 847–853. [DOI] [PMC free article] [PubMed] [Google Scholar]
- Donaton MC, Holsbeeks I, Lagatie O, Van Zeebroeck G, Crauwels M, Winderickx J, and Thevelein JM (2003). The Gap1 general amino acid permease acts as an amino acid sensor for activation of protein kinase A targets in the yeast Saccharomyces cerevisiae. Mol Microbiol 50, 911–929. [DOI] [PubMed] [Google Scholar]
- Efeyan A, Comb WC, and Sabatini DM (2015). Nutrient-sensing mechanisms and pathways. Nature 517, 302–310. [DOI] [PMC free article] [PubMed] [Google Scholar]
- English AM, Schuler MH, Xiao T, Kornmann B, Shaw JM, and Hughes AL (2020). ER-mitochondria contacts promote mitochondrial-derived compartment biogenesis. J Cell Biol 219. [DOI] [PMC free article] [PubMed] [Google Scholar]
- Fees CP, Estrem C, and Moore JK (2017). High-resolution imaging and analysis of individual astral microtubule dynamics in budding yeast. J Vis Exp, 55610. [DOI] [PMC free article] [PubMed] [Google Scholar]
- Grauslund M, Didion T, Kielland-Brandt MC, and Andersen HA (1995). BAP2, a gene encoding a permease for branched-chain amino acids in Saccharomyces cerevisiae. Biochim Biophys Acta 1269, 275–280. [DOI] [PubMed] [Google Scholar]
- Hatakeyama R, and De Virgilio C (2019). TORC1 specifically inhibits microautophagy through ESCRT-0. Curr Genet 65, 1243–1249. [DOI] [PMC free article] [PubMed] [Google Scholar]
- Hazelwood LA, Daran JM, van Maris AJ, Pronk JT, and Dickinson JR (2008). The Ehrlich pathway for fusel alcohol production: a century of research on Saccharomyces cerevisiae metabolism. Appl Environ Microbiol 74, 2259–2266. [DOI] [PMC free article] [PubMed] [Google Scholar]
- Hines V, Brandt A, Griffiths G, Horstmann H, Brutsch H, and Schatz G (1990). Protein import into yeast mitochondria is accelerated by the outer membrane protein MAS70. EMBO J 9, 3191–3200. [DOI] [PMC free article] [PubMed] [Google Scholar]
- Hinnebusch AG (2005). Translational regulation of GCN4 and the general amino acid control of yeast. Annu Rev Microbiol 59, 407–450. [DOI] [PubMed] [Google Scholar]
- Hughes AL, and Gottschling DE (2012). An early age increase in vacuolar pH limits mitochondrial function and lifespan in yeast. Nature 492, 261–265. [DOI] [PMC free article] [PubMed] [Google Scholar]
- Hughes AL, Hughes CE, Henderson KA, Yazvenko N, and Gottschling DE (2016). Selective sorting and destruction of mitochondrial membrane proteins in aged yeast. Elife 5, pii: e13943. [DOI] [PMC free article] [PubMed] [Google Scholar]
- Hughes CE, Coody TK, Jeong MY, Berg JA, Winge DR, and Hughes AL (2020). Cysteine toxicity drives age-related mitochondrial decline by altering iron homeostasis. Cell 180, 296–310 e218. [DOI] [PMC free article] [PubMed] [Google Scholar]
- Hurley JH, and Emr SD (2006). The ESCRT complexes: structure and mechanism of a membrane-trafficking network. Annu Rev Biophys Biomol Struct 35, 277–298. [DOI] [PMC free article] [PubMed] [Google Scholar]
- Katzmann DJ, Odorizzi G, and Emr SD (2002). Receptor downregulation and multivesicular-body sorting. Nat Rev Mol Cell Biol 3, 893–905. [DOI] [PubMed] [Google Scholar]
- Klionsky DJ, Herman PK, and Emr SD (1990). The fungal vacuole: composition, function, and biogenesis. Microbiol Rev 54, 266–292. [DOI] [PMC free article] [PubMed] [Google Scholar]
- Kohlhaw GB (2003). Leucine biosynthesis in fungi: entering metabolism through the back door. Microbiol Mol Biol Rev 67, 1–15, table of contents. [DOI] [PMC free article] [PubMed] [Google Scholar]
- Lin CH, MacGurn JA, Chu T, Stefan CJ, and Emr SD (2008). Arrestin-related ubiquitin-ligase adaptors regulate endocytosis and protein turnover at the cell surface. Cell 135, 714–725. [DOI] [PubMed] [Google Scholar]
- Ljungdahl PO (2009). Amino-acid-induced signalling via the SPS-sensing pathway in yeast. Biochem Soc Trans 37, 242–247. [DOI] [PubMed] [Google Scholar]
- Ljungdahl PO, and Daignan-Fornier B (2012). Regulation of amino acid, nucleotide, and phosphate metabolism in Saccharomyces cerevisiae. Genetics 190, 885–929. [DOI] [PMC free article] [PubMed] [Google Scholar]
- Merz S, and Westermann B (2009). Genome-wide deletion mutant analysis reveals genes required for respiratory growth, mitochondrial genome maintenance and mitochondrial protein synthesis in Saccharomyces cerevisiae. Genome Biol 10, R95. [DOI] [PMC free article] [PubMed] [Google Scholar]
- Moczko M, Ehmann B, Gartner F, Honlinger A, Schafer E, and Pfanner N (1994). Deletion of the receptor MOM19 strongly impairs import of cleavable preproteins into Saccharomyces cerevisiae mitochondria. J Biol Chem 269, 9045–9051. [PubMed] [Google Scholar]
- Moczko M, Gartner F, and Pfanner N (1993). The protein import receptor MOM19 of yeast mitochondria. FEBS Lett 326, 251–254. [DOI] [PubMed] [Google Scholar]
- Monne M, Vozza A, Lasorsa FM, Porcelli V, and Palmieri F (2019). Mitochondrial carriers for aspartate, glutamate and other amino acids: a review. Int J Mol Sci 20. [DOI] [PMC free article] [PubMed] [Google Scholar]
- Morawska M, and Ulrich HD (2013). An expanded tool kit for the auxin-inducible degron system in budding yeast. Yeast 30, 341–351. [DOI] [PMC free article] [PubMed] [Google Scholar]
- Mulleder M, Capuano F, Pir P, Christen S, Sauer U, Oliver SG, and Ralser M (2012). A prototrophic deletion mutant collection for yeast metabolomics and systems biology. Nat Biotechnol 30, 1176–1178. [DOI] [PMC free article] [PubMed] [Google Scholar]
- Naylor BC, Porter MT, Wilson E, Herring A, Lofthouse S, Hannemann A, Piccolo SR, Rockwood AL, and Price JC (2017). DeuteRater: a tool for quantifying peptide isotope precision and kinetic proteomics. Bioinformatics 33, 1514–1520. [DOI] [PubMed] [Google Scholar]
- Newgard CB, An J, Bain JR, Muehlbauer MJ, Stevens RD, Lien LF, Haqq AM, Shah SH, Arlotto M, Slentz CA, et al. (2009). A branched-chain amino acid-related metabolic signature that differentiates obese and lean humans and contributes to insulin resistance. Cell Metab 9, 311–326. [DOI] [PMC free article] [PubMed] [Google Scholar]
- Nikko E, and Pelham HR (2009). Arrestin-mediated endocytosis of yeast plasma membrane transporters. Traffic 10, 1856–1867. [DOI] [PMC free article] [PubMed] [Google Scholar]
- Noda T, and Ohsumi Y (1998). Tor, a phosphatidylinositol kinase homologue, controls autophagy in yeast. J Biol Chem 273, 3963–3966. [DOI] [PubMed] [Google Scholar]
- Ohya Y, Umemoto N, Tanida I, Ohta A, Iida H, and Anraku Y (1991). Calcium-sensitive cls mutants of Saccharomyces cerevisiae showing a Pet- phenotype are ascribable to defects of vacuolar membrane H(+)-ATPase activity. J Biol Chem 266, 13971–13977. [PubMed] [Google Scholar]
- Palmieri F, and Monne M (2016). Discoveries, metabolic roles and diseases of mitochondrial carriers: a review. Biochim Biophys Acta 1863, 2362–2378. [DOI] [PubMed] [Google Scholar]
- Rabinowitz JD, and White E (2010). Autophagy and metabolism. Science 330, 1344–1348. [DOI] [PMC free article] [PubMed] [Google Scholar]
- Risinger AL, Cain NE, Chen EJ, and Kaiser CA (2006). Activity-dependent reversible inactivation of the general amino acid permease. Mol Biol Cell 17, 4411–4419. [DOI] [PMC free article] [PubMed] [Google Scholar]
- Rubio-Texeira M, and Kaiser CA (2006). Amino acids regulate retrieval of the yeast general amino acid permease from the vacuolar targeting pathway. Mol Biol Cell 17, 3031–3050. [DOI] [PMC free article] [PubMed] [Google Scholar]
- Ruiz SJ, van 't Klooster JS, Bianchi F, and Poolman B (2017). Growth inhibition by amino acids inSaccharomyces cerevisiae. BioRxiv. [DOI] [PMC free article] [PubMed] [Google Scholar]
- Ryan MT, Muller H, and Pfanner N (1999). Functional staging of ADP/ATP carrier translocation across the outer mitochondrial membrane. J Biol Chem 274, 20619–20627. [DOI] [PubMed] [Google Scholar]
- Saxton RA, and Sabatini DM (2017). mTOR Signaling in Growth, Metabolism, and Disease. Cell 168, 960–976. [DOI] [PMC free article] [PubMed] [Google Scholar]
- Schagger H, and von Jagow G (1991). Blue native electrophoresis for isolation of membrane protein complexes in enzymatically active form. Anal Biochem 199, 223–231. [DOI] [PubMed] [Google Scholar]
- Schindelin J, Arganda-Carreras I, Frise E, Kaynig V, Longair M, Pietzsch T, Preibisch S, Rueden C, Saalfeld S, Schmid B, et al. (2012). Fiji: an open-source platform for biological-image analysis. Nat Methods 9, 676–682. [DOI] [PMC free article] [PubMed] [Google Scholar]
- Schlossmann J, Lill R, Neupert W, and Court DA (1996). Tom71, a novel homologue of the mitochondrial preprotein receptor Tom70. J Biol Chem 271, 17890–17895. [DOI] [PubMed] [Google Scholar]
- Sheff MA, and Thorn KS (2004). Optimized cassettes for fluorescent protein tagging in Saccharomyces cerevisiae. Yeast 21, 661–670. [DOI] [PubMed] [Google Scholar]
- Sikorski RS, and Hieter P (1989). A system of shuttle vectors and yeast host strains designed for efficient manipulation of DNA in Saccharomyces cerevisiae. Genetics 122, 19–27. [DOI] [PMC free article] [PubMed] [Google Scholar]
- Sollner T, Pfaller R, Griffiths G, Pfanner N, and Neupert W (1990). A mitochondrial import receptor for the ADP/ATP carrier. Cell 62, 107–115. [DOI] [PubMed] [Google Scholar]
- Soultoukis GA, and Partridge L (2016). Dietary protein, Mmetabolism, and aging. Annu Rev Biochem 85, 5–34. [DOI] [PubMed] [Google Scholar]
- Steger HF, Sollner T, Kiebler M, Dietmeier KA, Pfaller R, Trulzsch KS, Tropschug M, Neupert W, and Pfanner N (1990). Import of ADP/ATP carrier into mitochondria: two receptors act in parallel. J Cell Biol 111, 2353–2363. [DOI] [PMC free article] [PubMed] [Google Scholar]
- Weber RA, Yen FS, Nicholson SPV, Alwaseem H, Bayraktar EC, Alam M, Timson RC, La K, Abu-Remaileh M, Molina H, et al. (2020). Maintaining iron homeostasis is the key role of lysosomal acidity for cell proliferation. Mol Cell 77, 645–655 e647. [DOI] [PMC free article] [PubMed] [Google Scholar]
- Wellen KE, and Thompson CB (2010). Cellular metabolic stress: considering how cells respond to nutrient excess. Mol Cell 40, 323–332. [DOI] [PMC free article] [PubMed] [Google Scholar]
- Wiemken A, and Dürr M (1974). Characterization of amino acid pools in the vacuolar compartment of Saccharomyces cerevisiae. Archives of Microbiology 101, 45–57. [DOI] [PubMed] [Google Scholar]
- Yamamoto H, Esaki M, Kanamori T, Tamura Y, Nishikawa S, and Endo T (2002). Tim50 is a subunit of the TIM23 complex that links protein translocation across the outer and inner mitochondrial membranes. Cell 111, 519–528. [DOI] [PubMed] [Google Scholar]
- Yambire KF, Rostosky C, Watanabe T, Pacheu-Grau D, Torres-Odio S, Sanchez-Guerrero A, Senderovich O, Meyron-Holtz EG, Milosevic I, Frahm J, et al. (2019). Impaired lysosomal acidification triggers iron deficiency and inflammation in vivo. Elife 8. [DOI] [PMC free article] [PubMed] [Google Scholar]
- Yin Z, Pascual C, and Klionsky DJ (2016). Autophagy: machinery and regulation. Microb Cell 3, 588–596. [DOI] [PMC free article] [PubMed] [Google Scholar]
- Young JC, Hoogenraad NJ, and Hartl FU (2003). Molecular chaperones Hsp90 and Hsp70 deliver preproteins to the mitochondrial import receptor Tom70. Cell 112, 41–50. [DOI] [PubMed] [Google Scholar]
Associated Data
This section collects any data citations, data availability statements, or supplementary materials included in this article.
Supplementary Materials
Movie S1. Concanamycin A-Induced MDC Formation, Related to Figure 1.
An example of concanamycin A-induced MDC formation. Maximum intensity projection video of yeast expressing Tom70-GFP treated with concanamycin A. Images were taken every minute and are shown at 2 frames per second.
Movie S2. Dynamic MDC Behavior, Related to Figure 1.
An example of dynamic MDC behavior. Maximum intensity projection video of yeast expressing Tom70-GFP treated with concanamycin A. Images were taken every minute and are shown at 2 frames per second.
Movie S3. Cycloheximide-Induced MDC Formation, Related to Figure 3.
An example of cycloheximide-induced MDC formation. Maximum intensity projection video of yeast expressing Tom70-GFP treated with cycloheximide. Images were taken every minute and are shown at 2 frames per second.
Movie S4. Rapamycin-Induced MDC Formation, Related to Figure 3.
An example of rapamycin-induced MDC formation. Maximum intensity projection video of yeast expressing Tom70-GFP treated with rapamycin. Images were taken every minute and are shown at 2 frames per second.
Table S1. Analysis of carrier transcript levels in SLC25A overexpressing strains, Related to STAR Methods
Table S2. Oligonucleotides Used in This Study, Related to STAR Methods
Data Availability Statement
Metabolomics data have been deposited at the National Metabolomics Data Repository (https://www.metabolomicsworkbench.org/) as project ID PR001196, doi: 10.21228/M83X4N, and are publicly available as of the date of the publication. Accession numbers are also listed in the Key Resources Table. All other data reported in this paper will be shared by the lead contact upon request.
This paper does not report original code.
Any additional information required to reanalyze the data reported in this paper is available from the lead contact upon request.
KEY RESOURCES TABLE
| REAGENT or RESOURCE | SOURCE | IDENTIFIER |
|---|---|---|
| Antibodies | ||
| Mouse monoclonal anti-FLAG M2 | Sigma-Aldrich | Cat # F1804; RRID:AB_262044 |
| Mouse monoclonal anti-GFP clones 7.1 and 13.1 | Roche | Cat # 11814460001; RRID:AB_390913 |
| Mouse monoclonal anti-HA clone 12CA5 | Roche | Cat # 11583816001; RRID:AB_514505 |
| Mouse monoclonal anti-PGK1 clone 22C5D8 | Abcam | Cat # ab113687; RRID:AB_10861977 |
| Rabbit polyclonal anti-FLAG affinity purified | Sigma-Aldrich | Cat # F7425; RRID:AB_439687 |
| Rabbit polyclonal anti-Ssc1 | Pfanner Lab | N/A |
| Rabbit polyclonal anti-Tim50 | Pfanner Lab | N/A |
| Rabbit polyclonal anti-Tom20 | Pfanner Lab | N/A |
| Rabbit polyclonal anti-Tom70 | Pfanner Lab | N/A |
| Bacterial and Virus Strains | ||
| Escherichia coli DH5α | N/A | N/A |
| S. cerevisiae ORF collection (pDONR201/221) | Harvard Institute of Proteomics | N/A |
| Chemicals, Peptides, and Recombinant Proteins | ||
| α-Ketomethiobutyric acid (KMTB) | Sigma-Aldrich | Cat # K6000; CAS # 595-37-9 |
| 13C6-Glucose | Cambridge Isotope Laboratories | Cat # CLM-1396-PK; CAS #110187-42-3 |
| 3-Indoleacetic acid (Auxin) | Sigma-Aldrich | Cat # I3750 ; CAS # 87-51-4 |
| 3-Methylthiopropanal (MTPA) | Sigma-Aldrich | Cat # 277460; CAS # 123-38-6 |
| 3-Methylthiopropanol (MTP) | Sigma-Aldrich | Cat # 318396; CAS # 505-10-2 |
| 4,6-Diamidino-2-phenylindole dihydrochloride (DAPI) | ThermoFisher | Cat # D1306; CAS # 47165-04-8 |
| Ammonium Iron(II) Sulfate Hexahydrate | Sigma-Aldrich | Cat # 215406; CAS # 7783-85-9 |
| Antimycin A | Sigma-Aldrich | Cat # A8674; CAS # 1397-94-0 |
| Bathophenanthrolinedisulfonic Acid Disodium Salt Hydrate (BPS) | Sigma-Aldrich | Cat # 146617; CAS # 52746-49-3 |
| Carbonyl cyanide 4-(trifluoromethoxy)phenylhydrazone (FCCP) | Sigma-Aldrich | Cat # C2920; CAS # 370-86-5 |
| Casamino acids | US Biological | Cat # 0012501A; CAS # 65072-00-6 |
| Cobalt(II) chloride hexahydrate (CoCl2) | Sigma-Aldrich | Cat # C8661; CAS # 7791-13-1 |
| Concanamycin A | Santa Cruz Biotechnology | Cat # sc-202111; CAS # 80890-47-7 |
| Concanavalin A | Sigma-Aldrich | Cat # L7647; CAS # 11028-71-0 |
| Cycloheximide | Sigma-Aldrich | Cat # C1988; CAS # 66-81-9 |
| D4-Succinic acid | Sigma-Aldrich | Cat # 293075; CAS #14493-42-6 |
| Dimethyl sulfoxide (DMSO) | Sigma-Aldrich | Cat # D2650; CAS # 67-68-5 |
| EasyTag™ L-[35S]-Methionine | PerkinElmer | Cat # NEG709A; CAS #3654-96-4 |
| Hydrogen Peroxide (H2O2) | Sigma-Aldrich | Cat # H1009; CAS # 7722-84-1 |
| Isoamylalcohol (IAA) | Sigma-Aldrich | Cat # W205702; CAS # 123-51-3 |
| Isovaleraldehyde (IVA) | Sigma-Aldrich | Cat # 146455; CAS # 590-86-3 |
| Ketoisocaproic acid (KIC) | Sigma-Aldrich | Cat # 68255; CAS # 816-66-0 |
| Oligomycin A | Sigma-Aldrich | Cat # 75351; CAS # 1404-19-9 |
| Rapamycin | LC Laboritories | Cat # R-5000; CAS # 53123-88-9 |
| Tetramethylrhodamine methyl ester perchlorate (TMRM) | ThermoFisher | Cat # T668; CAS # 115532-50-8 |
| Torin1 | R&D Systems | Cat # 4247; CAS # 1222998-36-8 |
| Tunicamycin | Sigma-Aldrich | Cat # T7765; CAS # 66054-36-2 |
| Zymolyase 100T | Amsbio | Cat # 120493-1; CAS #37340-57-1 |
| Critical Commercial Assays | ||
| Bicinchoninic Acid Protein Assay | G Biosciences | Cat # 786-844 |
| Gateway LR Clonase II Enzyme Mix | Thermo Fisher | Cat # 11791020 |
| TNT SP6 Quick Coupled Transcription/Translation System | Promega | Cat # L2081 |
| Deposited Data | ||
| Metabolomics Data Deposited at National Metabolomics Data Repository (www.metabolomicsworkbench.org) | This study | Project ID PR001196, doi: 10.21228/M83X4N |
| Experimental Models: Organisms/Strains | ||
| BY4741 MATa his3Δ1 leu2Δ0 ura3Δ0 met15Δ0 | Brachmann et al., 1998; ATCC | Cat # 201388 |
| BY4743 MATa/MATα his3Δ1/his3Δ1 leu2Δ0/leu2Δ0 ura3Δ0/ura3Δ0 met15Δ0/+ lys2Δ0/+ | Brachmann et al., 1998; ATCC | Cat # 201390 |
| BY4741 BAP2-yEGFP:HisMX | This study | AHY10005 |
| BY4741 BAP2-yEGFP:HisMX did4Δ::URA3 | This study | AHY10156 |
| BY4741 BAP2-yEGFP:HisMX pep4Δ::URA3 | This study | AHY10495 |
| BY4741 BAP2-yEGFP:HisMX vps27Δ::URA3 | This study | AHY10154 |
| BY4741 DIC1-yEGFP:HisMX | This study | AHY9131 |
| BY4741 DIC1-yEGFP:HisMX gem1Δ::HygMX | This study | AHY10502 |
| BY4741 did4Δ::KanMX | This study | AHY9913 |
| BY4741 did4Δ::KanMX gem1Δ::HygMX | This study | AHY10145 |
| BY4741 gem1Δ::HygMX | This study | AHY4230 |
| BY4741 OAC1-HA:KanMX | This study | AHY6166 |
| BY4741 OAC1-HA:KanMX gem1Δ::HygMX | This study | AHY9415 |
| BY4741 TIM50-yEGFP:KanMX | This study | AHY1447 |
| BY4741 TOM70-mCherry:HygMX TIM50-yEGFP:HisMX OAC1-5xFLAG-KanMX | This study | AHY10546 |
| BY4741 TOM70-yEGFP:KanMX TIM50-mCherry:KanMX | This study | AHY7753 |
| BY4741 TOM70-yEGFP:KanMX TIM50-mCherry:KanMX ilv2Δ::URA3 | This study | AHY8345 |
| BY4741 vps27Δ::KanMX | This study | AHY9873 |
| BY4741 vps27Δ::KanMX gem1Δ::HygMX | This study | AHY10141 |
| BY4741 YMC2-yEGFP:HisMX | This study | AHY10456 |
| BY4741 YMC2-yEGFP:HisMX gem1Δ::HygMX | This study | AHY10496 |
| BY4743 ILV2-yEGFP:SpHIS5MX/+ TIM50-mCherry:KanMX/+ | This study | AHY7808 |
| BY4743 ILV2-yEGFP:SpHIS5MX/ILV2-yEGFP:SpHIS5MX TOM70-mCherry:KanMX/TOM70-mCherry:KanMX | This study | AHY8529 |
| BY4743 Tcd2-yEGFP:KanMX/+ Tim50-mCherry:KanMX/+ | This study | AHY9354 |
| BY4743 Tcd2-yEGFP:KanMX/+ Tim50-mCherry:KanMX/+ chr 1(199456-199457)::PGPD1-empty-TermCYC1-URA3/+ | This study | AHY10765 |
| BY4743 Tcd2-yEGFP:KanMX/+ Tim50-mCherry:KanMX/+ chr 1(199456-199457)::PGPD1-MTM1-TermCYC1-URA3/+ | This study | AHY10769 |
| BY4743 Tcd2-yEGFP:KanMX/+ Tim50-mCherry:KanMX/+ chr 1(199456-199457)::PGPD1-AAC1-TermCYC1-URA3/+ | This study | AHY10773 |
| BY4743 Tcd2-yEGFP:KanMX/+ Tim50-mCherry:KanMX/+ chr 1(199456-199457)::PGPD1-DIC1-TermCYC1-URA3/+ | This study | AHY10777 |
| BY4743 Tcd2-yEGFP:KanMX/+ Tim50-mCherry:KanMX/+ chr 1(199456-199457)::PGPD1-ODC1-TermCYC1-URA3/+ | This study | AHY10781 |
| BY4743 Tcd2-yEGFP:KanMX/+ Tim50-mCherry:KanMX/+ tom70Δ::URA3/tom70Δ::URA3 | This study | AHY9356 |
| BY4743 Tcd2-yEGFP:KanMX/+ Tim50-mCherry:KanMX/+ tom70Δ::URA3/tom70Δ::URA3 tom71Δ::LEU2/tom71Δ::LEU2 | This study | AHY9360 |
| BY4743 Tcd2-yEGFP:KanMX/+ Tim50-mCherry:KanMX/+ tom70Δ::URA3/tom70Δ::URA3 chr 1(199456-199457)::PGPD1-empty-TermCYC1-URA3/+ | This study | AHY10767 |
| BY4743 Tcd2-yEGFP:KanMX/+ Tim50-mCherry:KanMX/+ tom70Δ::URA3/tom70Δ::URA3 chr 1(199456-199457)::PGPD1-MTM1-TermCYC1-URA3/+ | This study | AHY10771 |
| BY4743 Tcd2-yEGFP:KanMX/+ Tim50-mCherry:KanMX/+ tom70Δ::URA3/tom70Δ::URA3 chr 1(199456-199457)::PGPD1-AAC1-TermCYC1-URA3/+ | This study | AHY10775 |
| BY4743 Tcd2-yEGFP:KanMX/+ Tim50-mCherry:KanMX/+ tom70Δ::URA3/tom70Δ::URA3 chr 1(199456-199457)::PGPD1-DIC1-TermCYC1-URA3/+ | This study | AHY10779 |
| BY4743 Tcd2-yEGFP:KanMX/+ Tim50-mCherry:KanMX/+ tom70Δ::URA3/tom70Δ::URA3 chr 1(199456-199457)::PGPD1-ODC1-TermCYC1-URA3/+ | This study | AHY10783 |
| BY4743 Tcd2-yEGFP:KanMX/+ Tim50-mCherry:KanMX/+ tom71Δ::LEU2/tom71Δ::LEU2 | This study | AHY9358 |
| BY4743 TIM50-mCherry:KanMX/+ OAC1-yEGFP:KanMx/+ | This study | AHY6259 |
| BY4743 TIM50-mCherry:KanMX/+ OAC1-yEGFP:KanMx/+ gem1Δ::HygMX/gem1Δ::HygMX | This study | AHY7802 |
| BY4743 TIM50-yEGFP:KanMX/+ TOM70-mCherry:KanMX/+ | This study | AHY7816 |
| BY4743 TOM20-yEGFP:KanMX/+ TIM50-mCherry:KanMX/+ | This study | AHY7804 |
| BY4743 TOM20-yEGFP:KanMX/+ TIM50-mCherry:KanMX/+ gem1Δ::HygMX/gem1Δ::HygMX | This study | AHY7806 |
| BY4743 TOM70-mCherry:KanMX/+ DIC1-yEGFP:hisMX/+ | This study | AHY10448 |
| BY4743 TOM70-mCherry:KanMX/+ DIC1-yEGFP:HisMX/+ gem1Δ::HygMX/gem1Δ::HygMX | This study | AHY10554 |
| BY4743 TOM70-mCherry:KanMX/+ MTM1-yEGFP:HisMX/+ | This study | AHY10468 |
| BY4743 TOM70-mCherry:KanMX/+ MTM1-yEGFP:HisMX/+ gem1Δ::HygMX/gem1Δ::HygMX | This study | AHY10548 |
| BY4743 TOM70-mCherry:KanMX/+ OAC1-yEGFP:KanMx/+ | This study | AHY6257 |
| BY4743 TOM70-mCherry:KanMX/+ ODC1-yEGFP:HisMX/+ | This study | AHY10466 |
| BY4743 TOM70-mCherry:KanMX/+ ODC1-yEGFP:HisMX/+ gem1Δ::HygMX/gem1Δ::HygMX | This study | AHY10552 |
| BY4743 TOM70-mCherry:KanMX/+ YMC2-yEGFP:HisMX/+ | This study | AHY10470 |
| BY4743 TOM70-mCherry:KanMX/+ YMC2-yEGFP:HisMX/+ gem1Δ::HygMX/gem1Δ::HygMX | This study | AHY10550 |
| BY4743 TOM70-mCherry:KanMX/TOM70-mCherry:KanMX TOM20-yEGFP:SpHIS5MX/TOM20-yEGFP:SpHIS5MX | This study | AHY8531 |
| BY4743 TOM70-yEGFP:HisMX/TOM70 TIM50-mCherry:SpHIS5MX/TIM50 vps27Δ::KanMX/vps27Δ::KanMX | This study | AHY10083 |
| BY4743 TOM70-yEGFP:HisMX/TOM70 TIM50-mCherry:SpHIS5MX/TIM50 vps27Δ::KanMX/vps27Δ::KanMX | This study | AHY10087 |
| BY4743 TOM70-yEGFP:KanMX/+ TIM50-mCherry:KanMX/+ | English et al., 2020 | AHY1480 |
| BY4743 TOM70-yEGFP:KanMX/+ TIM50-mCherry:KanMX/+ chr 1(199456-199457)::PGPD1-empty-TermCYC1-URA3/+ | This study | AHY7624 |
| BY4743 TOM70-yEGFP:KanMX/+ TIM50-mCherry:KanMX/+ chr 1(199456-199457)::PGPD1-TOM70-TermCYC1-URA3/+ | This study | AHY9119 |
| BY4743 TOM70-yEGFP:KanMX/+ TIM50-mCherry:KanMX/+ chr 1(199456-199457)::PGPD1-TOM20-TermCYC1-URA3/+ | This study | AHY9632 |
| BY4743 TOM70-yEGFP:KanMX/+ TIM50-mCherry:KanMX/+ chr 1(199456-199457)::PGPD1-TIM50-TermCYC1-URA3/+ | This study | AHY9724 |
| BY4743 TOM70-yEGFP:KanMX/+ TIM50-mCherry:KanMX/+ chr 1(199456-199457)::PGPD1-OAC1-TermCYC1-URA3/+ | This study | AHY7850 |
| BY4743 TOM70-yEGFP:KanMX/+ TIM50-mCherry:KanMX/+ chr 1(199456-199457)::PGPD1-AAC3-TermCYC1-URA3/+ | This study | AHY7852 |
| BY4743 TOM70-yEGFP:KanMX/+ TIM50-mCherry:KanMX/+ chr 1(199456-199457)::PGPD1-RIM2-TermCYC1-URA3/+ | This study | AHY7853 |
| BY4743 TOM70-yEGFP:KanMX/+ TIM50-mCherry:KanMX/+ chr 1(199456-199457)::PGPD1-AGC1-TermCYC1-URA3/+ | This study | AHY7854 |
| BY4743 TOM70-yEGFP:KanMX/+ TIM50-mCherry:KanMX/+ chr 1(199456-199457)::PGPD1-FLX1-TermCYC1-URA3/+ | This study | AHY7855 |
| BY4743 TOM70-yEGFP:KanMX/+ TIM50-mCherry:KanMX/+ chr 1(199456-199457)::PGPD1-ANT1-TermCYC1-URA3/+ | This study | AHY7864 |
| BY4743 TOM70-yEGFP:KanMX/+ TIM50-mCherry:KanMX/+ chr 1(199456-199457)::PGPD1-MME1-TermCYC1-URA3/+ | This study | AHY7865 |
| BY4743 TOM70-yEGFP:KanMX/+ TIM50-mCherry:KanMX/+ chr 1(199456-199457)::PGPD1-LEU5-TermCYC1-URA3/+ | This study | AHY7866 |
| BY4743 TOM70-yEGFP:KanMX/+ TIM50-mCherry:KanMX/+ chr 1(199456-199457)::PGPD1-TPC1-TermCYC1-URA3/+ | This study | AHY7867 |
| BY4743 TOM70-yEGFP:KanMX/+ TIM50-mCherry:KanMX/+ chr 1(199456-199457)::PGPD1-SFC1-TermCYC1-URA3/+ | This study | AHY7868 |
| BY4743 TOM70-yEGFP:KanMX/+ TIM50-mCherry:KanMX/+ chr 1(199456-199457)::PGPD1-ODC2-TermCYC1-URA3/+ | This study | AHY7869 |
| BY4743 TOM70-yEGFP:KanMX/+ TIM50-mCherry:KanMX/+ chr 1(199456-199457)::PGPD1-YHM1-TermCYC1-URA3/+ | This study | AHY7870 |
| BY4743 TOM70-yEGFP:KanMX/+ TIM50-mCherry:KanMX/+ chr 1(199456-199457)::PGPD1-YHM2-TermCYC1-URA3/+ | This study | AHY7884 |
| BY4743 TOM70-yEGFP:KanMX/+ TIM50-mCherry:KanMX/+ chr 1(199456-199457)::PGPD1-CRC1-TermCYC1-URA3/+ | This study | AHY7885 |
| BY4743 TOM70-yEGFP:KanMX/+ TIM50-mCherry:KanMX/+ chr 1(199456-199457)::PGPD1-YMC1-TermCYC1-URA3/+ | This study | AHY7886 |
| BY4743 TOM70-yEGFP:KanMX/+ TIM50-mCherry:KanMX/+ chr 1(199456-199457)::PGPD1-ODC1-TermCYC1-URA3/+ | This study | AHY7887 |
| BY4743 TOM70-yEGFP:KanMX/+ TIM50-mCherry:KanMX/+ chr 1(199456-199457)::PGPD1-DIC1-TermCYC1-URA3/+ | This study | AHY7888 |
| BY4743 TOM70-yEGFP:KanMX/+ TIM50-mCherry:KanMX/+ chr 1(199456-199457)::PGPD1-MTM1-TermCYC1-URA3/+ | This study | AHY7889 |
| BY4743 TOM70-yEGFP:KanMX/+ TIM50-mCherry:KanMX/+ chr 1(199456-199457)::PGPD1-HEM25-TermCYC1-URA3/+ | This study | AHY7890 |
| BY4743 TOM70-yEGFP:KanMX/+ TIM50-mCherry:KanMX/+ chr 1(199456-199457)::PGPD1-PIC2-TermCYC1-URA3/+ | This study | AHY7891 |
| BY4743 TOM70-yEGFP:KanMX/+ TIM50-mCherry:KanMX/+ chr 1(199456-199457)::PGPD1-MRX21-TermCYC1-URA3/+ | This study | AHY7892 |
| BY4743 TOM70-yEGFP:KanMX/+ TIM50-mCherry:KanMX/+ chr 1(199456-199457)::PGPD1-MIR1-TermCYC1-URA3/+ | This study | AHY7893 |
| BY4743 TOM70-yEGFP:KanMX/+ TIM50-mCherry:KanMX/+ chr 1(199456-199457)::PGPD1-MRS3-TermCYC1-URA3/+ | This study | AHY7894 |
| BY4743 TOM70-yEGFP:KanMX/+ TIM50-mCherry:KanMX/+ chr 1(199456-199457)::PGPD1-MRS4-TermCYC1-URA3/+ | This study | AHY7895 |
| BY4743 TOM70-yEGFP:KanMX/+ TIM50-mCherry:KanMX/+ chr 1(199456-199457)::PGPD1-ORT1-TermCYC1-URA3/+ | This study | AHY7896 |
| BY4743 TOM70-yEGFP:KanMX/+ TIM50-mCherry:KanMX/+ chr 1(199456-199457)::PGPD1-AAC1-TermCYC1-URA3/+ | This study | AHY7897 |
| BY4743 TOM70-yEGFP:KanMX/+ TIM50-mCherry:KanMX/+ chr 1(199456-199457)::PGPD1-YMC2-TermCYC1-URA3/+ | This study | AHY7898 |
| BY4743 TOM70-yEGFP:KanMX/+ TIM50-mCherry:KanMX/+ chr 1(199456-199457)::PGPD1-CTP1-TermCYC1-URA3/+ | This study | AHY7899 |
| BY4743 TOM70-yEGFP:KanMX/+ TIM50-mCherry:KanMX/+ gem1Δ::HygMX/ gem1Δ::HygMX pHLUM | This study | AHY9666 |
| BY4743 TOM70-yEGFP:KanMX/+ TIM50-mCherry:KanMX/+ gem1Δ::HygMX/gem1Δ::HygMX | English et al., 2020 | AHY4057 |
| BY4743 TOM70-yEGFP:KanMX/+ TIM50-mCherry:KanMX/+ pHLUM | This study | AHY4706 |
| BY4743 Tom70-yEGFP:KanMX/+ Tim50-mCherry:KanMX/+ tom20Δ::URA3/tom20Δ::URA3 | This study | AHY10032 |
| BY4743 TOM70-yEGFP:KanMX/TOM70-yEGFP:KanMX | English et al., 2020 | AHY5082 |
| BY4743 TOM70-yEGFP:KanMX/TOM70-yEGFP:KanMX TIM50-mCherry:KanMX/TIM50-mCherry:KanMX | This study | AHY7620 |
| BY4743 TOM70-yEGFP:KanMX/TOM70-yEGFP:KanMX TIM50-mCherry:KanMX/TIM50-mCherry:KanMX VMA2-6xFLAG:HygMX/VMA2-6xFLAG:HygMX LEU2:PGPD1-OsTir1-TermCYC1/leu2Δ0 | This study | AHY8322 |
| BY4743 TOM70-yEGFP:KanMX/TOM70-yEGFP:KanMX TIM50-mCherry:KanMX/TIM50-mCherry:KanMX VMA2-AID*-6xFLAG:HygMX/VMA2-AID*-6xFLAG:HygMX LEU2:PGPD1-OsTir1-TermCYC1/leu2Δ0 | This study | AHY8320 |
| BY4743 TOM70-yEGFP:KanMX/TOM70-yEGFP:KanMX TIM50-mCherry:KanMX/TIM50-mCherry:KanMX gcn2Δ::LEU2/gcn2Δ::LEU2 | This study | AHY8090 |
| BY4743 TOM70-yEGFP:KanMX/TOM70-yEGFP:KanMX TIM50-mCherry:KanMX/TIM50-mCherry:KanMX gln3Δ::LEU2/gln3Δ::LEU2 | This study | AHY8092 |
| BY4743 TOM70-yEGFP:KanMX/TOM70-yEGFP:KanMX TIM50-mCherry:KanMX/TIM50-mCherry:KanMX ssy1Δ::LEU2/ssy1Δ::LEU2 | This study | AHY8094 |
| BY4743 TOM70-yEGFP:KanMX/TOM70-yEGFP:KanMX TIM50-mCherry:KanMX/TIM50-mCherry:KanMX gpa2Δ::LEU2/gpa2Δ::LEU2 | This study | AHY8096 |
| BY4743 TOM70-yEGFP:KanMX/TOM70-yEGFP:KanMX TIM50-mCherry:KanMX/TIM50-mCherry:KanMX gpr1Δ::LEU2/gpr1Δ::LEU2 | This study | AHY8098 |
| BY4743 TOM70-yEGFP:KanMX/TOM70-yEGFP:KanMX TIM50-mCherry:KanMX/TIM50-mCherry:KanMX bat1Δ::HIS3/bat1Δ::HIS3 | This study | AHY9238 |
| BY4743 TOM70-yEGFP:KanMX/TOM70-yEGFP:KanMX TIM50-mCherry:KanMX/TIM50-mCherry:KanMX bat2Δ::URA3/bat2Δ::URA3 | This study | AHY9240 |
| BY4743 TOM70-yEGFP:KanMX/TOM70-yEGFP:KanMX TIM50-mCherry:KanMX/TIM50-mCherry:KanMX bat1Δ::HIS3/bat1Δ::HIS3 bat2Δ::URA3/bat2Δ::URA3 | This study | AHY9242 |
| BY4743 TOM70-yEGFP:SpHIS5MX/TOM70 TIM50-mCherry:SpHIS5MX/TIM50 did4Δ::KanMX/did4Δ::KanMX | This study | AHY10116 |
| BY4743 TOM70-yEGFP:SpHIS5MX/TOM70-yEGFP:SpHIS5MX TIM50-mCherry:KanMX/TIM50-mCherry:KanMX | English et al., 2020 | AHY7053 |
| BY4743 VMA2-6xFLAG:HygMX/VMA2-6xFLAG:HygMX LEU2:PGPD1-OsTir1-TermCYC1/ leu2Δ0 | This study | AHY8355 |
| BY4743 VMA2-AID*-6xFLAG:HygMX/VMA2-AID*-6xFLAG:HygMX LEU2:PGPD1-OsTir1-TermCYC1/leu2Δ0 | This study | AHY8353 |
| Oligonucleotides | ||
| See Table S2 | N/A | N/A |
| Recombinant DNA | ||
| Plasmid: pAG306GPD-AAC1 chr 1 | This study | N/A |
| Plasmid: pAG306GPD-AAC3 chr 1 | This study | N/A |
| Plasmid: pAG306GPD-AGC1 chr 1 | This study | N/A |
| Plasmid: pAG306GPD-ANT1 chr 1 | This study | N/A |
| Plasmid: pAG306GPD-ccdB chr 1 | Hughes and Gottschling, 2012 | N/A |
| Plasmid: pAG306GPD-CRC1 chr 1 | This study | N/A |
| Plasmid: pAG306GPD-CTP1 chr 1 | This study | N/A |
| Plasmid: pAG306GPD-DIC1 chr 1 | This study | N/A |
| Plasmid: pAG306GPD-empty chr 1 | Hughes and Gottschling, 2012 | N/A |
| Plasmid: pAG306GPD-FLX1 chr 1 | This study | N/A |
| Plasmid: pAG306GPD-HEM25 chr 1 | This study | N/A |
| Plasmid: pAG306GPD-LEU5 chr 1 | This study | N/A |
| Plasmid: pAG306GPD-MIR1 chr 1 | This study | N/A |
| Plasmid: pAG306GPD-MME1 chr 1 | This study | N/A |
| Plasmid: pAG306GPD-MRS3 chr 1 | This study | N/A |
| Plasmid: pAG306GPD-MRS4 chr 1 | This study | N/A |
| Plasmid: pAG306GPD-MRX21 chr 1 | This study | N/A |
| Plasmid: pAG306GPD-MTM1 chr 1 | This study | N/A |
| Plasmid: pAG306GPD-OAC1 chr 1 | This study | N/A |
| Plasmid: pAG306GPD-ODC1 chr 1 | This study | N/A |
| Plasmid: pAG306GPD-ODC2 chr 1 | This study | N/A |
| Plasmid: pAG306GPD-ORT1 chr 1 | This study | N/A |
| Plasmid: pAG306GPD-PIC2 chr 1 | This study | N/A |
| Plasmid: pAG306GPD-RIM2 chr 1 | This study | N/A |
| Plasmid: pAG306GPD-SFC1 chr 1 | This study | N/A |
| Plasmid: pAG306GPD-TIM50 chr 1 | This study | N/A |
| Plasmid: pAG306GPD-TOM20 chr 1 | This study | N/A |
| Plasmid: pAG306GPD-TOM70 chr 1 | This study | N/A |
| Plasmid: pAG306GPD-TPC1 chr 1 | This study | N/A |
| Plasmid: pAG306GPD-YHM1 chr 1 | This study | N/A |
| Plasmid: pAG306GPD-YHM2 chr 1 | This study | N/A |
| Plasmid: pAG306GPD-YMC1 chr 1 | This study | N/A |
| Plasmid: pAG306GPD-YMC2 chr 1 | This study | N/A |
| Plasmid: pGEM4-AAC2-DHFR | Ryan et al., 1999 | N/A |
| Plasmid: pHLUM | Mulleder et al., 2012; Addgene | Plasmid # 40276 |
| Plasmid: pHyg-6FLAG | This study | N/A |
| Plasmid: pHyg-AID*-6FLAG | Morawska and Ulrich, 2013; Addgene | Plasmid # 99519 |
| Plasmid: pKT127 | Sheff and Thorn, 2004; Addgene | Plasmid # 8728 |
| Plasmid: pKT127-mCherry | Daniel Gottschling (Calico) | N/A |
| Plasmid: pKT128 | Sheff and Thorn, 2004; Addgene | Plasmid # 8729 |
| Plasmid: pNH605-pGPD1-osTIR1 | Chan et al., 2018 | N/A |
| Plasmid: pRS305 | Sikorski and Hieter, 1989 | N/A |
| Plasmid: pRS306 | Sikorski and Hieter, 1989 | N/A |
| Plasmid: pRS40Hyg | Daniel Gottschling | N/A |
| Plasmid: pRS410 | Addgene | Plasmid # 11258 |
| Software and Algorithms | ||
| FIJI | Schindelin et al., 2012 | Version 1 |
| Image Lab | Bio-Rad | Version 6 |
| MassHunter Qual | Agilent | Version B.07.00 |
| MassHunter Quant | Agilent | Version B.07.00 |
| Photoshop CC | Adobe | Version 19 |
| Prism | GraphPad Software, Inc. | Version 9 |
| SnapGene | GSL Biotech | Version 4.2 |
| ZEN Black Edition | Carl Zeiss Microscopy | Version 2.3 |
| ZEN Blue Edition | Carl Zeiss Microscopy | Version 2.6 |