. 2021 Sep 27;10:e65068. doi: 10.7554/eLife.65068

Figure 2. PLC activity regulates cell polarization in the human embryo.

(a) Scheme of the PLCE1/PLCB1 siRNA injections. (b), Representative images of embryos injected with control siRNA or PLCE1/PLCB1 siRNA and cultured until embryonic day four to reveal the localization of F-actin, PARD6, and DAPI. (c) Quantification of the percentage of embryos showing PARD6 polarized cells in embryos from panel b. The number in each bar indicates the number of embryos analyzed. N = 17 embryos for control siRNA injected group; N = 12 for PLCB1+ PLCE1 siRNA injected group. * p < 0.05. Fisher’s exact test. Three independent experiments. (d) Quantification of apical F-actin fluorescence intensity in embryos from panel b. N = 92 control siRNA cells and N = 100 PLCB1+ PLCB1 siRNA cells. **p < 0.0001, Mann-Whitney test. (e) Quantification of apical PARD6 fluorescence intensity in embryos from panel f. N = 89 control siRNA cells and N = 100 PLCB1+ PLCB1 siRNA cells. ****p < 0.0001, Mann-Whitney test. Scale bars, 15 µm.

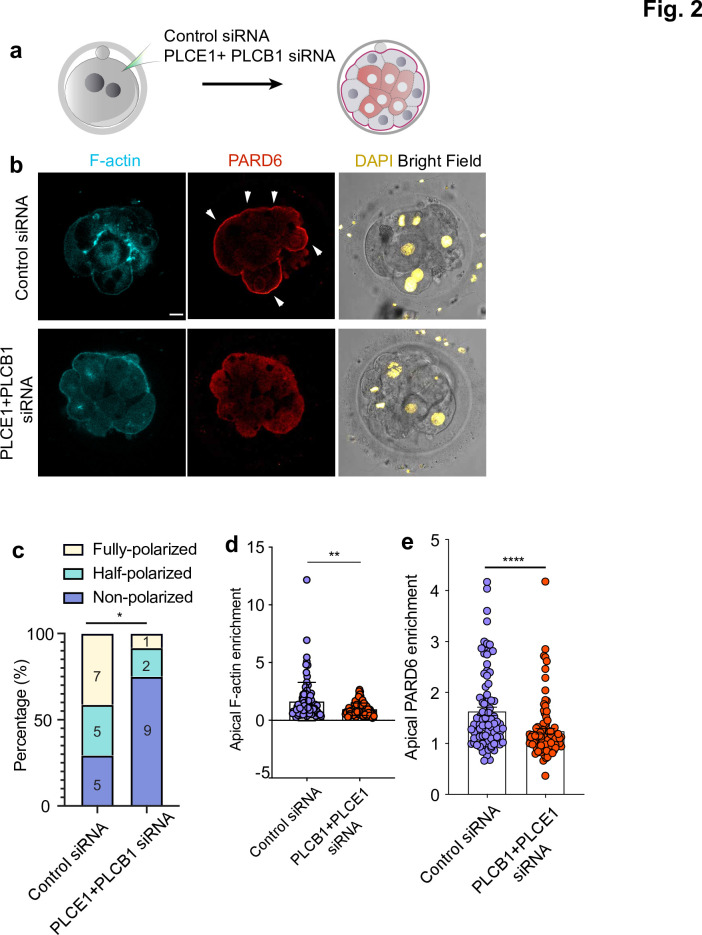
Figure 2—source data 1. Source data for Figure 2.
This file contains the source data used to make the graphs presented in Figure 2 and Figure 2—figure supplements 1 and 2. GraphPad Prism was utilized to visually represent the quantitative data.
elife-65068-fig2-data1.xlsx (146.2KB, xlsx)

Figure 2.

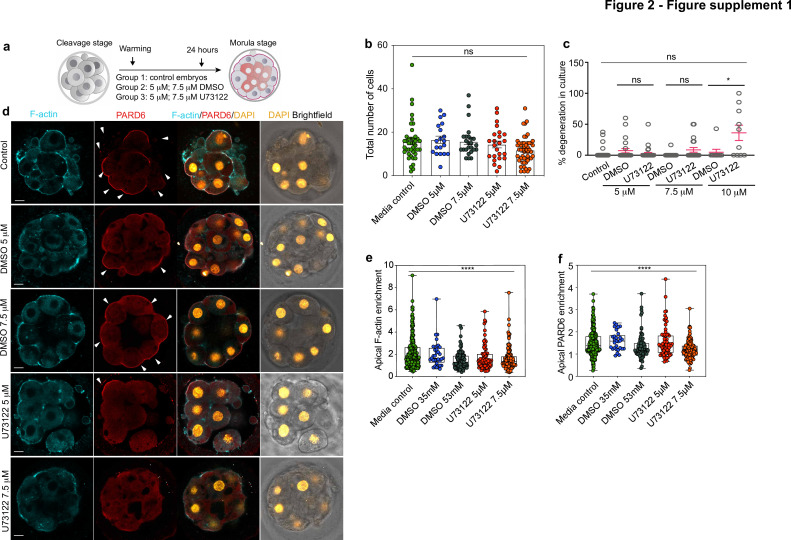
Figure 2—figure supplement 1. Morphokinetic analysis of the consequences of pharmacological inhibition of PLC.

Figure 2—figure supplement 1.

(a) Scheme of the PLC inhibitor treatment. (b) Quantification of the total number of cells in embryos from panel d. Each dot represents one embryo. N = 42 embryos for media control group, N = 19 embryos for DMSO 35 mM, N = 24 embryos for DMSO 53 mM, N = 25 embryos for U73122 5 µM (35 mM DMSO) and N = 24 embryos for U73122 7.5 µM (53 mM DMSO). Data are shown as mean ± S.E.M. ns: non-significant, Kruskal-Wallis test. None of the paired comparisons were statistically significant. (c) Percentage of degenerated cells in embryos from panel d. Each dot represents an individual embryo. Data are shown as mean ± S.D. N = 66 embryos (control), N = 23 embryos (DMSO 35 mM), N = 31 embryos (U73122 5 µM (DMSO 35 mM)), N = 20 embryos (DMSO 53 mM and U73122 7.5 µM (DMSO 53 mM)), N = 9 embryos (DMSO 70 mM) and N = 10 embryos (U73122 10 µM (DMSO 70 mM)). Kruskal-Wallis test with a multiple comparisons test. *p = 0.0355, ns: non-significant. (d) Representative images of in vitro fertilized human embryos warmed at day three and cultured for 24 hr (see scheme in panel a) with or without DMSO or U73122 to reveal the localization of F-actin and PARD6. Arrowheads indicate the apical domain. (e) Quantification of apical F-actin fluorescence intensity in embryos from panel d. Each dot represents one analyzed cell. N = 218 cells for Media control; N = 32 cells for DMSO 35 mM; N = 79 cells for DMSO 53 mM, N = 72 cells for U73122 5 µM and N = 126 cells for U73122 7.5 µM. ****p < 0.001, Kruskal-Wallis test with a multiple comparisons test. Individual paired comparisons: ***p = 0.0005 (Media control vs. DMSO 53 mM and Media control vs. U73122 7.5 µM), and *p = 0.0455 (Media control vs. U73122 5 µM). The rest of the comparisons were not statistically significant. (f) Quantification of apical PARD6 fluorescence intensity in embryos from panel d. N = 213 cells for Media control; N = 29 cells for DMSO 35 mM; N = 75 cells for DMSO 53 mM, N = 68 cells for U73122 5 µM and N = 126 cells for U73122 7.5 µM. Each dot represents one analyzed cell. ****p < 0.001, Kruskal-Wallis test with a multiple comparisons test. Individual paired comparisons: ****p < 0.0001 (Media control vs U73122 7.5 μM); ***p = 0.0001 (DMSO 35 mM vs. U73122 7.5 µM), and ***p = 0.0009 (U73122 5 µM vs. U73122 7.5 µM). The rest of the comparisons were not statistically significant. Scale bars, 15 µm.
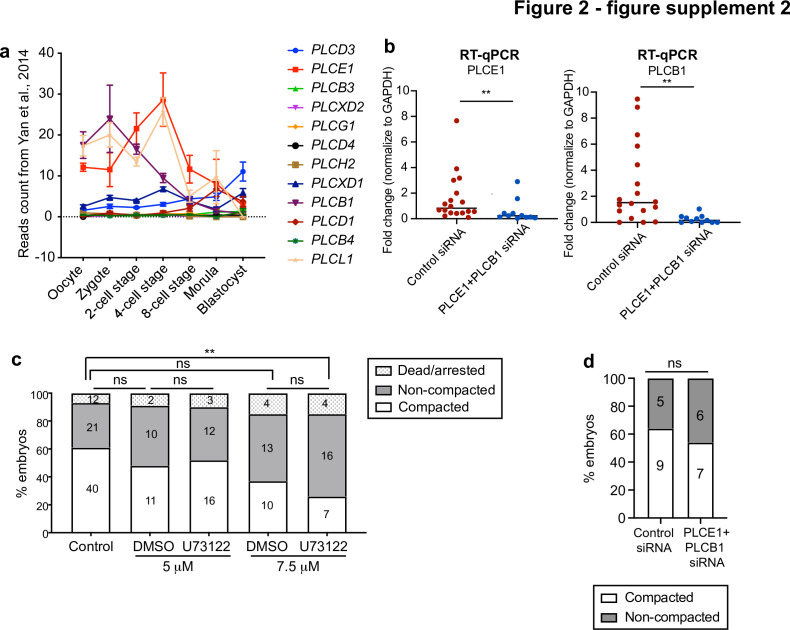
Figure 2—figure supplement 2. Morphokinetic analysis of PLC loss of function experiments.

Figure 2—figure supplement 2.

(a) Expression profile for all PLC isoforms at different stages of human preimplantation development. Data retrieved from Yan et al., 2013. (b) The expression level of PLCE1 and PLCB1 in human zygotes injected with control siRNA or PLCE1+ PLCB1 siRNA assessed by RT-qPCR; Data presented as mean with individual data points. Each data point represents one biological replicate. N = 18 control siRNA embryos, N = 11 PLCE1+ PLCB1 siRNA embryos. **p = 0.0062 for PLCE1 expression, **p = 0.0014 for PLCB1 expression. Mann-Whitney test. (c) Compaction analysis in control and PLC inhibitor-treated embryos. The number of embryos per category is indicated. Ns: non-significant, **p = 0.0099, ns: non-significant, Chi-squared test. (d) Compaction analysis in control siRNA and PLCE1+ PLCB1 siRNA-injected embryos. The number of embryos per category is indicated. ns: non-significant, Chi-squared test.