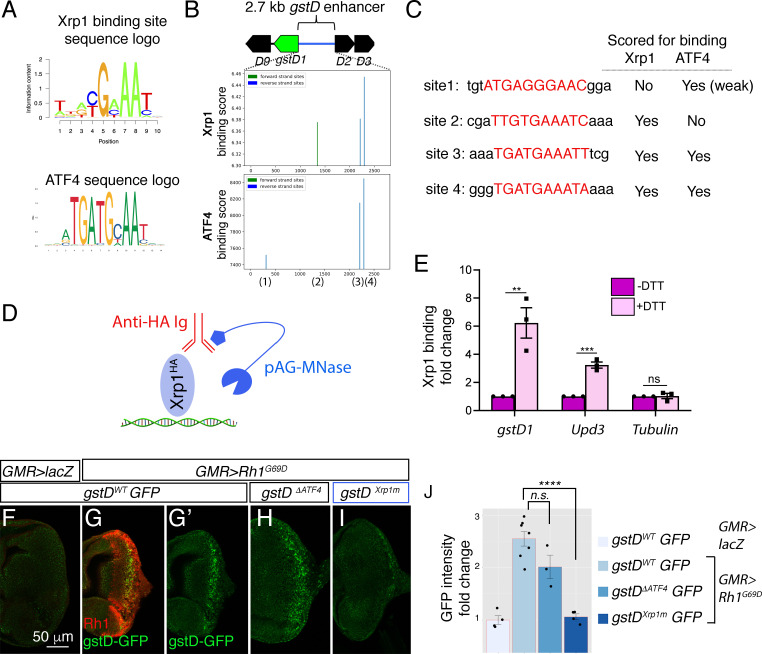
Figure 8. Xrp1 binding sites in the gstD enhancer are required for Rh1G69D -induced gstD-GFP expression.
(A) Sequence logos representing Xrp1 and ATF4 position frequency matrices. (B) Binding score analysis for Xrp1 and ATF4 sites in the gstD 2.7 kb enhancer region. Those that score high in the forward strand are depicted in green, whereas those in the reverse strand are shown in blue. The four putative binding sites are numbered below the graphs. (C) Putative binding site sequences. The site numbers match those whose positions are indicated in (B). (D) A schematic diagram of the CUT&RUN approach to assess Xrp1 binding to target DNA. When HA-tagged Xrp1 (light blue) binds to a specific DNA locus, that DNA can be recovered by adding anti-HA antibody (red) and pAG-MNase (dark blue) that cleaves adjacent DNA prior to immunoprecipitation. (E) Putative Xrp1 target gene enrichment after Xrp1HA protein pull down as assessed through q-PCR (using CUT&RUN). The y axis shows fold change increases in target gene DNA recovery in response to DTT treatment (normalized to q-PCR values from controls without DTT treatment). (F - J) Representative eye discs either expressing control lacZ (F) or those expressing GMR> Rh1G69D (G–I), with variants of the gstD-GFP reporter in green: gstD WT-GFP (F, G) gstD ΔATF4-GFP (H) and gstD Xrp1m-GFP (I). (G) shows a merged image with anti-Rh1 (red) and the gstD-GFP reporter (green). (G’, H, I) are gstD-GFP single channel images. (J) Quantification of gstD-GFP intensity fold change. Two tailed t tests were used to assess statistical significance. ** = p < 0.005, *** = p < 0.0005, **** = p < 0.00001, n.s. = not significant.

