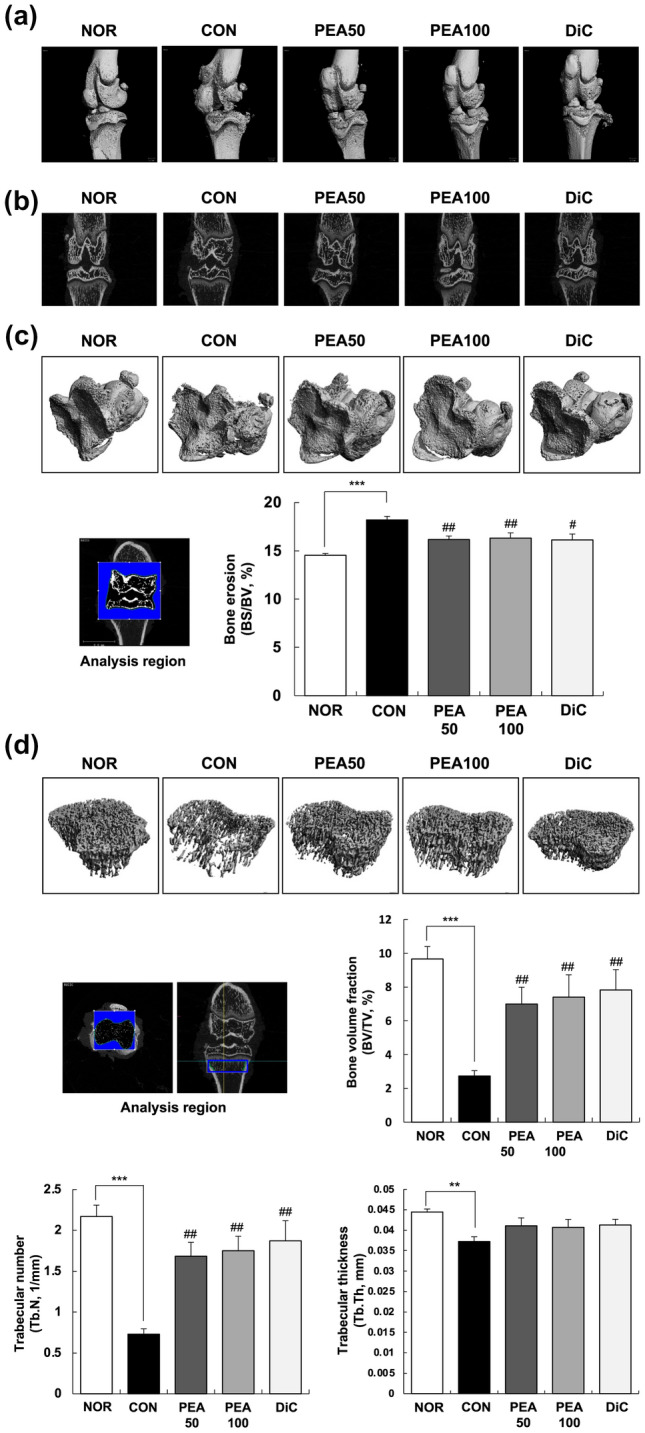
Fig. 1.

Effect of PEA on OA symptoms in MIA-induced OA rats. MIA-induced OA rats were administered either PEA (50 or 100 mg/kg BW/day) or diclofenac (6 mg/kg BW/day) for 4 weeks. The femorotibial joint was scanned, integrated into three-dimensional micro-CT images, and analyzed with a micro-CT scanner and built-in software. a Three-dimensional micro-CT images. b Two-dimensional micro-CT images. c Gray scale reconstructed image for quantitative analysis and BS/BV (%) of the subchondral bone in the femorotibial joint. d Gray scale reconstructed image for quantitative analysis, BV/TV (%), Tb.N (1/mm), and Tb.Th (mm) of the metaphysis of the tibia. Each bar represents mean ± SEM (n = 5). *P < 0.01, **P < 0.05, and ***P < 0.001 significantly different from the NOR group. #P < 0.01, ##P < 0.05, and ###P < 0.001 significantly different from the CON group. PEA palmitoylethanolamide, OA osteoarthritis, MIA monosodium iodoacetate, BW body weight, NOR normal control group (injected with saline + treated with phosphate-buffered saline (PBS)), CON control group (injected with MIA + treated with PBS), PEA50 or PEA100 50 or 100 mg/kg body weight (BW)/day PEA-treated group (injected with MIA + treated with 50 or 100 mg of PEA/kg BW/day), DiC positive control group (injected with MIA + treated with 6 mg of diclofenac/kg BW/day), micro-CT micro-computed tomography, BS/BV bone surface/bone volume, BV/TV bone volume/total volume, Tb.N trabecular number, Tb.Th trabecular thickness
