

Abstract
BACKGROUND AND AIMS:
NAFLD is increasing in prevalence and will soon be the most common chronic liver disease. Liver stiffness, as assessed by vibration-controlled transient elastography (VCTE), correlates with hepatic fibrosis, an important predictor of liver-related and all-cause mortality. Although liver fat is associated with cardiovascular risk factors, the association between hepatic fibrosis and cardiovascular risk factors is less clear.
APPROACH AND RESULTS:
We performed VCTE, assessing controlled attenuation parameter (CAP; measure of steatosis) and liver stiffness measurement (LSM) in 3,276 Framingham Heart Study adult participants (53.9% women, mean age 54.3 ± 9.1 years) presenting for a routine study visit. We performed multivariable-adjusted logistic regression models to determine the association between LSM and obesity-related, vascular-related, glucose-related, and cholesterol-related cardiovascular risk factors. The prevalence of hepatic steatosis (CAP ≥ 290 dB/m) was 28.8%, and 8.8% had hepatic fibrosis (LSM ≥ 8.2 kPa). Hepatic fibrosis was associated with multiple cardiovascular risk factors, including increased odds of obesity (OR, 1.82; 95% CI, 1.35–2.47), metabolic syndrome (OR, 1.49; 95% CI 1.10–2.01), diabetes (OR, 2.67; 95% CI, 1.21–3.75), hypertension (OR, 1.52; 95% CI, 1.15–1.99), and low high-density lipoprotein cholesterol (OR, 1.47; 95% CI, 1.09–1.98), after adjustment for age, sex, smoking status, alcohol drinks/week, physical activity index, aminotransferases, and CAP.
CONCLUSIONS:
In our community-based cohort, VCTE-defined hepatic fibrosis was associated with multiple cardiovascular risk factors, including obesity, metabolic syndrome, diabetes, hypertension, and high-density lipoprotein cholesterol, even after accounting for covariates and CAP. Additional longitudinal studies are needed to determine if hepatic fibrosis contributes to incident cardiovascular disease risk factors or events. (Hepatology 2021;0:1–12).
With the increasing prevalence of obesity, NAFLD has emerged as an important public health problem.(1) In particular, individuals with NAFLD and hepatic fibrosis are at greatest risk for liver-related complications and death.(2–4) NAFLD-related cirrhosis is the most rapidly growing indication for liver transplant in the United States.(5) Although the population prevalence of NAFLD is high, only a minority of individuals develop liver-related events or death.(6) Cardiovascular disease remains the leading cause of morbidity and mortality among patients with NAFLD.(7) Numerous studies have identified associations between NAFLD and cardiovascular disease risk factors, including obesity, hypertension, dyslipidemia, diabetes, and metabolic syndrome.(6,8–11) However, our understanding of cardiometabolic risk in NAFLD is incomplete, with limited data describing the association between NAFLD-associated fibrosis and cardiometabolic risk or accounting for the influence of body mass index (BMI) or hepatic steatosis. This limitation is driven in part by the small number of studies which, outside of select populations, have elucidated the community prevalence of and risk factors for NAFLD-associated fibrosis.(12,13)
Thus, we aimed to identify the prevalence and risk factors associated with hepatic fibrosis, as measured by vibration-controlled transient elastography (VCTE) in the Framingham Heart Study (FHS), a large, unselected, community-based, longitudinal cohort of middle-aged and older adults. We hypothesized that VCTE-defined hepatic fibrosis is associated with higher cardiovascular risk factors, even after accounting for confounding factors, including BMI and hepatic steatosis.
Participants and Methods
STUDY DESIGN AND POPULATION
The study sample was drawn from FHS Third Generation and OMNI 2 cohort participants who took part in an ancillary study to evaluate liver fat and fibrosis using VCTE between April 2016 and March 2019. The details of the FHS Third Generation and OMNI 2 cohorts have been published in detail.(14) All participants, with the exception of pregnant participants, those with overt ascites, or those with implanted medical devices, who presented to the research center were offered VCTE examination (n = 3,276). Each participant completed an interview with a medical provider, a VCTE examination, a fasting blood collection, and anthropometric assessment. One hundred and eight participants were missing fasting glucose, so the sample size was slightly different for the fasting glucose analyses (n = 3,168). The study was approved by the Boston University Medical Center Institutional Review Board, and all participants provided written informed consent. The study protocol conformed to the ethical guidelines of the 1975 Declaration of Helsinki as reflected in a priori approval by the institutional review board.
VCTE Measurements
We used VCTE (Fibroscan; Echosens, Paris, France) performed by a certified operator to obtain measurements of liver fat (controlled attenuation parameter [CAP]) and liver fibrosis (liver stiffness measurement [LSM]). Participants fasted for >3 hours before examination. Each participant was placed in the supine position with the right arm in maximal abduction and the skin exposed in the right upper quadrant. The VCTE probe was positioned in the intercostal space over the right lobe of the liver. For all examinations, the M probe was applied first; however, the operator switched to the XL probe if needed based on the recommendations of the device and the manufacturer’s instructions. The operator obtained a minimum of 10 measurements from each participant, and the device calculated the median CAP and LSM values along with the interquartile range. All studies were read over by a qualified hepatologist (M.T.L.) to ensure quality. We excluded examinations from analysis if they were poorly reliable, which was defined as an interquartile range/median ratio >0.30 when the median LSM is ≥7.1 kPa.(15) We chose the cutoff values of LSM ≥ 8.2 kPa and LSM ≥ 13.6 kPa for clinically significant fibrosis and cirrhosis, respectively, based on other studies.(13,16–20) For CAP, we chose the cutoff of CAP ≥ 290 dB/m for any hepatic steatosis and CAP ≥ 302 dB/m for severe hepatic steatosis, as in prior studies.(19,21,22) Participants with CAP ≥ 290 dB/m but LSM < 8.2 kPa were considered to have hepatic steatosis without advanced fibrosis, and those with CAP < 290 dB/m and LSM < 8.2 kPa were considered to have neither hepatic steatosis or advanced fibrosis.
Covariates
We assessed all covariates on the same day as the VCTE examination. Trained research staff obtained measurements of height and weight for the calculation of the BMI, defined as weight (kg) divided by height (m2). We considered a participant a current smoker if they had smoked at least one cigarette per day in the year preceding the FHS examination and a former smoker if they reported past, but not current, smoking. We assessed alcohol use in total drinks/week and medication use through a series of clinician-administered questions. We calculated the physical activity index based on the response to a questionnaire on the average daily number of hours of sleep and sedentary, light, moderate, and heavy activity of the participant.(23)
Cardiometabolic Risk Factors
We measured all cardiometabolic traits on the same day as the VCTE examination. We drew all blood measures, including glucose, glycosylated hemoglobin (hgbA1c), total cholesterol, HDL cholesterol, triglyceride levels, alanine aminotransferase (ALT), and aspartate aminotransferase (AST), from fasting morning blood samples. Elevated ALT or AST were defined as ALT or AST ≥19 U/L for women or ≥30 U/L for men. Obesity was defined as BMI ≥ 30 kg/m2. Trained technicians measured participant’s waist circumference at the level of the umbilicus. Metabolic syndrome was defined by the Expert Panel on Detection, Evaluation, and Treatment of High Blood Cholesterol in Adults, as having 3 or more of the following characteristics: abdominal obesity, defined as waist circumference greater >35 inches for women or >40 inches for men, triglycerides ≥150 mg/dL, HDL cholesterol <50 mg/dL for women and <40 mg/dL for men, systolic blood pressure (SBP) ≥130 mm Hg or diastolic blood pressure (DBP) ≥85 mm Hg, or fasting glucose ≥100 mg/dL.(24) Impaired fasting glucose was defined as fasting glucose 100 to 125 mg/dL or hgbA1c ≥5.7% and <6.5% in the absence of hypoglycemic medications. Diabetes mellitus was defined as fasting glucose ≥126 mg/dL, hgbA1c ≥6.5%, or use of hypoglycemic medications, including insulin. Systolic and diastolic blood pressures were calculated as the average of two blood pressure measurements obtained in the upright position after a minimum rest of 5 minutes. Hypertension was defined as SBP ≥130 mm Hg, DBP ≥85 mm Hg, or treatment with antihypertensive medication. For cholesterol-related traits, we defined dyslipidemia as total cholesterol ≥240 mg/dL or use of lipid-lowering therapy, low HDL cholesterol as HDL < 50 mg/dL for women or HDL <40 mg/dL for men, and elevated triglyceride levels as triglyceride levels ≥150 mg/dL.
STATISTICAL ANALYSIS
We evaluated the exposures and dependent variables for normality and log-transform skewed distributions (LSM, ALT, AST, hgbA1c, and triglyceride levels). We calculated sex-specific, age-adjusted, Pearson’s correlation coefficient between log-LSM and continuous cardiometabolic traits. We examined the association between LSM ≥8.2 kPa (primary exposure) and log-LSM as a continuous exposure or LSM >13.6 kPa (secondary exposures) with continuous and dichotomous cardiometabolic traits using linear or logistic regression analyses, respectively. When continuous log-LSM was the exposure, all models are expressed per 1 unit increase in log-LSM. Models were adjusted for age, sex, smoking status, alcoholic drinks/week, physical activity index, use of lipid-lowering medications (for total cholesterol model), use of antihypertensive therapy (for SBP and DBP model), and use of diabetes treatments (for glucose model). We included additional models adding adjustment for BMI (for all models except when BMI or obesity was the dependent variable) or CAP (for all models except when CAP was the dependent variable) to the multivariable model. We tested for interaction with age, sex, BMI, and diabetes. We performed prespecified sensitivity analyses. We repeated the aforementioned analyses using probe-specific cutoffs (1 point lower if XL probe was used), using LSM ≥ 9.7 kPa as the cutoff for clinically significant fibrosis, or adding adjustment for ALT and AST (in models when ALT or AST was not the outcome value). Lastly, we conducted a subgroup analysis by repeating the models after restricting the sample to participants without a history of liver disease (other than NAFLD) or heavy alcohol use, defined as >14 drinks/week for women or >21 drinks/week for men.(25) The level of significance was set to a two-sided P value of 0.05, and dedicated software was used for all analyses (R v3.5.3).
Results
STUDY SAMPLE CHARACTERISTICS
The characteristics of the study sample, by hepatic steatosis and fibrosis status, are presented in Table 1. Overall, 53.9% of the study sample were women, and the mean ± SD age was 54.3 ± 9.1 years. The average BMI was 28.3 ± 5.6 kg/m2, and 32.3% of the sample was obese. A total of 977 participants (28.8%) had hepatic steatosis, regardless of fibrosis stage, and 23.7% overall had hepatic steatosis without advanced fibrosis (CAP ≥ 290 dB/m and LSM < 8.2 kPa). A total of 289 participants, 8.8% of the sample, had LSM ≥ 8.2 kPa consistent with clinically significant fibrosis, and 54 individuals (1.6%) had LSM > 13.6 kPa, consistent with cirrhosis. The prevalence of hepatic fibrosis was 15.7% among participants with obesity and 27.5% among participants with diabetes (Fig. 1).
TABLE 1.
Study Sample Characteristics
| Overall Sample, n = 3,276 | |
|---|---|
| Age (years) | 54.3 (9.1) |
| Women (%) | 1,766 (53.9%) |
| Ethnicity | |
| White (%) | 3,001 (91.6%) |
| Black (%) | 71 (2.2%) |
| Asian (%) | 79 (2.4%) |
| Other (%) | 125 (3.8%) |
| Smoking | |
| Former (%) | 100 (3.1%) |
| Current (%) | 222 (6.8%) |
| Alcohol (drinks/week) | 5.1 (7.0) |
| Physical activity index | 614 (362) |
| XL probe (%) | 776 (23.7%) |
| Obesity/liver related | |
| BMI (kg/m2) | 28.3 (5.6) |
| Obesity (BMI ≥ 30 kg/m2) (%) | 1,057 (32.3%) |
| Waist circumference (cm) | 39.0 (5.8) |
| CAP (dB/m) | 260 (56) |
| Hepatic steatosis(CAP ≥ 290 dB/m) | 944 (28.8%) |
| Severe hepatic steatosis(CAP ≥ 302 dB/m) | 760 (23.2%) |
| ALT (IU/L)* | 21 (13) |
| AST (IU/L)* | 21 (8) |
| Elevated ALT or AST (%) | 1,795 (54.8%) |
| Metabolic syndrome (%) | 865 (26.4%) |
| LSM (kPa)* | 5.1 (2.1) |
| LSM > 13.6 kPa | 54 (1.6%) |
| LSM ≥ 9.7 kPa | 163 (5.0%) |
| LSM ≥ 8.2 kPa | 289 (8.8%) |
| Glucose-related | |
| Fasting glucose (mg/dL) (n = 3,168) | 100.0 (21.2) |
| HgbA1c (%)* | 5.3 (0.4) |
| Diabetes (%) | 284 (8.7%) |
| Impaired fasting glucose (%) | 1,049 (32%) |
| Vascular-related | |
| SBP (mm Hg) | 120 (14) |
| DBP (mm Hg) | 76 (9) |
| Hypertension (%) | 977 (29.8%) |
| Cholesterol-related | |
| Total cholesterol (mg/dL) | 190 (36) |
| HDL cholesterol (mg/dL) | 60 (19) |
| Triglyceride levels (mg/dL)* | 92 (67) |
| Dyslipidemia (%) | 1,005 (30.7%) |
| High triglycerides (%) | 619 (18.9%) |
| Low HDL cholesterol (%) | 651 (19.9%) |
Continuous variables are expressed as mean (SD) and categorical variables as n (%).
Presented as median (interquartile range).
FIG. 1.
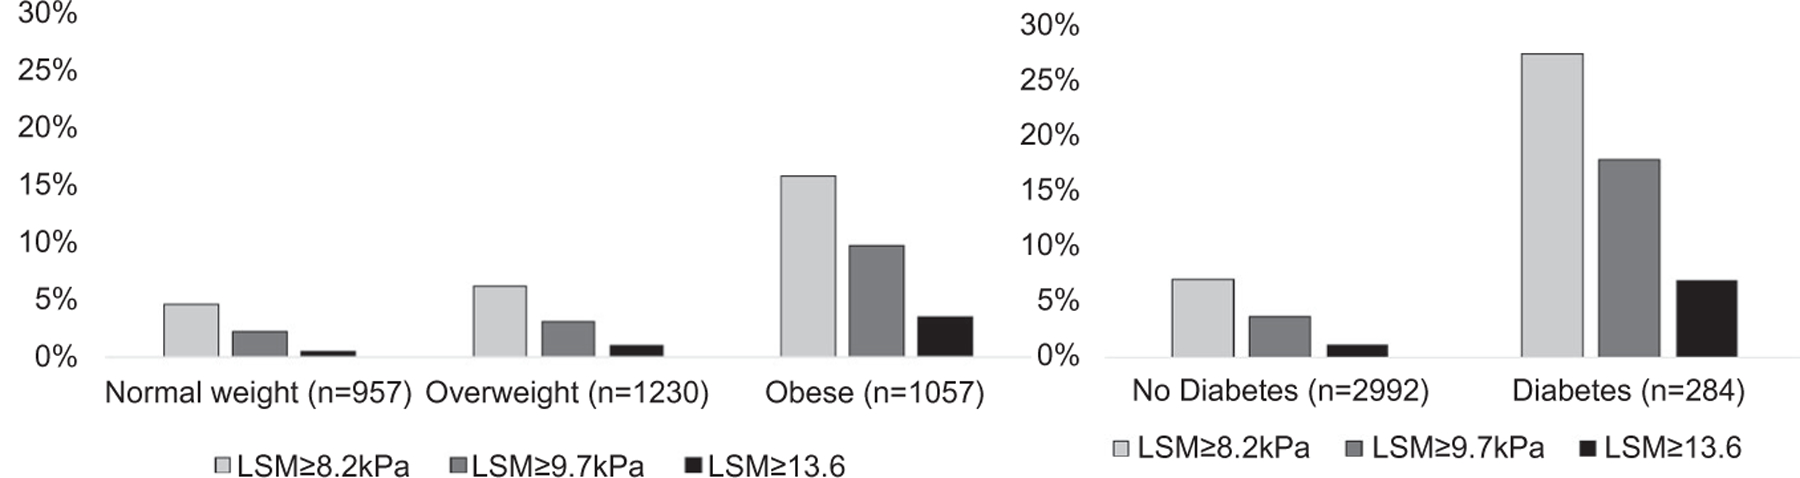
Prevalence of hepatic fibrosis in FHS participants by BMI category or diabetes status. We stratified the sample by BMI category (25 kg/m2 > normal weight BMI ≥ 18.5 kg/m2, 30 kg/m2 > overweight BMI ≥ 25 kg/m2, obese BMI ≥ 30 kg/m2) or by diabetes status. The proportion of participants with hepatic fibrosis (defined by LSM ≥8.2 or ≥9.7 or >13.6 kPa) was higher as the BMI category increased and among participants with diabetes.
CORRELATIONS BETWEEN HEPATIC FIBROSIS AND CARDIOMETABOLIC TRAITS
Hepatic fibrosis, as measured by LSM, demonstrated low-to-moderate correlations with all cardiometabolic variables (Table 2). Higher LSM correlated with higher BMI, waist circumference, CAP, log-ALT, log-AST, fasting glucose, log-hgbA1c, SBP, DBP, and log-triglycerides and lower total cholesterol and HDL cholesterol (P < 0.01 for all). We also observed moderate correlations between BMI and CAP in women and men (0.611 for women, 0.594 for men, 0.610 overall; P < 0.001 for all).
TABLE 2.
Sex-Specific Pearson’s Correlation Coefficients Between Log-LSM and Continuous Traits
| Women |
Men |
Overall Sample |
|
|---|---|---|---|
| Traits | Correlation, P Value | Correlation, P Value | Correlation, P Value |
| Obesity/liver related | |||
| BMI (kg/m2) | 0.216, P < 0.0001 | 0.199, P < 0.0001 | 0.208, P < 0.0001 |
| Waist circumference (cm) | 0.209, P < 0.0001 | 0.190, P < 0.0001 | 0.210, P < 0.0001 |
| CAP (dB/m) | 0.182, P < 0.0001 | 0.162, P < 0.0001 | 0.183, P < 0.0001 |
| Log-ALT (IU/L) | 0.167, P < 0.0001 | 0.255, P < 0.0001 | 0.239, P < 0.0001 |
| Log-AST (IU/L) | 0.172, P < 0.0001 | 0.371, P < 0.0001 | 0.313, P < 0.0001 |
| Glucose-related | |||
| Fasting glucose (mg/dL) | 0.127, P < 0.0001 | 0.145, P < 0.0001 | 0.155, P < 0.0001 |
| Log hgbA1c (%) | 0.257, P < 0.0001 | 0.124, P < 0.0001 | 0.181, P < 0.0001 |
| Vascular-related | |||
| SBP (mm Hg) | 0.113, P < 0.0001 | 0.079, P = 0.002 | 0.109, P < 0.0001 |
| DBP (mm Hg) | 0.034, P = 0.16 | 0.015, P = 0.58 | 0.047, P = 0.007 |
| Cholesterol-related | |||
| Total cholesterol (mg/dL) | −0.055, P = 0.02 | −0.045, P = 0.08 | −0.065, P = 0.002 |
| HDL cholesterol (mg/dL) | −0.141, P < 0.0001 | −0.084, P = 0.001 | −0.139, P < 0.0001 |
| Log-triglycerides (mg/dL) | 0.179, P < 0.0001 | 0.081, P = 0.002 | 0.128, P < 0.0001 |
MULTIVARIABLE-ADJUSTED ASSOCIATIONS BETWEEN HEPATIC FIBROSIS AND CONTINUOUS CARDIOMETABOLIC RISK FACTORS
Hepatic fibrosis (as both a continuous and dichotomous measure) was significantly associated with all obesity-related, liver-related, glucose-related, vascular-related, and cholesterol-related continuous cardiometabolic traits (Table 3). Hepatic fibrosis (LSM ≥ 8.2) was associated with higher BMI, higher waist circumference, higher CAP, higher log-ALT and log-AST, higher fasting glucose, higher log-hgbA1c, higher SBP and DBP, higher log-triglycerides, lower total cholesterol, and lower HDL cholesterol compared with those without hepatic fibrosis. After additionally adjusting for BMI or CAP, most of the associations with hepatic fibrosis were attenuated; however, for total cholesterol, the negative association with hepatic fibrosis was stronger after additionally adjusting for BMI or CAP. Hepatic fibrosis (LSM ≥ 8.2) was no longer associated with DBP or log-triglycerides in CAP-adjusted models.
TABLE 3.
Multivariable-Adjusted Linear Regression Models for LSM and Continuous Traits
| Dichotomous Liver Fibrosis (LSM ≥ 8.2 kPa vs. LSM < 8.2 kPa) |
Continuous Log-LSM (Per Unit Increase) |
||||||
|---|---|---|---|---|---|---|---|
| Trait | Model | β | 95% CI | P Value | β | 95% CI | P Value |
| Obesity/liver related | |||||||
| BMI (kg/m2) | MV | 3.893 | (3.240, 4.545) | <0.0001 | 4.013 | (3.496, 4.530) | <0.0001 |
| MV + CAP | 1.693 | (1.156, 2.230) | <0.0001 | 1.705 | (1.268, 2.141) | <0.0001 | |
| Waist circumference (cm) | MV | 3.821 | (3.166, 4.475) | <0.0001 | 3.785 | (3.265, 4.305) | <0.0001 |
| MV + BMI | 0.247 | (−0.021, 0.516) | 0.07 | 0.097 | (−0.121, 0.316) | 0.38 | |
| MV + CAP | 1.563 | (1.031, 2.095) | <0.0001 | 1.401 | (0.967, 1.834) | <0.0001 | |
| CAP (dB/m) | MV | 36.771 | (30.337, 43.206) | <0.0001 | 39.327 | (34.237, 44.418) | <0.0001 |
| MV + BMI | 14.142 | (8.837, 19.447) | <0.0001 | 16.507 | (12.206, 20.807) | <0.0001 | |
| Log-ALT (IU/L) | MV | 0.221 | (0.170, 0.271) | <0.0001 | 0.280 | (0.240, 0.320) | <0.0001 |
| MV + BMI | 0.157 | (0.106, 0.207) | <0.0001 | 0.223 | (0.182, 0.263) | <0.0001 | |
| MV + CAP | 0.133 | (0.084, 0.182) | <0.0001 | 0.194 | (0.155, 0.234) | <0.0001 | |
| Log-AST (IU/L) | MV | 0.154 | (0.118, 0.189) | <0.0001 | 0.182 | (0.153, 0.210) | <0.0001 |
| MV + BMI | 0.163 | (0.127, 0.199) | <0.0001 | 0.198 | (0.169, 0.227) | <0.0001 | |
| MV + CAP | 0.141 | (0.105, 0.177) | <0.0001 | 0.174 | (0.145, 0.203) | <0.0001 | |
| Glucose-related | |||||||
| Fasting glucose (mg/dL) (n = 3,168) | MV | 8.794 | (6.581, 11.006) | <0.0001 | 7.410 | (5.639, 9.180) | <0.0001 |
| MV + BMI | 6.296 | (4.098, 8.493) | <0.0001 | 4.831 | (3.047, 6.614) | <0.0001 | |
| MV + CAP | 5.944 | (3.774, 8.114) | <0.0001 | 4.324 | (2.560, 6.087) | <0.0001 | |
| Log hgbA1c (%) | MV | 0.032 | (0.022, 0.043) | <0.0001 | 0.032 | (0.023, 0.040) | <0.0001 |
| MV + BMI | 0.019 | (0.009, 0.030) | 0.0003 | 0.018 | (0.010, 0.027) | <0.0001 | |
| MV + CAP | 0.018 | (0.008, 0.029) | 0.0006 | 0.016 | (0.008, 0.025) | <0.0001 | |
| Vascular-related | |||||||
| SBP (mm Hg) | MV | 3.783 | (2.215, 5.352) | <0.0001 | 4.133 | (2.871, 5.395) | <0.0001 |
| MV + BMI | 2.096 | (0.534, 3.658) | 0.009 | 2.451 | (1.178, 3.723) | 0.0002 | |
| MV + CAP | 2.205 | (0.642, 3.768) | 0.006 | 2.495 | (1.220, 3.771) | 0.0001 | |
| DBP (mm Hg) | MV | 1.007 | (0.07, 2.007) | 0.05 | 1.296 | (0.490, 2.102) | 0.002 |
| MV + BMI | −0.071 | (−1.067, 0.924) | 0.89 | 0.196 | (−0.616, 1.008) | 0.64 | |
| MV + CAP | −0.012 | (−1.009, 0.984) | 0.98 | 0.209 | (−0.604, 1.023) | 0.61 | |
| Cholesterol-related | |||||||
| Total cholesterol (mg/dL) | MV | −7.011 | (−11.095, −2.928) | 0.0008 | −4.934 | (−8.216, −1.652) | 0.003 |
| MV + BMI | −7.273 | (−11.435, −3.111) | 0.0006 | −5.252 | (−8.642, −1.862) | 0.002 | |
| MV + CAP | −8.850 | (−12.994, −4.706) | <0.0001 | −7.022 | (−10.401, −3.643) | <0.0001 | |
| HDL cholesterol (mg/dL) | MV | −6.131 | (−8.162, −4.099) | <0.0001 | −6.558 | (−8.183, −4.933) | <0.0001 |
| MV + BMI | −1.578 | (−3.500, 0.344) | 0.11 | −1.927 | (−3.491, −0.363) | 0.02 | |
| MV + CAP | −2.020 | (−3.957, −0.084) | 0.04 | −2.229 | (−3.807, −0.651) | 0.006 | |
| Log-triglycerides (mg/dL) | MV | 0.223 | (0.104, 0.222) | <0.0001 | 0.206 | (0.160, 0.253) | <0.0001 |
| MV + BMI | 0.087 | (−0.013, 0.100) | 0.13 | 0.088 | (0.042, 0.133) | 0.0002 | |
| MV + CAP | 0.053 | (−0.031, 0.078) | 0.41 | 0.060 | (0.015, 0.104) | 0.009 | |
Abbreviation: MV, multivariable.
MULTIVARIABLE-ADJUSTED ASSOCIATIONS BETWEEN HEPATIC FIBROSIS AND DICHOTOMOUS CARDIOMETABOLIC RISK FACTORS
Hepatic fibrosis (as both a continuous and dichotomous measure) was significantly associated with all dichotomous obesity-related and liver-related traits (Table 4; Fig. 2). Participants with hepatic fibrosis (LSM ≥ 8.2 kPa) had about 3 times the odds of obesity (OR, 3.11; 95% CI, 2.42–4.00), hepatic steatosis (OR, 3.66; 95% CI, 2.84–4.71), severe hepatic steatosis (OR, 3.43; 95% CI, 2.67–4.41), and metabolic syndrome (OR, 2.80; 95% CI, 2.17–3.61) compared with those with LSM < 8.2 kPa. Adjustment for CAP or BMI attenuated the effects; however, LSM ≥ 8.2 kPa continued to be significantly associated with 1.5–2 times increased odds of the obesity-related and liver disease–related traits (Fig. 2).
TABLE 4.
Multivariable-Adjusted Logistic Regression Models for LSM and Dichotomous Traits
| Dichotomous Liver Fibrosis (LSM ≥ 8.2 kPa vs. LSM < 8.2 kPa) |
Continuous Log-LSM (Per Unit Increase) |
||||||
|---|---|---|---|---|---|---|---|
| Model | OR | 95% CI | P Value | OR | 95% CI | P Value | |
| Obesity/liver related | |||||||
| Obesity (BMI ≥ 30 kg/m2) | MV | 3.11 | (2.42, 4.00) | <0.0001 | 4.36 | (3.45, 5.49) | <0.0001 |
| MV + CAP | 1.82 | (1.35, 2.47) | 0.0001 | 2.39 | (1.84, 3.10) | <0.0001 | |
| Hepatic steatosis (CAP ≥ 290 dB/m) | MV | 3.66 | (2.84, 4.71) | <0.0001 | 4.70 | (3.70, 5.97) | <0.0001 |
| MV + BMI | 2.19 | (1.60, 2.99) | <0.0001 | 2.42 | (1.85, 3.19) | 0.001 | |
| Severe hepatic steatosis (CAP ≥ 302 dB/m) | MV | 3.43 | (2.67, 4.41) | <0.0001 | 6.05 | (4.57, 8.00) | <0.0001 |
| MV + BMI | 1.87 | (1.37, 2.55) | 0.0001 | 2.97 | (2.18, 4.04) | <0.0001 | |
| Elevated ALT or AST | MV | 1.93 | (1.48, 2.53) | <0.0001 | 2.43 | (1.95, 3.03) | <0.0001 |
| MV + BMI | 1.72 | (1.31, 2.26) | 0.0001 | 2.20 | (1.76, 2.76) | <0.0001 | |
| MV + CAP | 1.56 | (1.19, 2.06) | 0.001 | 1.97 | (1.57, 2.46) | <0.0001 | |
| Metabolic syndrome | MV | 2.80 | (2.17, 3.61) | <0.0001 | 4.08 | (3.20, 5.20) | <0.0001 |
| MV + BMI | 1.46 | (1.08, 1.99) | 0.01 | 2.04 | (1.56, 2.67) | 0.0007 | |
| MV + CAP | 1.49 | (1.10, 2.01) | 0.009 | 2.11 | (1.61, 2.76) | 0.0001 | |
| Glucose-related | |||||||
| Diabetes | MV | 4.48 | (3.27, 6.13) | <0.0001 | 5.06 | (3.66, 7.00) | <0.0001 |
| MV + BMI | 2.65 | (1.88, 3.72) | <0.0001 | 3.02 | (2.15, 4.24) | 0.0001 | |
| MV + CAP | 2.67 | (1.91, 3.75) | <0.0001 | 3.06 | (2.18, 4.30) | <0.0001 | |
| Impaired fasting glucose (n = 2,992) | MV | 1.54 | (1.14, 2.07) | 0.005 | 1.87 | (1.46, 2.38) | <0.0001 |
| MV + BMI | 1.06 | (0.77, 1.47) | 0.72 | 1.25 | (0.97, 1.62) | 0.09 | |
| MV + CAP | 1.06 | (0.77, 1.47) | 0.72 | 1.27 | (0.98, 1.65) | 0.07 | |
| Vascular-related | |||||||
| Hypertension | MV | 2.11 | (1.63, 2.74) | <0.0001 | 2.56 | (2.04, 3.23) | <0.0001 |
| MV + BMI | 1.39 | (1.05, 1.84) | 0.02 | 1.67 | (1.31, 2.12) | <0.0001 | |
| MV + CAP | 1.52 | (1.15, 1.99) | 0.003 | 1.83 | (1.44, 2.32) | <0.0001 | |
| Cholesterol-related | |||||||
| Dyslipidemia | MV | 1.32 | (1.01, 1.72) | 0.02 | 1.40 | (1.12, 1.75) | 0.003 |
| MV + BMI | 1.05 | (0.79, 1.38) | 0.74 | 1.11 | (0.88, 1.40) | 0.40 | |
| MV + CAP | 1.12 | (0.85, 1.47) | 0.41 | 1.18 | (0.94, 1.49) | 0.16 | |
| Low HDL cholesterol | MV | 2.39 | (1.82, 3.13) | <0.0001 | 2.83 | (2.22, 3.61) | <0.0001 |
| MV + BMI | 1.54 | (1.14, 2.06) | 0.004 | 1.84 | (1.42, 2.39) | 0.0002 | |
| MV + CAP | 1.47 | (1.09, 1.98) | 0.01 | 1.74 | (1.34, 2.25) | 0.002 | |
| High triglycerides | MV | 1.88 | (1.43, 2.47) | <0.0001 | 2.35 | (1.85, 2.99) | <0.0001 |
| MV + BMI | 1.19 | (0.89, 1.61) | 0.24 | 1.51 | (1.17, 1.95) | 0.002 | |
| MV + CAP | 1.06 | (0.78, 1.44) | 0.70 | 1.32 | (1.01, 1.72) | 0.40 | |
Abbreviation: MV, multivariable.
FIG. 2.
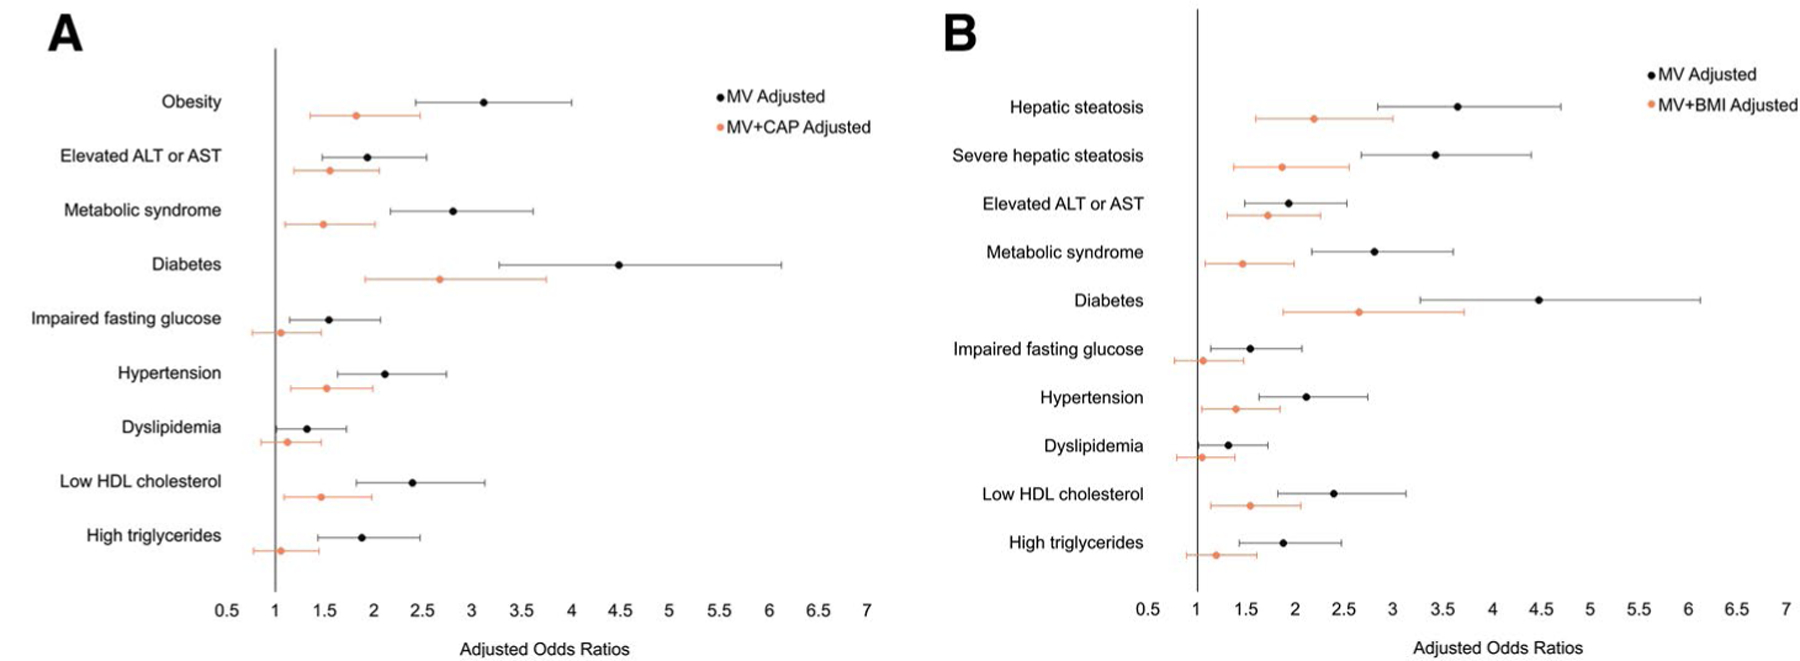
Multivariable-adjusted ORs for the association between hepatic fibrosis (LSM ≥ 8.2 kPa) and dichotomous cardiometabolic risk factors. After additionally adjusting the multivariable models for (A) hepatic steatosis (CAP) or (B) general adiposity (BMI), the associations between hepatic fibrosis and cardiometabolic risk factors were attenuated but remained significantly associated with multiple obesity-related, glucose-related, vascular-related, and cholesterol-related traits. MV, multivariable.
Similarly, for diabetes, participants with hepatic fibrosis demonstrated 4.48 times increased odds of diabetes (95% CI, 3.27–6.13) in the multivariable model and, after accounting for CAP, the association was attenuated but remained strong, with an OR of 2.67 (95% CI, 1.91–3.75) (Table 4; Fig. 2). Additionally, participants with hepatic fibrosis had over 2 times the odds of hypertension (OR, 2.11; 95% CI, 1.63–2.74) and low HDL cholesterol (OR, 2.39; 95% CI, 1.82–3.13); these associations were also attenuated but remained statistically significant after CAP adjustment. The associations between hepatic fibrosis and impaired fasting glucose, dyslipidemia, and high triglyceride levels were no longer significant after adding adjustment for CAP to the multivariable model.
MULTIVARIABLE-ADJUSTED ASSOCIATIONS BETWEEN HEPATIC FIBROSIS AND CONTINUOUS AND DICHOTOMOUS CARDIOMETABOLIC RISK FACTORS USING DIFFERENT LSM CUTOFFS OR ADJUSTING FOR ALT AND AST
Overall, when using the more stringent cutoff for clinically significant fibrosis of LSM ≥ 9.7 kPa (vs. LSM ≥ 8.2 kPa), we observed stronger associations between hepatic fibrosis and both continuous and dichotomous cardiometabolic traits in a similar pattern as with the lower LSM threshold (Supporting Tables S1 and S2); however, after additionally adjusting for CAP, LSM ≥ 9.7 kPa was no longer associated with SBP or hypertension.
Cirrhosis (LSM > 13.6 kPa) was associated with multiple obesity-related, liver-related, and glucose-related traits, even after multivariable and CAP adjustment, in an exploratory analysis. Cirrhosis was associated with a higher BMI (β, 2.432; 95% CI, 1.251–3.613), higher waist circumference (β, 2.632; 95% CI, 1.465–3.800), higher log-ALT (β, 0.371; 95% CI, 0.264–0.478), higher log-AST (β, 0.469; 95% CI, 0.391 −0.547), higher fasting glucose (β, 12.521; 95% CI, 7.795 −17.247), and higher log-hgbA1c (β, 0.060; 95% CI, 0.037–0.084) in multivariable and CAP -adjusted models (Supporting Table S1). Cirrhosis was also associated with obesity (OR, 2.64; 95% CI, 1.26–5.59), severe hepatic steatosis (OR, 2.16; 95% CI, 1.09 −4.28), elevated ALT or AST (OR, 3.14; 95% CI, 1.59–6.19), and diabetes (OR, 3.06; 95% CI, 1.60–5.88) in maximally adjusted models (Supporting Table S2). The associates between cirrhosis and vascular-related and cholesterol-related traits were not significant in maximally adjusted models.
We also reran the models using a probe-specific cutoff such that the threshold for clinically significant fibrosis was LSM ≥ 7.2 kPa when the XL probe was used and LSM ≥ 8.2 kPa when the M probe was used or adding adjustment for ALT and AST to the multivariable models. Overall, the results were not significantly changed (Supporting Tables S3-S6).
MULTIVARIABLE-ADJUSTED ASSOCIATIONS BETWEEN HEPATIC FIBROSIS AND CONTINUOUS AND DICHOTOMOUS CARDIOMETABOLIC RISK FACTORS AFTER EXCLUDING HEAVY ALCOHOL USE
Because of our interest in NAFLD and the potential confounding effects of alcohol on LSM, we per-formed a subgroup analysis to exclude participants with a history of non-NAFLD-related liver disease or heavy alcohol use, which resulted in excluding n = 161 participants from the analyses and n = 176 participants from the fasting glucose analysis. Results were essentially unchanged compared with the primary analysis (Supporting Tables S7 and S8).
Discussion
In this large community-based sample of middle-aged and older adults unselected for liver disease, we observed that 8.8% of participants, a substantial minority, exceeded the threshold of potentially clinically significant hepatic fibrosis, defined by LSM ≥ 8.2 kPa. Hepatic fibrosis was associated with multiple obesity-related, glucose-related, vascular-related, and cholesterol-related traits; however, most associations were confounded, at least in part, by general adiposity or hepatic steatosis because the associations were mostly attenuated when BMI or CAP was added to the multivariable model. Notably, hepatic fibrosis remained significantly associated with obesity-related traits, hypertension, low HDL cholesterol, and, most strongly, with diabetes, with 2.5 times increased odds, even after accounting for CAP, which suggests an association between hepatic fibrosis and cardiometabolic disease in addition too the association with hepatic steatosis.
The paucity of studies on the prevalence and risk factors for hepatic fibrosis in the general population represents a critical knowledge gap in NAFLD epidemiology. Most prior studies have used blood-based fibrosis scores, such as the NAFLD fibrosis score(26) or fibrosis-4 index,(27) to determine the risk of advanced fibrosis.(3,28–30) However, because BMI and diabetes are components of the NAFLD fibrosis score and age is a component of both the NAFLD fibrosis score and fibrosis-4 index, it is difficult to adequately account for confounding by these factors when evaluating the association between score-defined fibrosis and cardiometabolic disease. Other studies included select populations(31,32) and therefore may not reflect the prevalence of fibrosis in the community. A study of participants in another cardiovascular cohort study, the Multi-Ethnic Study of Atherosclerosis, defined hepatic fibrosis using T1 mapping on MRI and were not able to account for liver fat as a con-founding factor in the relationship between hepatic fibrosis and cardiovascular events.(33) Only a few prior community-based or population-based studies have assessed liver fibrosis using VCTE in adults. In the community-based Rotterdam Study, the prevalence of clinically significant hepatic fibrosis, defined as LSM ≥ 8.0 kPa, was 5.6%, which is lower compared with our study. The prevalence of obesity was also lower in the Rotterdam Study, and there may also be differences in diet and lifestyle choices between individuals participating in the Rotterdam Study and the FHS. In another European study of middle-aged adults presenting for free medical checkup, the prevalence of LSM ≥ 8.0 kPa was more consistent with our study at 7.5%, although the prevalence of obesity and metabolic syndrome in this study was lower compared with the FHS.(17) The overall prevalence of clinically significant fibrosis defined by ultrasound-based sheer wave elastography was 13.6% in a community-based study of participants of Hispanic ethnicity.(34)
Also consistent with our study, most prior studies have identified several cardiometabolic factors associated with hepatic fibrosis. In an Italian general population cohort study, the only cardiometabolic risk factors associated with hepatic fibrosis (defined as LSM ≥ 9.6 kPa) were diabetes and elevated ALT.(35) However, consistent with our study, a population-based study in Spain observed multiple cardiometabolic risk factors associated with increased liver stiffness, including elevated ALT, diabetes, low HDL, and high triglyceride levels, even after accounting for abdominal obesity in a multivariable model.(36) However, prior studies have generally used an earlier version of VCTE that did not measure CAP, so they are unable to adjust for hepatic steatosis. Our study adds to the literature by showing the prevalence of hepatic fibrosis in a United States–based cohort study and demonstrating the association between fibrosis and multiple cardiometabolic risk factors after adjustment for hepatic steatosis.
Interestingly, we observed an inverse association between hepatic fibrosis and total cholesterol, consistent with a similar observation in a recent meta-analysis that showed dyslipidemia was associated with a lower LSM.(12) Lipid levels may decrease as fibrosis progresses. Although we accounted for lipid-lowering therapy use in our multivariable model, it is possible that statin use, which may decrease intrahepatic vascular resistance, may lower the LSM, although additional studies are needed.
A major issue in hepatology is the diagnostic gap in NAFLD in which most patients with NAFLD are unaware of their diagnosis.(37) Particularly, because of the historic challenges in assessing hepatic fibrosis, most individuals with NAFLD or at risk for NAFLD have not undergone assessment for hepatic fibrosis. Recently, hepatic fibrosis was shown to be the sole pathologic feature of NAFLD that predicted higher liver-related events and overall mortality.(38) Individuals with hepatic fibrosis have an increased risk for CVD, and many consider NAFLD to be an independent CVD risk factor.(39,40) Importantly, early stage hepatic fibrosis is reversible(41) and represents a critical stage when interventions may be able to alter the natural disease course.
Before population level screening strategies can be recommended, it is essential to understand disease prevalence and factors that may confer additional risk. In the present investigation, obesity, hypertension, low HDL cholesterol, and diabetes were persistently associated with hepatic fibrosis, even after accounting for BMI and CAP, which suggests that these factors may signal that a more advanced NAFLD phenotype is present. Whether screening individuals with these particular cardiometabolic traits would help identify clinically significant fibrosis or is cost effective will need to be assessed in future studies. Additionally, it is not known if modifying cardiometabolic disease risk factors alters the course of NAFLD fibrosis progress or improves clinical outcomes in NAFLD.
There are several possible interpretations for our cross-sectional observational findings. The associations between hepatic fibrosis and cardiometabolic fac-tors are likely complex and bidirectional. For instance, impaired glucose homeostasis may contribute to liver fibrosis, but conversely, liver fibrosis may contribute to altered glucose homeostasis. Hepatic fibrosis occurs in the setting of liver inflammation, injury, and repair.(42) Inflammation, triggered by endotoxins, cytokines, chemokines, or environmental factors, leads to chronic activation of proinflammatory transcription factors, such as nuclear factor κB, which may play a role in worsening insulin resistance. (43,44) Conversely, insulin resistance may contribute to the development of liver fat and fibrosis by impairing the ability of insulin to suppress lipolysis, thereby increasing the delivery of free fatty acids to the liver.(45) In a small human study, individuals with NAFLD demonstrated impaired suppression of lipolysis when exposed to insulin compared with healthy individuals.(45) Insulin resistance and hyperinsulinemia may also contribute to increased de novo lipogenesis because insulin stimulates lipogenic enzymes.(46) In a mouse model, knockout of the liver insulin receptor resulted in the development of peripheral insulin resistance and hepatic steatosis.(47) In addition, the cardiovascular-related factors such as obesity may directly contribute to liver fibrosis, but alternatively, the association may be mediated by another factor; for instance, obesity could predispose an individual to SBP and altered glucose homeostasis, which may causally contribute to liver fibrosis. Another potential mechanism is that obesity may be associated with liver fibrosis by serving as a proxy for other measured and unmeasured confounders. Although we have established associations, the underlying mechanisms and temporality of the relations cannot be determined through our observational study design.
The strength of the present investigation is the large, well-characterized cohort of individuals who have undergone deep phenotyping of both liver-related and cardiovascular-related traits. We observed a relatively high prevalence of subacute hepatic fibrosis.
There are several limitations worth noting. First, although we included the multiethnic OMNI cohort, our study sample still largely consists of individuals of European ancestry, so the generalizability to other races or ethnicities is not known. We define clinically significant hepatic fibrosis based on an LSM threshold and, because we do not have available liver histology to confirm the diagnosis, we may have misclassified individuals’ hepatic fibrosis status. However, misclassification would have biased our results to the null and would not lead to positive associations, as we have observed. Other noninvasive imaging modalities, such as magnetic resonance elastography, are more accurate compared with VCTE(48); however, we choose to perform VCTE because of the lower cost and point-of-care availability. Our study is cross-sectional; we cannot rule out residual confounding or establish causal relations. We examined multiple associations and did not account for multiple testing, and so some of our associations may be falsely positive.
Hepatic fibrosis is associated with obesity traits, diabetes, hypertension, and low HDL cholesterol and occurs in approximately 10% of adults in an unselected, community-based sample. Our findings may have implications for screening strategies and also highlight the importance of evaluating for cardiometabolic disease in patients with hepatic fibrosis.
Supplementary Material
Acknowledgments
Supported by 75N92019D00031 (to the Framingham Heart Study). Dr. Long is supported in part by the National Institute of Diabetes and Digestive and Kidney Diseases K23 DK113252, Gilead Sciences, Echosens Corporation, the Doris Duke Clinical Scientist in Development Award 2019085, the Boston University School of Medicine Department of Medicine Career Investment Award, and the Boston University Clinical Translational Science Institute (UL1 TR001430). Dr. Benjamin is supported in part by NHLBI R01HL128914, 2R01 HL092577, and the American Heart Association (18SFRN34110082). Dr. Chung is supported in part by the MGH Research Scholars Program. Dr. Loomba receives funding support from NIEHS (5P42ES010337), NCATS (5UL1TR001442), NIDDK (U01DK061734, R01DK106419, P30DK120515, R01DK121378, R01DK124318), NHLBI (P01HL147835), and DOD PRCRP (W81XWH-18–2-0026).
Abbreviations:
- ALT
alanine aminotransferase
- AST
aspartate aminotransferase
- BMI
body mass index
- CAP
controlled attenuation parameter
- DBP
diastolic blood pressure
- FHS
Framingham Heart Study
- hgbA1c
glycosylated hemoglobin
- LSM
liver stiffness measurement
- SBP
systolic blood pressure
- VCTE
vibration-controlled transient elastography
Footnotes
Potential conflict of interest: Dr. Long advises Ionis and received grants from Gilead and Echosens. Dr. Corey consults for and received grants from Bristol-Myers Squibb. She advises Novo Nordisk and received grants from Boehringer Ingelheim. Dr. Loomba consults, advises, and received grants from Boehringer Ingelheim, Bristol-Myers Squibb, Cirius, Eli Lilly, Galmed, Gilead, Intercept, Janssen, Merck, NGM, Pfizer, Prometheus, and Siemens. He consults for and advises Anylam/Regeneron, Arrowhead Pharmaceuticals, AstraZeneca, Bird Rock Bio, Boehringer Ingelheim, Celgene, CohBar, Conatus, Gemphire, Glympse bio, GNI, GRI Bio, Inipharm, Ionis, Metacrine, Inc., Novartis, Novo Nordisk, Promethera, Sanofi, Siemens, and Viking Therapeutics. He received grants from Allergan, Galectin Therapeutics, GE, Genfit, Grail, Madrigal Pharmaceuticals, NuSirt, and pH Pharma. He is also a cofounder of Liponexus, Inc.
Supporting Information
Additional Supporting Information may be found at onlinelibrary.wiley.com/doi/10.1002/hep.31608/suppinfo.
REFERENCES
- 1).Loomba R, Sanyal AJ. The global NAFLD epidemic. Nat Rev Gastroenterol Hepatol 2013;10:686–690. [DOI] [PubMed] [Google Scholar]
- 2).Dunn W, Xu R, Wingard DL, Rogers C, Angulo P, Younossi ZM, et al. Suspected nonalcoholic fatty liver disease and mortality risk in a population-based cohort study. Am J Gastroenterol 2008;103:2263–2271. [DOI] [PMC free article] [PubMed] [Google Scholar]
- 3).Kim D, Kim WR, Kim HJ, Therneau TM. Association between noninvasive fibrosis markers and mortality among adults with nonalcoholic fatty liver disease in the United States. Hepatology 2013;57:1357–1365. [DOI] [PMC free article] [PubMed] [Google Scholar]
- 4).Ong JP, Pitts A, Younossi ZM. Increased overall mortality and liver-related mortality in non-alcoholic fatty liver disease. J Hepatol 2008;49:608–612. [DOI] [PubMed] [Google Scholar]
- 5).Wong RJ, Aguilar M, Cheung R, Perumpail RB, Harrison SA, Younossi ZM, et al. Nonalcoholic steatohepatitis is the second leading etiology of liver disease among adults awaiting liver transplantation in the United States. Gastroenterology 2015;148:547–555. [DOI] [PubMed] [Google Scholar]
- 6).Anstee QM, Targher G, Day CP. Progression of NAFLD to diabetes mellitus, cardiovascular disease or cirrhosis. Nat Rev Gastroenterol Hepatol 2013;10:330–344. [DOI] [PubMed] [Google Scholar]
- 7).Targher G, Byrne CD, Lonardo A, Zoppini G, Barbui C. Non-alcoholic fatty liver disease and risk of incident cardiovascular disease: a meta-analysis. J Hepatol 2016;65:589–600. [DOI] [PubMed] [Google Scholar]
- 8).Abdelmalek MF, Diehl AM. Nonalcoholic fatty liver disease as a complication of insulin resistance. Med Clin North Am 2007;91:1125–1149, ix. [DOI] [PubMed] [Google Scholar]
- 9).Adams LA, Anstee QM, Tilg H, Targher G. Non-alcoholic fatty liver disease and its relationship with cardiovascular disease and other extrahepatic diseases. Gut 2017;66:1138–1153. [DOI] [PubMed] [Google Scholar]
- 10).Hagström H, Nasr P, Ekstedt M, Hammar U, Stål P, Askling J, et al. Cardiovascular risk factors in non-alcoholic fatty liver disease. Liver Int 2019;39:197–204. [DOI] [PubMed] [Google Scholar]
- 11).Speliotes EK, Massaro JM, Hoffmann U, Vasan RS, Meigs JB, Sahani DV, et al. Fatty liver is associated with dyslipidemia and dysglycemia independent of visceral fat: the Framingham Heart Study. Hepatology 2010;51:1979–1987. [DOI] [PMC free article] [PubMed] [Google Scholar]
- 12).Bazerbachi F, Haffar S, Wang Z, Cabezas J, Arias-Loste MT, Crespo J, et al. Range of normal liver stiffness and factors associated with increased stiffness measurements in apparently healthy individuals. Clin Gastroenterol Hepatol 2019;17:54. [DOI] [PubMed] [Google Scholar]
- 13).Koehler EM, Plompen EP, Schouten JN, Hansen BE, Darwish Murad S, Taimr P, et al. Presence of diabetes mellitus and steatosis is associated with liver stiffness in a general population: the Rotterdam study. Hepatology 2016;63:138–147. [DOI] [PubMed] [Google Scholar]
- 14).Splansky GL, Corey D, Yang Q, Atwood LD, Cupples LA, Benjamin EJ, et al. The Third Generation Cohort of the National Heart, Lung, and Blood Institute’s Framingham Heart Study: design, recruitment, and initial examination. Am J Epidemiol 2007;165:1328–1335. [DOI] [PubMed] [Google Scholar]
- 15).Boursier J, Zarski JP, de Ledinghen V, Rousselet MC, Sturm N, Lebail B, et al. Determination of reliability criteria for liver stiffness evaluation by transient elastography. Hepatology 2013;57:1182–1191. [DOI] [PubMed] [Google Scholar]
- 16).Castera L, Forns X, Alberti A. Non-invasive evaluation of liver fibrosis using transient elastography. J Hepatol 2008;48:835–847. [DOI] [PubMed] [Google Scholar]
- 17).Roulot D, Costes JL, Buyck JF, Warzocha U, Gambier N, Czernichow S, et al. Transient elastography as a screening tool for liver fibrosis and cirrhosis in a community-based population aged over 45 years. Gut 2011;60:977–984. [DOI] [PubMed] [Google Scholar]
- 18).Wong VW, Vergniol J, Wong GL, Foucher J, Chan HL, Le Bail B, et al. Diagnosis of fibrosis and cirrhosis using liver stiffness measurement in nonalcoholic fatty liver disease. Hepatology 2010;51:454–462. [DOI] [PubMed] [Google Scholar]
- 19).Eddowes PJ, Sasso M, Allison M, Tsochatzis E, Anstee QM, Sheridan D, et al. Accuracy of fibroscan controlled attenuation parameter and liver stiffness measurement in assessing steatosis and fibrosis in patients with nonalcoholic fatty liver disease. Gastroenterology 2019;156:1717–1730. [DOI] [PubMed] [Google Scholar]
- 20).Siddiqui MS, Vuppalanchi R, Van Natta ML, Hallinan E, Kowdley KV, Abdelmalek M, et al. Vibration-controlled transient elastography to assess fibrosis and steatosis in patients with nonalcoholic fatty liver disease. Clin Gastroenterol Hepatol 2019;17:156–163.e152. [DOI] [PMC free article] [PubMed] [Google Scholar]
- 21).Caussy C, Alquiraish MH, Nguyen P, Hernandez C, Cepin S, Fortney LE, et al. Optimal threshold of controlled attenuation parameter with MRI-PDFF as the gold standard for the detection of hepatic steatosis. Hepatology 2018;67:1348–1359. [DOI] [PMC free article] [PubMed] [Google Scholar]
- 22).Sasso M, Beaugrand M, de Ledinghen V, Douvin C, Marcellin P, Poupon R, et al. Controlled attenuation parameter (CAP): a novel VCTE guided ultrasonic attenuation measurement for the evaluation of hepatic steatosis: preliminary study and validation in a cohort of patients with chronic liver disease from various causes. Ultrasound Med Biol 2010;36:1825–1835. [DOI] [PubMed] [Google Scholar]
- 23).Kannel WB, Sorlie P. Some health benefits of physical activity. The Framingham Study. Arch Intern Med 1979;139: 857–861. [PubMed] [Google Scholar]
- 24).Expert Panel on Detection, Evaluation, and Treatment of High Blood Cholesterol in Adults. Executive summary of the third report of the National Cholesterol Education Program (NCEP) expert panel on detection, evaluation, and treatment of high blood cholesterol in adults (adult treatment panel III). JAMA 2001;285:2486–2497. [DOI] [PubMed] [Google Scholar]
- 25).Chalasani N, Younossi Z, Lavine JE, Charlton M, Cusi K, Rinella M, et al. The diagnosis and management of nonalcoholic fatty liver disease: practice guidance from the American Association for the Study of Liver Diseases. Hepatology 2018;67:328–357. [DOI] [PubMed] [Google Scholar]
- 26).Angulo P, Hui JM, Marchesini G, Bugianesi E, George J, Farrell GC, et al. The NAFLD fibrosis score: a noninvasive system that identifies liver fibrosis in patients with NAFLD. Hepatology 2007;45:846–854. [DOI] [PubMed] [Google Scholar]
- 27).Vallet-Pichard A, Mallet V, Nalpas B, Verkarre V, Nalpas A, Dhalluin-Venier V, et al. FIB-4: an inexpensive and accurate marker of fibrosis in HCV infection. comparison with liver biopsy and fibrotest. Hepatology 2007;46:32–36. [DOI] [PubMed] [Google Scholar]
- 28).Le MH, Devaki P, Ha NB, Jun DW, Te HS, Cheung RC, et al. Prevalence of non-alcoholic fatty liver disease and risk factors for advanced fibrosis and mortality in the United States. PLoS One 2017;12:e0173499. [DOI] [PMC free article] [PubMed] [Google Scholar]
- 29).Parikh NS, VanWagner LB, Elkind MSV, Gutierrez J. Association between nonalcoholic fatty liver disease with advanced fibrosis and stroke. J Neurol Sci 2019;407:116524. [DOI] [PMC free article] [PubMed] [Google Scholar]
- 30).Han E, Lee YH, Kim YD, Kim BK, Park JY, Kim DY, et al. Nonalcoholic fatty liver disease and sarcopenia are independently associated with cardiovascular risk. Am J Gastroenterol 2020;115:584–595. [DOI] [PubMed] [Google Scholar]
- 31).Lee HW, Kim BK, Kim SU, Park JY, Kim DY, Ahn SH, et al. Prevalence and predictors of significant fibrosis among subjects with transient elastography-defined nonalcoholic fatty liver disease. Dig Dis Sci 2017;62:2150–2158. [DOI] [PubMed] [Google Scholar]
- 32).Mantovani A, Turino T, Lando MG, Gjini K, Byrne CD, Zusi C, et al. Screening for non-alcoholic fatty liver disease using liver stiffness measurement and its association with chronic kidney disease and cardiovascular complications in patients with type 2 diabetes. Diabetes Metab 2020;46:296–303. [DOI] [PubMed] [Google Scholar]
- 33).Ostovaneh MR, Ambale-Venkatesh B, Fuji T, Bakhshi H, Shah R, Murthy VL, et al. Association of liver fibrosis with cardio-vascular diseases in the general population: the multi-ethnic study of atherosclerosis (MESA). Circ Cardiovasc Imaging 2018;11:e007241. [DOI] [PMC free article] [PubMed] [Google Scholar]
- 34).Watt GP, Lee M, Pan JJ, Fallon MB, Loomba R, Beretta L, et al. High prevalence of hepatic fibrosis, measured by elastography, in a population-based study of Mexican Americans. Clin Gastroenterol Hepatol 2019;17:968. [DOI] [PMC free article] [PubMed] [Google Scholar]
- 35).Petta S, Di Marco V, Pipitone RM, Grimaudo S, Buscemi C, Craxì A, et al. Prevalence and severity of nonalcoholic fatty liver disease by transient elastography: genetic and metabolic risk fac-tors in a general population. Liver Int 2018;38:2060–2068. [DOI] [PubMed] [Google Scholar]
- 36).Caballería L, Pera G, Arteaga I, Rodríguez L, Alumà A, Morillas RM, et al. High prevalence of liver fibrosis among European adults with unknown liver disease: a population-based study. Clin Gastroenterol Hepatol 2018;16:1138–1145.e5. [DOI] [PubMed] [Google Scholar]
- 37).Alexander M, Loomis AK, Fairburn-Beech J, van der Lei J, Duarte-Salles T, Prieto-Alhambra D, et al. Real-world data reveal a diagnostic gap in non-alcoholic fatty liver disease. BMC Med 2018;16:130. [DOI] [PMC free article] [PubMed] [Google Scholar]
- 38).Angulo P, Kleiner DE, Dam-Larsen S, Adams LA, Bjornsson ES, Charatcharoenwitthaya P, et al. Liver fibrosis, but no other histologic features, is associated with long-term outcomes of patients with nonalcoholic fatty liver disease. Gastroenterology 2015;149:389–397.e310. [DOI] [PMC free article] [PubMed] [Google Scholar]
- 39).Targher G, Day CP, Bonora E. Risk of cardiovascular disease in patients with nonalcoholic fatty liver disease. N Engl J Med 2010;363:1341–1350. [DOI] [PubMed] [Google Scholar]
- 40).Henson JB, Simon TG, Kaplan A, Osganian S, Masia R, Corey KE. Advanced fibrosis is associated with incident cardiovascular disease in patients with non-alcoholic fatty liver disease. Aliment Pharmacol Ther 2020;51:728–736. [DOI] [PMC free article] [PubMed] [Google Scholar]
- 41).Neuschwander-Tetri BA, Loomba R, Sanyal AJ, Lavine JE, Van Natta ML, Abdelmalek MF, et al. Farnesoid X nuclear receptor ligand obeticholic acid for non-cirrhotic, non-alcoholic steatohepatitis (FLINT): a multicentre, randomised, placebo-controlled trial. Lancet 2015;385:956–965. [DOI] [PMC free article] [PubMed] [Google Scholar]
- 42).Rockey DC, Bell PD, Hill JA. Fibrosis—a common pathway to organ injury and failure. N Engl J Med 2015;372:1138–1149. [DOI] [PubMed] [Google Scholar]
- 43).Liang W, Lindeman JH, Menke AL, Koonen DP, Morrison M, Havekes LM, et al. Metabolically induced liver inflammation leads to NASH and differs from LPS- or IL-1β-induced chronic inflammation. Lab Invest 2014;94:491–502. [DOI] [PubMed] [Google Scholar]
- 44).Cai D, Yuan M, Frantz DF, Melendez PA, Hansen L, Lee J, et al. Local and systemic insulin resistance resulting from hepatic activation of IKK-beta and NF-kappaB. Nat Med 2005;11: 183–190. [DOI] [PMC free article] [PubMed] [Google Scholar]
- 45).Marchesini G, Brizi M, Bianchi G, Tomassetti S, Bugianesi E, Lenzi M, et al. Nonalcoholic fatty liver disease: a feature of the metabolic syndrome. Diabetes 2001;50:1844–1850. [DOI] [PubMed] [Google Scholar]
- 46).Tamura S, Shimomura I. Contribution of adipose tissue and de novo lipogenesis to nonalcoholic fatty liver disease. J Clin Invest 2005;115:1139–1142. [DOI] [PMC free article] [PubMed] [Google Scholar]
- 47).Biddinger SB, Kahn CR. From mice to men: insights into the insulin resistance syndromes. Annu Rev Physiol 2006;68: 123–158. [DOI] [PubMed] [Google Scholar]
- 48).Hsu C, Caussy C, Imajo K, Chen J, Singh S, Kaulback K, et al. Magnetic resonance vs transient elastography analysis of patients with nonalcoholic fatty liver disease: a systematic review and pooled analysis of individual participants. Clin Gastroenterol Hepatol 2019;17:630–637:e638. [DOI] [PMC free article] [PubMed] [Google Scholar]
Associated Data
This section collects any data citations, data availability statements, or supplementary materials included in this article.