Abstract
A technique to assess the ability of distinct Candida strains to efflux substrates, as well as to compare the effectiveness of efflux inhibitors, is important for analysis of antifungal drug resistance mechanisms and the mode of action of antifungals. We describe a method that measures the ability of Candida species to extrude the fluorescent dye Nile red as an output for efflux activity. This involves exposing cells to Nile red and using flow cytometry to quantify cellular fluorescence, enabling numerous samples to be processed in a limited time frame. This protocol provides a simple, yet effective method for quantifying efflux in drug-resistant Candida species.
Keywords: Candida, drug-resistance, efflux, efflux inhibitors, Nile red
INTRODUCTION
The upregulation of multidrug efflux pumps is a major mechanism of drug resistance among pathogenic fungi (Holmes et al., 2016; Lee, Puumala, Robbins, & Cowen, 2020). The ability to measure the cellular efflux of a particular substrate provides insight into the extent to which efflux contributes to the drug-resistance phenotype of a given strain, and also provides the opportunity to test the efficacy of potential efflux inhibitors. As such, many fluorescent substrates have emerged as proxies to measure the efflux potential in fungal cells (Maesaki, Marichal, Vanden Bossche, Sanglard, & Kohno, 1999; Singh, Kaur, Yadav, & Komath, 2009; Szczepaniak, Lukaszewicz, & Krasowska, 2015). These reagents rely on measuring the relative fluorescence within the cell, or the increase in fluorescence of the supernatant over time, as an indicator of efflux activity. However, when working with highly resistant fungal isolates, the level of efflux can be so great that the fluorescence of many of these dyes is too low to confidently discriminate efflux capabilities between isolates or quantify the effects of various efflux inhibitors on pump activity. Thus, the selection of adequate fluorescent markers, along with the optimization of experimental protocols, is of utmost importance. Here, we describe a simple but robust set of protocols for measuring the efflux potential of resistant Candida species, including Candida auris and Candida albicans, using the lipophobic dye Nile red. Nile red is advantageous for these methods, as it only fluoresces in the highly hydrophobic environment found inside yeast cells (Verstrepen et al., 2004). This minimizes experimental noise and eliminates the need for time-consuming wash steps when working with numerous samples. Work with C. albicans has found that Nile red is a substrate for both ATP-binding cassette transporters and major facilitator superfamily transporters (Ivnitski-Steele et al., 2009), two structurally and mechanistically distinct efflux pump families that play important roles in antifungal resistance (Morschhäuser, 2002). This feature allows one to probe the overall level of efflux mediated by both of these transporter families. This protocol can be applied to compare the efflux potential of different Candida isolates, or employed in a high-throughput manner to identify efflux inhibitors.
Basic Protocol 1 describes the culturing conditions in which Candida cells are stained with Nile red, followed by Basic Protocol 2, which outlines the steps for quantifying and observing fluorescence in these cells. Overall, this approach allows a simple discrimination between the efflux capabilities of different strains or treatment conditions, which will facilitate the advancement of cell biology and drug discovery in these organisms.
BASIC PROTOCOL 1 GROWTH AND SAMPLE PREPARATION OF STAINED CANDIDA
Basic Protocol 1 explains the growth conditions of Candida strains and the sample preparation for flow cytometric analysis. These are standard conditions, and therefore, media and other growth conditions can be altered for specific experiments.
Materials
YPD agar (see recipe)
Candida strains to be analyzed (e.g., Candida auris and Candida albicans; laboratory isolates, clinical isolates, and/or genetic mutants as appropriate for the particular experiment)
YPD medium (see recipe)
Compounds to be tested (if testing compounds, include a control compound, e.g., Enniatin A, Sigma-Aldrich, cat. no. E9661-1MG)
Dimethylsulfoxide (DMSO; Sigma-Aldrich, cat. no. D2438-50ML)
Nile red (Millipore-Sigma, cat. no. 72485-100MG)
Deionized water (e.g., from Milli-Q® system; Merck Milli-Q® Integral)
10× PBS (Sigma-Aldrich, cat. no. D1408-500ML)
100-mm × 15-mm petri dish (e.g., ThermoFisher, cat. no. FB0875712
Sterile pipette tips (e.g., VWR, Next Generation Pipet Tip Refill System)
30°C incubator (e.g., VWR)
Culture tubes (e.g., Falcon, 14-ml round bottom, sterile, snap cap, cat. no. 352059)
30°C shaking incubator (e.g., Eppendorf Incubator Shaker Series I 26)
Cuvettes (VWR, two-sided disposable plastic cuvettes, semi-micro, material = polystyrene (PS), volume range = 1.5-3.0 ml, cat. no. 97000-586)
Spectrophotometer (Molecular Devices, SpectraMax Plus 384 Microplate Reader)
Eppendorf-type microcentrifuge tubes (Frogga Bio, cat. no. LMCT1.7B)
Microcentrifuge (Eppendorf, Microcentrifuge Model 5418)
Grow Candida
Make YPD agar as described in the recipe in Reagents and Solutions, and pour ~20 ml per 100-mm × 15-mm petri dish.
Ensure that plates are completely dried before continuing to next step. Typically, this will take 18-24 hr.
Streak desired Candida strains from glycerol stocks with a sterile pipette tip or sterile inoculation stick onto YPD agar plates.
It is best to use strains that are freshly struck out from glycerol stocks. If testing different mutant strains, be sure to include appropriate parental controls.
Incubate plates in a 30°C incubator overnight.
Some strains are slower growing and will require a 48-hr incubation. After strains have grown, plates can be stored at 4°C for longer storage. After 2-3 weeks, strains should be struck out again from glycerol stocks on fresh YPD agar.
Use a single colony to inoculate 3 ml of liquid YPD medium (see recipe), and grow overnight cultures of all strains to be tested as well as parental controls in tubes in a 30°C shaking incubator (200 rpm).
Measure the OD600 of each overnight culture in a cuvette with a spectrophotometer.
A simple method is to make a 1:20 dilution of the culture (50 μl of overnight culture + 950 μl of YPD medium) in a cuvette and use a YPD medium blank to calibrate. For example, if your diluted spectrophotometer reading was OD600 0.75, then you can back-calculate the OD600 of the overnight culture to (20)(0.75) = 15.
Label culture tubes with specific treatment group (e.g., Stained).
Each tube will become a different sample run on the flow cytometer. Therefore, if testing differences between strains, set up two subcultures for each strain (unstained and stained), or if assessing a compound, set up three subcultures for each strain (unstained, stained, and stained with compound).
Dilute cultures to a starting OD600 of 0.1 in 2 ml of YPD medium.
Use the calculation C1V1 = C2V2. For example, using the OD600 from step 5, (15)(V1) = (0.1)(2000 μl). Therefore, V1 = 13.33 μl, and you would add 13.33 μl of the overnight to each subculture.
Subculture each strain in labeled tubes at 30°C with agitation for ~4 hr until exponential phase is reached.
If strains have different growth rates, subcultures may need to be staggered to ensure that all cells are in exponential phase prior to Nile red staining. It is acceptable to have varying subculture durations, but the time exposed to Nile red must be consistent between samples.
During this subculture time, ensure that the flow cytometer is clean and has passed quality control with fluorophores, and set it to plate-reading mode according to manufacturer’s instructions to avoid delay later in the protocol.
Sample preparation
For experiments assessing efflux inhibitors, add compound directly to marked YPD subcultures at desired concentration. If only assessing different strains, skip to step 10.
The amount of compound to add to each subculture can be calculated using the same C1V1 = C2V2 formula as described in step 7.
If testing efflux inhibitors, consider including a control compound such as Enniatin A at a final concentration of 2 μg/ml.
Continue to incubate under the same conditions for 10 min with agitation.
Prepare Nile red stock by dissolving powder in DMSO to a concentration of 3.5 mM.
Once prepared, stock should be stored in the dark at −20°C; it can be used for subsequent experiments for up to 6 months.
This assay could also be adapted for rhodamine-6G, in which case a stock solution of 1 mg/ml in DMSO should be prepared.
Add Nile red to all indicated tubes from stock solution to a final concentration of 7 μM (4 μl in 2 ml culture).
If working with rhodamine-6G, add stock to a final concentration of 1 μg/ml (2 μl in a 2 ml culture).
Incubate in the dark for an additional 20 min with agitation at 30°C.
Transfer 1 ml of subculture to pre-labeled Eppendorf tubes and pellet cells for 1 min at 14,000 rpm (highest speed) in a microcentrifuge.
Pellet size will vary depending on growth rate, but as long as it is visible you may proceed (Fig. 1). If no visible pellet forms, add the remaining 1 ml of subculture to ensure that enough cells are analyzed.
Figure 1.
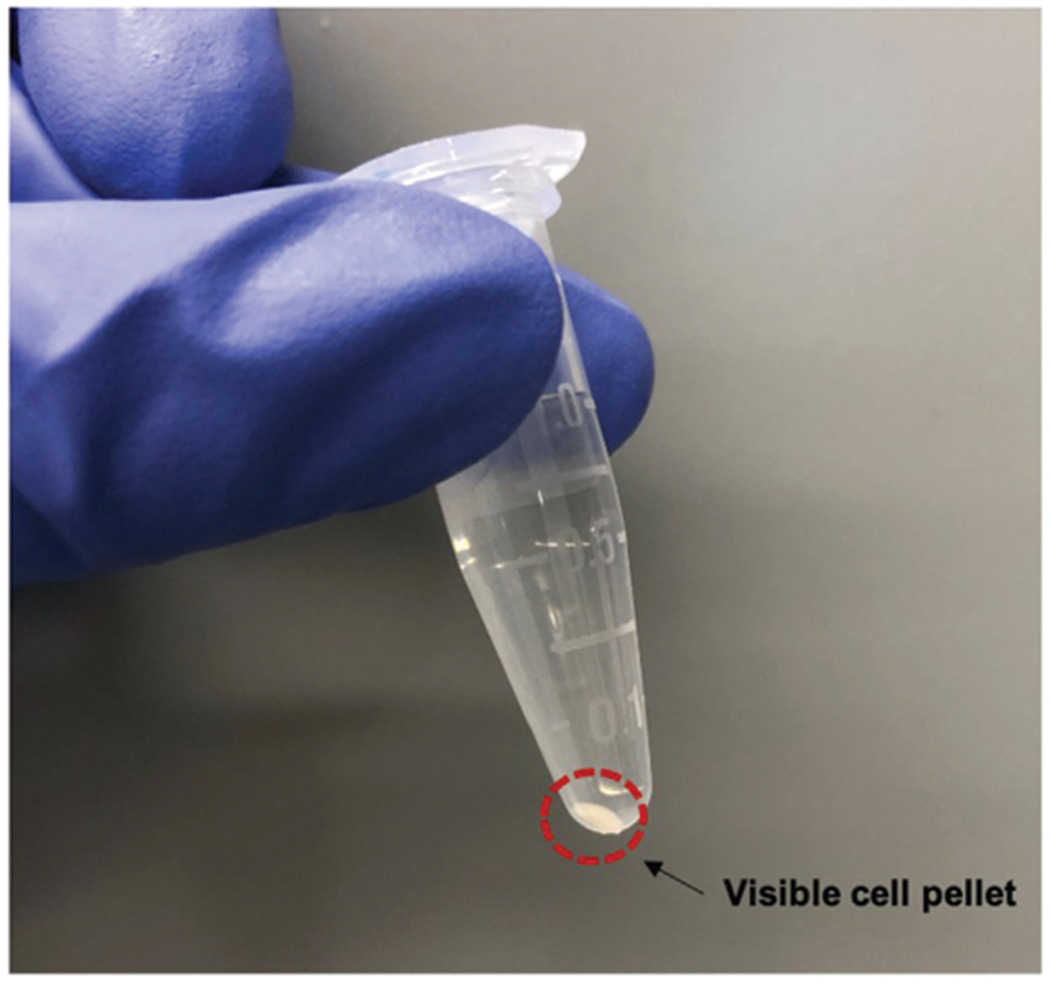
Expected cell pellet size after Basic Protocol 1. Image displaying an appropriate cell pellet at the end of Basic Protocol 1, in order to proceed with Basic Protocol 2. Pellet size may vary depending on cell size and growth rate.
Remove supernatant and resuspend in 1 ml of 1× PBS (1:10 dilution of 10× PBS in deionized sterile water).
BASIC PROTOCOL 2 QUANTITATIVE MEASUREMENT OF FLUORESCENCE BY FLOW CYTOMETRY
Basic Protocol 2 describes the methods for processing and analyzing samples on the flow cytometer. While this protocol focuses on Candida species, this technique would work with other fungal species.
Materials
Candida-PBS cell suspension from Basic Protocol 1
Deionized water (e.g., from Milli-Q® system)
10× phosphate-buffered saline (PBS; Sigma-Aldrich, cat. no. D1408-500ML)
Sterile pipette tips (e.g., VWR, Next Generation Pipet Tip Refill System)
Milli-Q® integral water purification system for ultrapure (deionized) water (Merck, model: Milli-Q® Integral)
96-well plate (e.g., Beckman Coulter, nonsterile without lids, cat. no. 609844)
Flow cytometer (e.g., Beckman Coulter, CytoFLEX, S BC21021)
Internet-connected computer linked to flow cytometer with Beckman Coulter CytExpert Software 2.3 installed (or equivalent flow cytometry acquisition software)
Run samples on flow cytometer
Dilute cell suspension to an OD600 of ~0.1 in 1× PBS (1:10 dilution of 10× PBS in deionized sterile water) and transfer 100 μl per well of a 96-well plate. A recommended plate layout can be seen in Figure 2.
Figure 2.
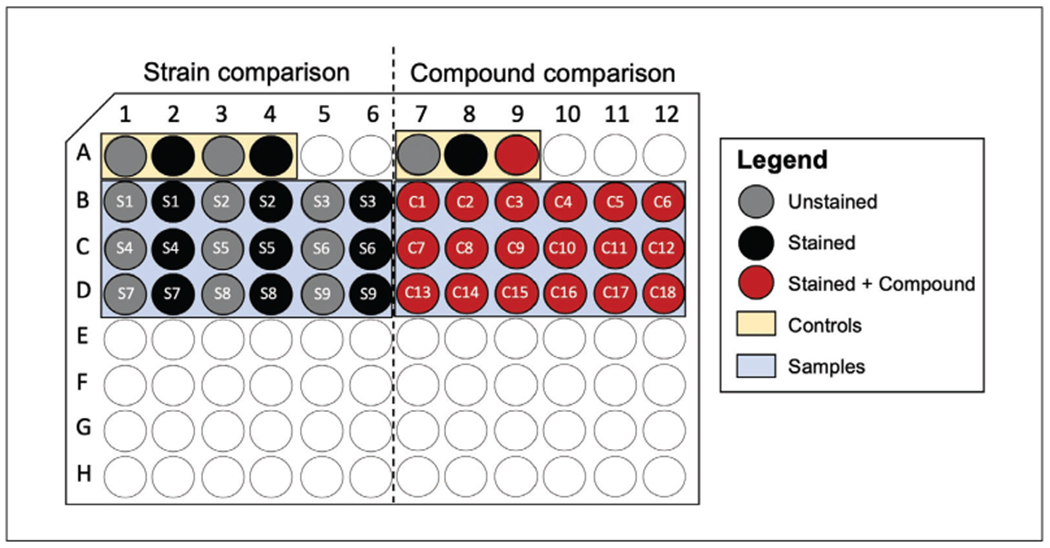
Recommended plate setup for flow cytometry. Schematic showing an example of a plate layout for experiments comparing efflux capabilities of different strains (left) or putative efflux inhibitors (right). For strain comparison, each plate contains an unstained and stained parental control and efflux-deficient strain to ensure that a measurable window is achieved (yellow), in addition to the strains to be analyzed indicated by Sx, highlighted in blue. For assessing putative efflux inhibitors, a control compound should be used for the same purpose (yellow), in addition to stained samples containing molecules being assessed, indicated by Cx and highlighted in blue.
The exact cell density is not critical—you just need enough cells to measure and a low enough density not to block the tubing of the flow cytometer.
Open CytExpert software and select “New Experiment” from the “File” table in the main menu bar (refer to Fig. 3).
Click the “Plate” button from the “Tube” sidebar and highlight the wells you wish to analyze (Fig. 3). Once you click “OK,” the wells you have indicated will appear on the sample list, and you can exit out of the plate layout. Input the sample name corresponding to the well location into the CytExpert software.
Load the plate and run each sample on the flow cytometer with a slow flow rate (10 μl/min) until ~20,000 events have been recorded.
Figure 3.
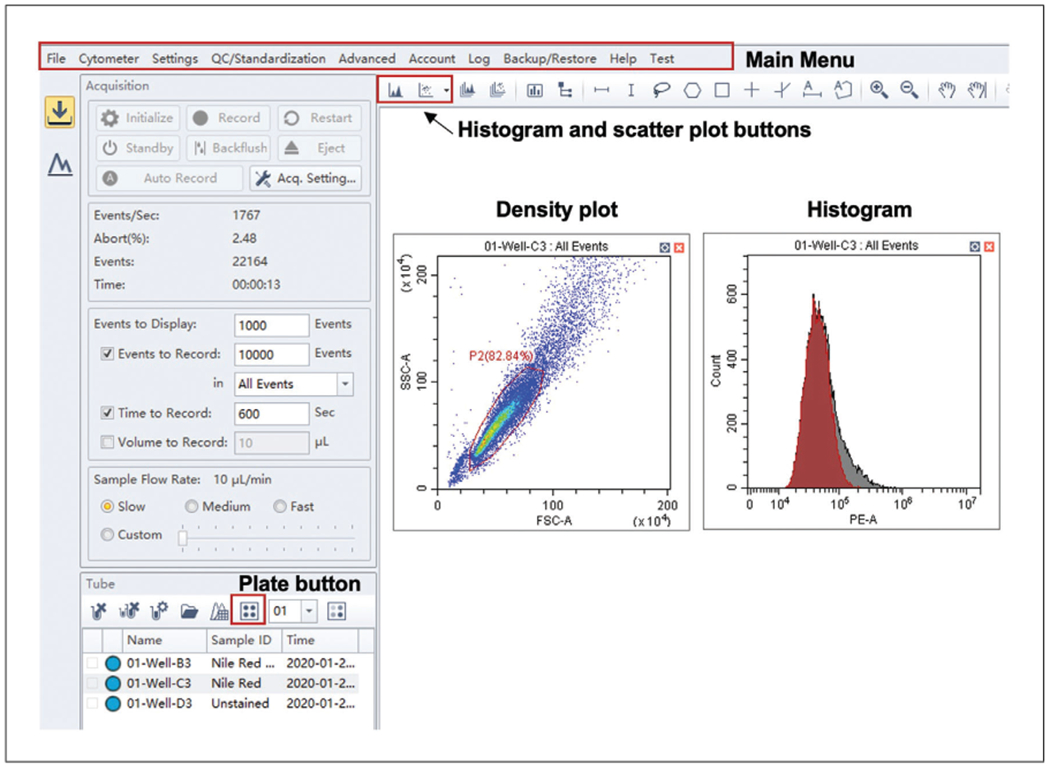
CytExpert display on the Acquisition tab. Schematic of the display on the Acquisition tab. Major controls are found in the main menu bar at the top. The plate layout can be altered from the plate button, and while the sample is running, events can be observed by creating a density or histogram plot.
You can visualize events as they are recorded in the “Acquisition” tab by adding a plot or histogram (Fig. 3).
Clean flow cytometer very well after use, as cells can block the tubing. This can be done by selecting “daily clean” from the drop-down menu in the “Cytometer” tab of the main menu bar and adjusting the default plate layout to contain several wells consisting of deionized water and cleaning reagent.
For routine cleaning, ~5 wells of cleaning reagent and ~8 wells of water should be sufficient.
Analyze and plot flow cytometer data
In CytExpert, open your experiment and work in the “Analyze” tab, as displayed in Figure 4.
For each sample, populate a scatter density graph plotting the side scatter (SSC-A) versus the forward scatter (FSC-A) by dragging the sample from the list on the left panel to the empty graph, as seen in Figure 4.
Gate the parental population to exclude debris, abnormally sized cells, and cell clumps (Figs. 4 and 5A).
Apply this gate to all samples of the same species you wish to compare by copying and pasting the desired gate onto the new population. Ensure that the majority of the population is included.
Create a histogram overlay plot by selecting it from the histogram plot drop-down menu of the CytExpert software (Fig. 4). By clicking the x-axis label, you can change it from the default to “PE-A” channel fluorescence; click on the y-axis if need be to change to “Count.”
Populate this plot with all samples you wish to compare (Figs. 4 and 5B) by dragging the sample from the list on the right on to the plot.
Ensure that the gated rather than total populations are displayed in the histogram plots by selecting the gate (e.g., P2) from the drop-down menu in the title of the plot.
A statistics tab (Fig. 4) can be opened for each sample with customizable outputs such as the median fluorescence for each population and statistics such as the r-CV.
Figure 4.
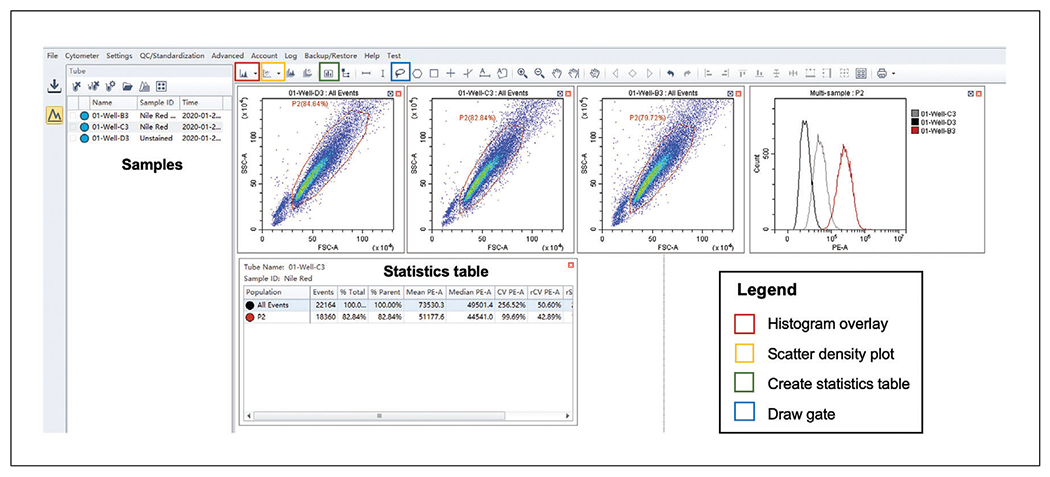
CytExpert display on the Analyze tab. Recommended layout of CytExpert Analyze display allowing gating of sample populations (blue box on menu bar) on density scatter plots (yellow box on menu bar). Samples can be dragged from the panel on the left to populate these plots as well as a histogram overlay plot (red box on menu bar). Finally, a statistics table can be generated (green box on menu bar) to determine raw values such as mean and median channel fluorescence.
Figure 5.
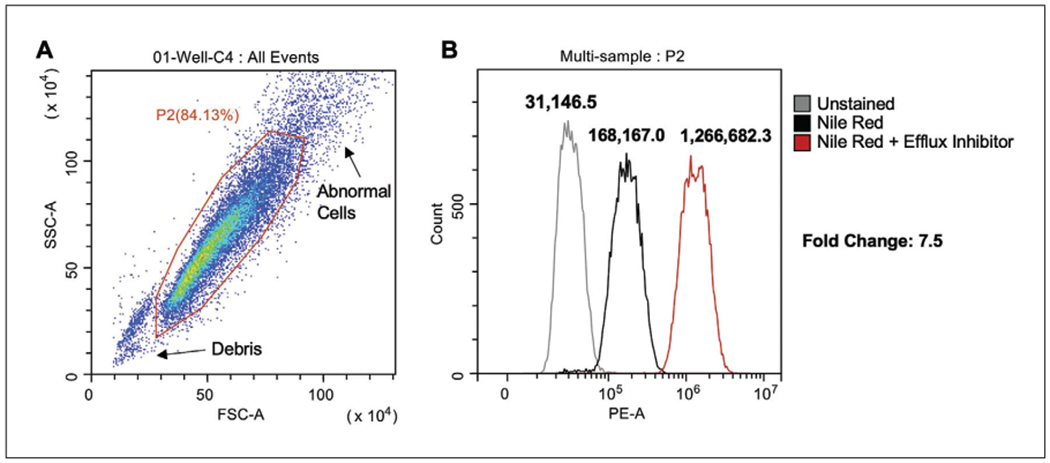
Flow cytometric analysis of Candida cells. (A) Gating strategy of total events to produce gated population (P2). (B) Histogram overlay plots of P2 to compare fluorescence (PE-A) of different treatment conditions.
For samples with a normal distribution, the median PE channel fluorescence can be taken to calculate fold differences between different strains or treated samples.
QUALITATIVE DETERMINATION OF FLUORESCENCE USING MICROSCOPY ALTERNATE PROTOCOL
This Alternate Protocol can be used to provide supplementary images to flow analysis, or in the absence of a flow cytometer, to observe differences in Nile red efflux between different strains or treatments. This is a less sensitive method and is therefore not the preferred technique.
Materials
Candida-PBS cell suspension from Basic Protocol 1
Immersion oil (e.g., ThermoFisher, Immersol 518F Immersion Oil cat. no. 12-624-66B)
Sterile pipette tips (e.g., VWR, Next Generation Pipet Tip Refill System)
Eppendorf-type microcentrifuge tubes (Frogga Bio, cat. no. LMCT1.7B)
Microscope slides (e.g., VWR, cat. no. 2589-CA48323-190 L)
Microscope slide coverslips (e.g., VWR, Micro Cover Glasses, cat. no. 48366-067)
Microscope (e.g., Carl Zeiss, Zeiss Axio Imager.MI, X-cite series 120 light source for fluorescence with DsRed filter from Chroma Technology)
Cell imaging
Turn on microscope and the fluorescence bulb to allow time for it to warm up (minimum of 15 min).
Take ~4 μl of Candida-PBS cell suspension from the Eppendorf tube and place on labeled glass slide, then gently place coverslip on top.
Focus image using the 40× oil-immersion lens, and then switch to the 100× oil-immersion lens; visualize cells on differential interference contrast (DIC), and Nile red accumulation on the DsRed channel, maintaining the same exposure time for all samples (Fig. 6).
Figure 6.
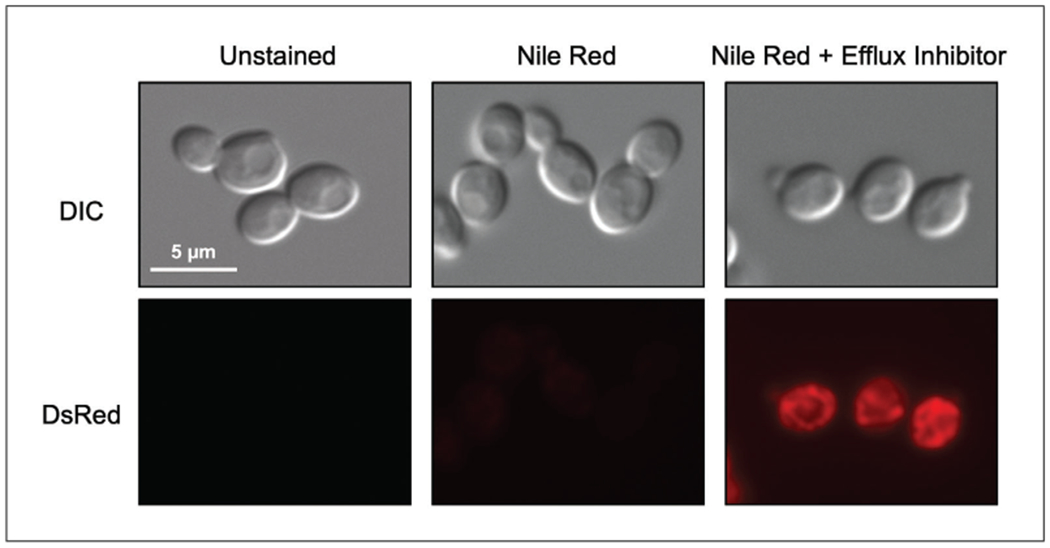
Microscopy images of stained Candida cells. Example images of cell in the absence and presence of Nile red stain, as well as with the addition of an efflux inhibitor.
Set the DsRed channel exposure by clicking the “set exposure” button on the DsRed channel tab when focused on the brightest control sample, to avoid over-exposure on subsequent imaging.
REAGENTS AND SOLUTIONS
YPD medium and YPD agar plates
10 g (1%) yeast extract (e.g., BioShop Canada, cat. no. YEX401.1)
20 g (2%) Bacto peptone (e.g., VWR, BD, cat. no. 211820)
20 g (2%) d-glucose (e.g., BioShop Canada, cat. no. GLU501.205)
Milli-Q® water to 1 L total volume
For 2% YPD agar, add 20 g agar (e.g., BioShop Canada, cat. no. AGR001.500) Autoclave
Store liquid medium up to 3 months at room temperature store plates up to 1 month at room temperature or 3 months at 4°C
COMMENTARY
Background Information
Fungal infections are a major contributor to global disease, and the recent rise in drug-resistant fungal infections has strained the already limited arsenal of antifungal drugs available to treat these maladies (Fisher, Hawkins, Sanglard, & Gurr, 2018). In particular, the emergence of drug-resistant Candida species has sparked considerable alarm, such that the Centers for Disease Control and Prevention has highlighted these species as a serious threat to public health (CDC, 2019). Given the rising number of drug-resistant fungi, efforts have been focused on understanding the mechanisms of resistance and identifying inhibitors that block resistance (Holmes et al., 2016). A major contributor to drug resistance is multidrug transporter activity. These promiscuous transporters pump drugs and other substrates out of the cell, reducing their effectiveness. Within Candida species, there are two main classes of efflux pumps that contribute to drug resistance: the ATP-binding cassette (ABC) transporters, such as Cdr1 and Cdr2, which hydrolyze ATP as their energy source, and major facilitator superfamily (MFS) pumps, most notably Mdr1, which utilize membrane potential to drive efflux (Prasad, Banerjee, Khandelwa, & Dhamgaye, 2015).
A classic method to identify fungal efflux inhibitors is to determine the ability of query compounds to enhance the activity of known cytotoxic agents (Campbell, Chan, & Kim, 2012; Hiraga, Wanigasekera, Sugi, Hamanaka, & Oda, 2001). While effective, this approach is contingent on observable growth-inhibitory effects, and could be confounded by the presence of other resistance mechanisms. As a complementary approach, researchers turned to the use of fluorescent dyes to directly probe the efflux potential of cells (Tanabe et al., 2007). Generally, in vivo, there are two main approaches for measuring the extent of cellular efflux with fluorescent dyes. The first technique involves pre-loading cells with a fluorescent dye. This is followed by monitoring a drop in fluorescent signal in the cells or an increase in fluorescent signal in the supernatant over time to calculate the efflux rate. The effect can be magnified by inhibiting ATP synthesis through addition of an inhibitor or starving the cells during staining, followed by removal of the inhibition, which immediately resumes ATP-dependent processes, such as drug transport (Holmes et al., 2012; Schuetzer-Muehlbauer, Willinger, Egner, Ecker, & Kuchler, 2003). However, there are some ATP-independent drug transporters in Candida, such as MFS, whose activity is not evaluated with this strategy. The second approach simply involves measuring the relative accumulation of a given fluorescent dye over a given period of time as a proxy for efflux. This approach is more conducive to high-throughput screening; however, it does not measure the immediate response, nor does it produce efflux rates. Rather, it gives a more global sense of the efflux capabilities of a particular strain (Ivnitski-Steele et al., 2009).
The choice of dye used in either of these experiments is important, as different dyes are substrates for different drug transporters. Perhaps the most long-standing fluorescent dye used in fungal species is rhodamine-6G. Rhodamine-6G is a fluorescent cationic dye originally used to stain mitochondria; however, when it was observed to accumulate in Saccharomyces cerevisiae cells upon disruption of PDR5, a major ABC-transporter gene, it became a fundamental tool in the measurement of efflux (Kolaczkowski et al., 1996). Since then, work has established that rhodamine-6G is a substrate for the ATP-dependent ABC transporters in yeast (Lamping et al., 2007). Rhodamine-6G is a valuable dye for these assays; however, if probing other drug pumps, such as the MFS, alternative approaches must be taken. Additionally, when working with highly resistant isolates, it can be difficult to obtain high enough intracellular rhodamine-6G fluorescent signal for adequate detection. A solution to this problem is the use of dyes that only fluoresce intracellularly. For example, fluorescein diacetate is a profluorochrome that diffuses through the cell membrane and is subsequently hydrolyzed into a fluorescent molecule by intracellular esterases (Kolaczkowski, Kolaczkowska, Motohashi, & Michalak, 2009). While effective in high-throughput screening, the requirement for intracellular esterases can also introduce additional experimental variables when compared to inherently fluorescent substrates. Therefore, when working with drug-resistant Candida isolates, an optimal reagent is the lipophobic dye Nile red, which was originally developed to stain lipids in yeast and only fluoresces in the highly hydrophobic environment found within yeast cells (Verstrepen et al., 2004). Nile red is a substrate for both the ABC transporters Cdr1 and Cdr2, as well as the MFS transporter Mdr1 (Ivnitski-Steele et al., 2009). This gives a more global perspective on cellular efflux. Overall, it is important to consider the limitations of each approach and apply multiple assays in parallel to gain a clear picture of an inhibitor’s specificity or the relative contribution of efflux to the drug-resistance phenotype of a given strain.
Critical Parameters/Troubleshooting
Given that the output of these experiments is fluorescence per event, you cannot directly compare results between species. For example, C. albicans is a diploid, and consequently much larger than C. auris, a haploid. Therefore, the brightness of control cells will be different and cannot be compared. However, fold differences can be used as a proxy to compare relative effects of treatments or genetic alterations.
While we have found this data to be highly reproducible, these experiments should always be performed in biological triplicate to ensure reproducibility. To maximize reproducibility, ensure that the time it takes to prepare all samples after the 20-min Nile red incubation is consistent between replicates. This can vary dramatically based on sample number, and is therefore a key variable to be cognizant of. Additionally, it is helpful to integrate controls into each experiment. These can include a strain with a known efflux pump deleted, such as CDR1, or a strain treated with an efflux inhibitor, such as the Cdr1 inhibitor Enniatin A (Szczepaniak et al., 2015).
Finally, if the Nile red signal is too low to discriminate a signal above background levels, or so high that it is out of the measurable range of the flow cytometer, the concentration of Nile red can be optimized accordingly. Alternatively, this protocol can easily be adapted for other fluorescent dyes including rhodamine-6G, which has been included in this protocol.
Statistical Analysis
To analyze results with statistical power, experiments should be repeated in biological triplicate. For each replicate, calculate the fold change in the median channel PE fluorescence (MCF) of each treatment sample compared to the Nile red—stained control (e.g., MCF Nile red + Drug/MCF Nile red-Drug). These fold-change values can then be used to determine if there is a significant difference in the magnitude of Nile red accumulation between different treatments using a Student t-test. You cannot compare raw median channel PE fluorescence values, as the CytExpert software automatically optimizes the gain for each experiment, and, therefore, the data must be normalized to internal controls each time.
Understanding Results
Data produced at the end of Basic Protocol 2 should appear similar to Figure 5B, with a rightward shift in the histogram in populations stained with Nile red compared to unstained, and a further shift upon treatment with an efflux inhibitor (or a strain with a major efflux pump deleted). When using the Alternate Protocol, a similar trend should be seen, with no fluorescence detected in unstained samples and consecutive increases in brightness with stained and treated samples (Fig. 6).
Time Considerations
After preparation of overnight cultures, which takes 2 days from glycerol stocks, the remainder of Basic Protocol 1 takes ~3.5 hr depending on the duration of the subculturing step. Basic Protocol 2 takes under an hour depending on the number of samples. The Alternate Protocol takes approximately 30 min to image all samples.
Acknowledgments
K.R.I. is supported by an Ontario Graduate Scholarship. L.E.C. is supported by the Canadian Institutes of Health Research Foundation Grant (FDN-154288), two National Institutes of Health NIAID R01 Grants (1R01AI127375-01 and 1R01AI120958 – 01A1), and a National Institutes of Health NIAID R21 Grant (1R21AI141080-01). L.E.C. is a Canada Research Chair (Tier 1) in Microbial Genomics & Infectious Disease and co-Director of the CIFAR Fungal Kingdom: Threats & Opportunities program.
Literature Cited
- Campbell BC, Chan KL, & Kim JH (2012). Chemosensitization as a means to augment commercial antifungal agents. Frontiers in Microbiology, 3, 1–20. doi: 10.3389/fmicb.2012.00079. [DOI] [PMC free article] [PubMed] [Google Scholar]
- Centers for Disease Control and Prevention. (2019). Antibiotic resistance threats in the United States. Atlanta, GA: CDC. doi: CS239559-B. [Google Scholar]
- Fisher MC, Hawkins NJ, Sanglard D, & Gurr SJ (2018). Worldwide emergence of resistance to antifungal drugs challenges human health and food security. Science, 360(6390), 739–742. doi: 10.1126/science.aap7999. [DOI] [PubMed] [Google Scholar]
- Hiraga K, Wanigasekera A, Sugi H, Hamanaka N, & Oda K (2001). A novel screening for inhibitors of a pleiotrophic drug resistant pump, Pdr5, in Saccharomyces cerevisiae. Bioscience, Biotechnology and Biochemistry, 65(7), 1589—1595. doi: 10.1271/bbb.65.1589. [DOI] [PubMed] [Google Scholar]
- Holmes AR, Cardno TS, Strouse JJ, Ivnitski-Steele I, Keniya MV, Lackovic K, … Cannon RD (2016). Targeting efflux pumps to overcome antifungal drug resistance. Future Medicinal Chemistry, 8(12), 1485–1501. doi: 10.4155/fmc-2016-0050. [DOI] [PMC free article] [PubMed] [Google Scholar]
- Holmes AR, Keniya MV, Ivnitski-Steele I, Monk BC, Lamping E, Sklar LA, & Cannon RD (2012). The monoamine oxidase A inhibitor clorgyline is a broad-spectrum inhibitor of fungal ABC and MFS transporter efflux pump activities which reverses the azole resistance of Candida albicans and Candida glabrata clinical isolates. Antimicrobial Agents and Chemotherapy, 56(3), 1508–1515. doi: 10.1128/AAC.05706-11. [DOI] [PMC free article] [PubMed] [Google Scholar]
- Ivnitski-Steele I, Holmes AR, Lamping E, Monk BC, Cannon RD, & Sklar LA (2009). Identification of Nile red as a fluorescent substrate of the Candida albicans ATP-binding cassette transporters Cdr1p and Cdr2p and the major facilitator superfamily transporter Mdr1p. Analytical Biochemistry, 394(1), 87–91. doi: 10.1016/j.ab.2009.07.001. [DOI] [PMC free article] [PubMed] [Google Scholar]
- Kolaczkowski M, Kolaczkowska A, Motohashi N, & Michalak K (2009). New high-throughput screening assay to reveal similarities and differences in inhibitory sensitivities of multidrug ATP-binding cassette transporters. Antimicrobial Agents and Chemotherapy, 53(4), 1516–1527. doi: 10.1128/AAC.00956-08. [DOI] [PMC free article] [PubMed] [Google Scholar]
- Kolaczkowski M, Van der Rest M, Cybularz-Kolaczkowska A, Soumillion JP, Konings WN, & Goffeau A (1996). Anticancer drugs, ionophoric peptides, and steroids as substrates of the yeast multidrug transporter Pdr5p. Journal of Biological Chemistry, 271(49), 31543–31548. doi: 10.1074/jbc.271.49.31543. [DOI] [PubMed] [Google Scholar]
- Lamping E, Monk BC, Niimi K, Holmes AR, Tsao S, Tanabe K, … Cannon RD (2007). Characterization of three classes of membrane proteins involved in fungal azole resistance by functional hyperexpression in Saccharomyces cerevisiae. Eukaryotic Cell, 6(7), 1150–1165. doi: 10.1128/EC.00091-07. [DOI] [PMC free article] [PubMed] [Google Scholar]
- Lee Y, Puumala E, Robbins N, & Cowen LE (2020). Antifungal drug resistance: Molecular mechanisms in Candida albicans and beyond. Chemical Reviews. Online ahead of print. doi: 10.1021/acs.chemrev.0c00199. [DOI] [PMC free article] [PubMed] [Google Scholar]
- Maesaki S, Marichal P, Vanden Bossche H, Sanglard D, & Kohno S (1999). Rhodamine 6G efflux for the detection of CDR1-overexpressing azole-resistant Candida albicans strains. The Journal of Antimicrobial Chemotherapy, 44(1), 27–31. doi: 10.1093/jac/44.1.27. [DOI] [PubMed] [Google Scholar]
- Morschhäuser J (2002, July 18). The genetic basis of fluconazole resistance development in Candida albicans. Biochimica et Biophysica Acta, 1587(2–3), 240–248. doi: 10.1016/S0925-4439(02)00087-X. [DOI] [PubMed] [Google Scholar]
- Prasad R, Banerjee A, Khandelwa NK, & Dhamgaye S (2015). The ABCs of Candida albicans multidrug transporter Cdr1. Eukaryotic Cell, 14(12), 1154–1164. doi: 10.1128/EC.00137-15. [DOI] [PMC free article] [PubMed] [Google Scholar]
- Schuetzer-Muehlbauer M, Willinger B, Egner R, Ecker G, & Kuchler K (2003). Reversal of antifungal resistance mediated by ABC efflux pumps from Candida albicans functionally expressed in yeast. International Journal of Antimicrobial Agents, 22(3), 291–300. doi: 10.1016/S0924-8579(03)00213-9. [DOI] [PubMed] [Google Scholar]
- Singh P, Kaur J, Yadav B, & Komath S (2009). Design, synthesis and evaluations of acridone derivatives using Candida albicans–search for MDR modulators led to the identification of an anti-candidiasis agent. Bioorganic & Medicinal Chemistry, 17(11), 3973–3979. [DOI] [PubMed] [Google Scholar]
- Szczepaniak J, Lukaszewicz M, & Krasowska A (2015). Detection of inhibitors of Candida albicans Cdr transporters using a diS-C3(3) fluorescence. Frontiers in Microbiology, 6(MAR), 1–6. doi: 10.3389/fmicb.2015.00176. [DOI] [PMC free article] [PubMed] [Google Scholar]
- Tanabe K, Lamping E, Adachi K, Takano Y, Kawabata K, Shizuri Y, … Uehara Y (2007). Inhibition of fungal ABC transporters by unnarmicin A and unnarmicin C, novel cyclic peptides from marine bacterium. Biochemical and Biophysical Research Communications, 364(4), 990–995. doi: 10.1016/j.bbrc.2007.10.110. [DOI] [PubMed] [Google Scholar]
- Verstrepen K, Van Laere S, Vercammen J, Derdelinckx G, Dufour J, Pretorius I, … Delvaux F (2004). The Saccharomyces cerevisiae alcohol acetyl transferase Atf1p is localized in lipid particles. Yeast, 21(4), 367–377. doi: 10.1002/yea.1100. [DOI] [PubMed] [Google Scholar]


