Abstract
Fustin is a prominent ingredient of Rhus verniciflua Stokes (Anacardiaceae) and has a wide range of pharmacological and clinical effects. The present study attempted to evaluate the antidiabetic potential of fustin in streptozotocin- and high-fat diet-induced diabetes in rats. The efficacy of fustin 50 mg/kg and 100 mg/kg/day p.o. was studied in 60% of total calories from fat as a high-fat diet along with single-dose administration streptozotocin (50 mg/kg, i.p.) experimentally induced diabetes in rats for 42 days. The mean body weight; blood glucose; and biochemical parameters such as lipid profile, total protein (TP), alanine aminotransferase (ALT), aspartate aminotransferase (AST), malondialdehyde (MDA), tumor necrosis factor-α (TNF-α), insulin, leptin levels, adiponectin levels, glutathione (GSH), superoxide dismutase (SOD), and catalase (CAT) activity in serum were measured. The rats’ weight was maintained in the fustin groups compared to the diabetic control group. Diabetes caused a significant increase in serum levels in blood glucose, lipid profile, MDA, TNF-α, ALT, and AST parameters and a decrease in serum insulin, adiponectin, leptin, GSH, SOD, and CAT compared to healthy rats. The treatment regimen with fustin (50 and 100 mg/kg) significantly restored all serum parameters in test groups. The present study found clinical evidence for the first time regarding the significant antidiabetic property of fustin, which could be a worthwhile candidate for the treatment of diabetes.
1. Introduction
Among all chronic metabolic clinical conditions that occur worldwide, diabetes mellitus (DM) is considered to be one of the most common and prevalent disease conditions. As compared to type 1 DM, the rate of occurrence of type 2 is about 95% of all cases. Type 2 DM is characterized by the complex type of metabolic syndrome where insulin resistance leads to the uncontrolled type of hyperglycemic conditions. The comorbidities associated with type 2 mainly include clinical conditions such as obesity, stroke, and heart diseases.1 Uncontrolled, high-calorie, and high-trans-fat diets are clinically associated with type 2 cases in the present scenario. The complications of type 2 diabetes mainly include genetic predisposition, dietary habits, and sudden lifestyle changes. Obesity is recognized as the most prevalent factor for type 2 diabetes in humans and experimental animal models.2 Streptozotocin (STZ) and nicotinamide are two recognized agents used for induction of clinical diabetes in experimental animal models.3,4 However, the knockout or inherited strains (e.g., db/db and ob/ob mice) of animals are also specifically a choice for an experimental animal model for hyperglycemia.5
Development of type 2 DM with proper insulin resistance and dysregulated insulin function in mice can be achieved by implementing high-fat diet (HFD)-induced models.6 The implications of metabolic properties can exert additive effects with the use of the HFD model.7 Previous reports identified the role of some important pathways responsible for induction of reactive oxygen species in DM such as polyol, advanced glycation end (AGE) products, and autoxidation of glucose.8−10 The commercially available treatment for DM is associated with lifelong utilization of drug therapy, which is prone to the development of life-threatening severe adverse events or clinical complications such as lactic acidosis and frequent hypoglycemic events.11 The treatment regimen includes the usage of drugs such as sulfonylureas, a-glucosidase inhibitors, and biguanides, along with certain nonmedicinal management, which includes diet and exercise therapy.12,13
The traditional herbal medicinal plant Rhus verniciflua Stokes from the family Anacardiaceae is implemented for the treatment of various diseases such as DM (heartwood), helminthiasis, and menstrual problems. Previously reported studies postulated that the heartwood of R. verniciflua is rich in a flavonoid active biocomponent fustin, which is known to have vital clinical effects on diseases, such as rheumatoid arthritis and Alzheimer’s disease.14 The projected protocol study also confirmed the presence of an abundant amount of flavonoid fustin in the orange inner heartwood of the plant R. verniciflua.(14) Another study also demonstrated the promising protective activity of a flavonoid fustin extracted from R. verniciflua Stokes in 6-hydroxydopamine-treated SK-N–SH human neuroblastoma cells.15
Previous reports in the literature demonstrated the significance of the antioxidant property of certain supplementary compounds known to promisingly improve overall diabetic outcomes, especially in chronic conditions where oxidative stress is a crucial contributing factor.16 The widely consumed beverages, such as lemonade, prepared from fruits of this plant have promising antioxidant and antimicrobial activities.17 Furthermore, different sections of the plant, an assortment of therapeutic properties, are used in dealing with different ailments, mainly generalized bacterial infections, asthma, and inflammatory conditions.18 Similarly, other plants of the species Rhus (i.e., R. verniciflua) rich in polyphenolic constituents demonstrate promising antitumor and anti-inflammatory potentials,19 and the bark of verniciflua containing important active constituents such as flavonoid also demonstrates the potent neuroprotective activity and may be a good candidate for enhancing the cognitive type of therapeutic activity.20 In this way, it is critical to investigate the significance of the phytogenic therapeutic activity and the chemical constituents of Rhus typhina L.
However, the detailed antioxidant and the antidiabetic potential of this bioconstituent in a diabetic animal model has not yet been reported. Thus, the current study investigates the antidiabetic activity of fustin in an experimental animal model of diabetes.
2. Results
2.1. Mean Body Weight
2.1.1. Effect of Fustin on the Body Weight of Diabetic Rats
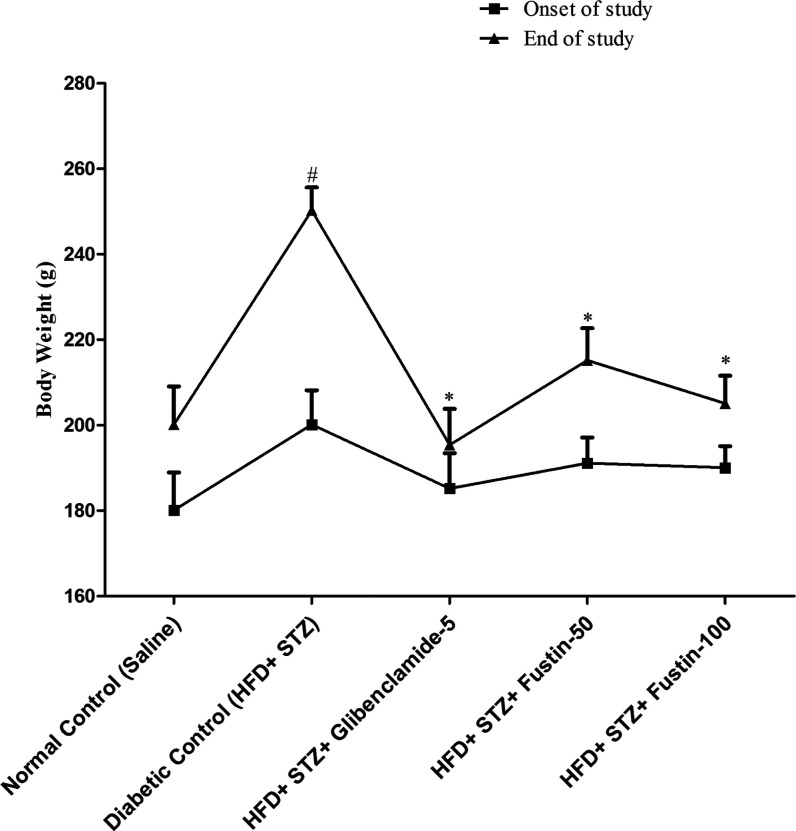
Figure 1 demonstrates that at the end of the study, the mean body weight of rats of the diabetic control group was recorded, whereas the standard drug glibenclamide-treated group significantly restored the body weight of the animals (p < 0.05). The fustin testing group with 50 and 100 mg/kg significantly restored the weight of the animals (p < 0.05), followed by a post hoc test.
Figure 1.
Mean body weight change.
2.2. Blood Glucose
2.2.1. Effect of Fustin on Blood Glucose Levels in Diabetic Rats
Figure 2 shows the effect of fustin on the blood glucose of diabetic rats. The HFD and low-dose STZ-induced diabetic rats exhibited a highly significant elevation (p < 0.001) in blood glucose levels from day 21 onward, indicating the successful induction of diabetes in all groups in comparison to normal control rats, which further increased during the experimental period. After treatment for 6 weeks, glibenclamide 5 mg/kg and fustin 100 mg/kg showed a highly significant decrease (p < 0.001) in blood glucose, whereas fustin 50 mg/kg was found to be moderately significant (p < 0.01) as compared to the diabetic control group (p < 0.001).
Figure 2.
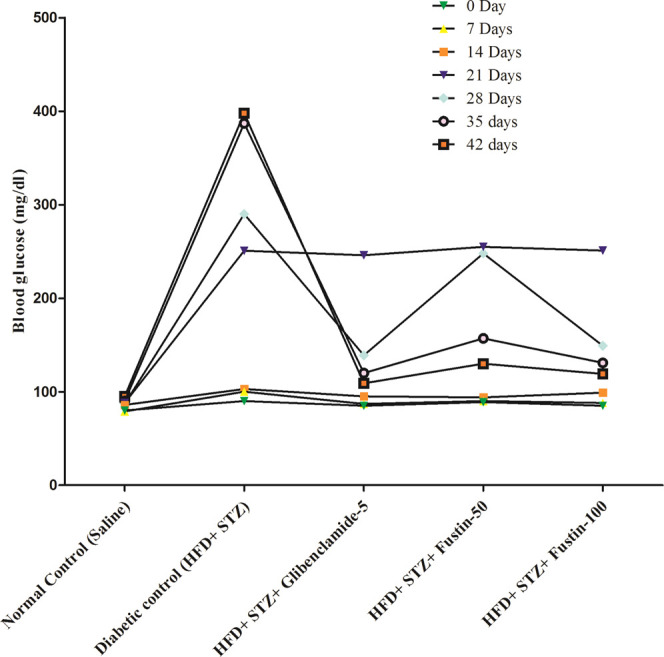
Effect of fustin on blood glucose level in HFD and STZ-induced diabetic rats.
2.3. Lipid Analysis
2.3.1. Effect of Fustin on Lipid Profile in Diabetic Rats
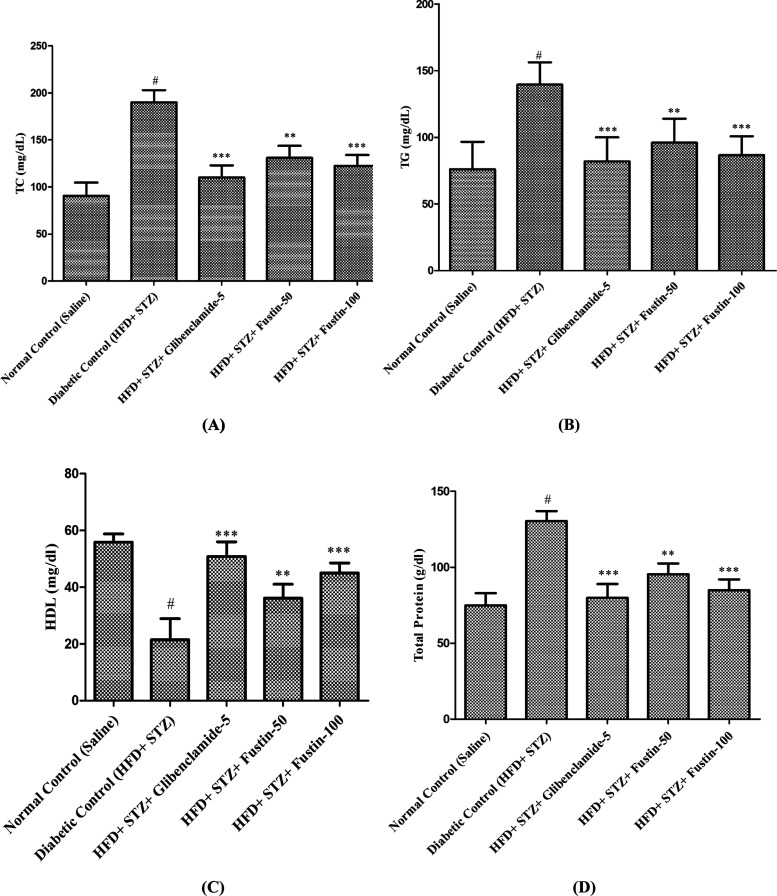
Figure 3A–D demonstrates that on the termination day of the research protocol, the diabetic control group shows a highly significant pathological variance in serum lipid profiles, such as total cholesterol (TC), total protein (TP), triglyceride (TG), and high-density lipoprotein (HDL) levels. In the experimental protocol, the disease (diabetic) control animals exhibit highly significant elevations (p < 0.001) in serum TC, TP, and TG, whereas a significant decrease (p < 0.001) in serum HDL levels is observed compared to the normal control group. Treatment schedule with standard drug glibenclamide 5mg/kg and test drug fustin 100mg/kg more significantly attributed the elevated concentrations of serum lipid contour mainly TC, TP, and TG (p<0.001) in experimental protocol whereas, significantly restoring the levels of HDL in both groups. Treatment schedule with the lower dose of fustin 50 mg/kg moderately decreases (p<0.01) the levels of TC and TP, and less significantly decreases the levels of TG and significantly restored the serum levels of HDL (p<0.05) by one-way ANOVA followed by post hoc parametric test analysis. The treatment schedule with the lower dose of fustin 50 mg/kg moderately decreases (p < 0.01) the levels of total cholesterol and total protein, less significantly decreases the levels of triglyceride, and significantly restores the serum levels of HDL (p < 0.05) by one-way analysis of variance (ANOVA), followed by a post hoc parametric test analysis.
Figure 3.
Effect of fustin on the lipid profile level in HFD and STZ-induced diabetic rats. (A) TC, total cholesterol; (B) TG, triglycerides; (C) HDL, high-density lipoprotein; and (D) TP, total protein.
2.4. Serum Biochemical Analysis
2.4.1. Effect of Fustin on Serum Alanine Aminotransferase (ALT) and Aspartate Aminotransferase (AST) Levels in HFD and Low-Dose STZ-Induced Diabetic Rats
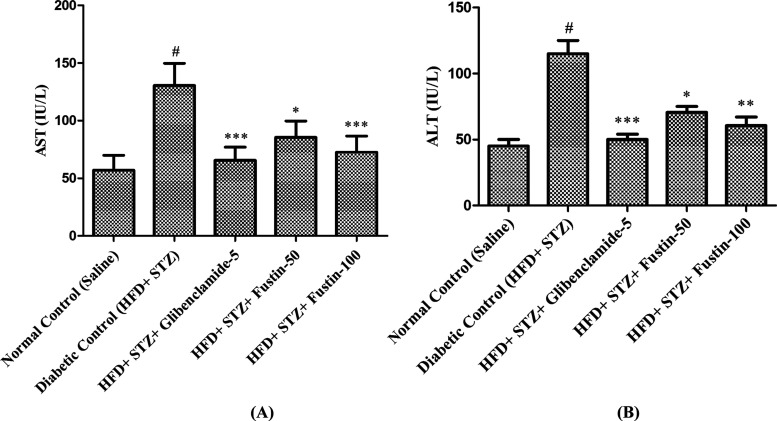
Figure 4A,B clearly shows that after termination of treatments in the experimental protocol, the diabetic control group exhibited a remarkable increase (p < 0.001) in the serum levels of ALT and AST compared to the normal control groups. The treatment schedule with the standard drug glibenclamide 5 mg/kg and the test drug fustin 100 mg/kg significantly decreases (p < 0.001) ALT in the standard drug treatment protocol and moderately decreases (p < 0.01) the serum levels of AST in both the test and the standard control groups. Treatment with a low dose of the test drug fustin 50 mg/kg less significantly (p < 0.05) diminishes the elevated levels of serum ALT and AST.
Figure 4.
Effect of fustin on serum (A) AST, aspartate aminotransferase and (B) ALT, alanine aminotransferase levels in HFD and STZ-induced diabetic rats.
2.5. Insulin, Leptin, and Adiponectin Analysis
2.5.1. Effect of Fustin on Serum Insulin, Leptin, and Adiponectin in HFD and Low-Dose STZ-Induced Diabetic Rats
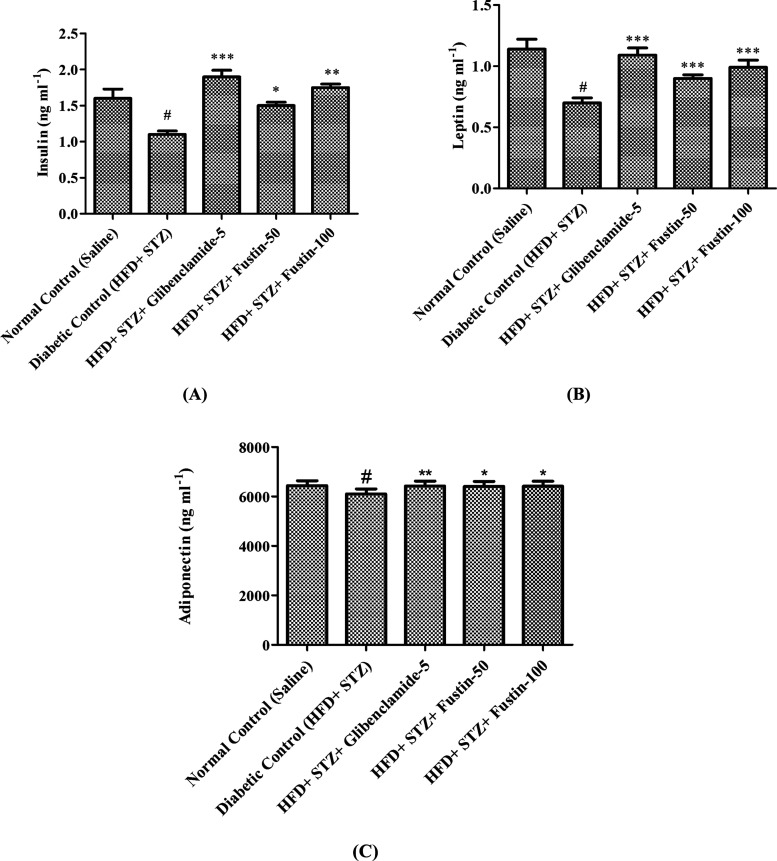
Results of the experimental study revealed a remarkable decrease (p < 0.001) in the serum levels of insulin, leptin, and adiponectin in the diabetic controls as compared to the normal control animals. The treatment schedule with the standard drug glibenclamide 5 mg/kg and the test drug fustin 100 mg/kg moderately decreases (p < 0.01) the fluctuated serum FFA levels such as leptin, adiponectin, and insulin as compared to the diabetic control groups and less significantly restores the elevated levels of insulin, leptin, and adiponectin as compared to the disease control groups (diabetes-induced group) with a low dose of the test drug fustin 50 mg/kg (p < 0.05) (Figure 5A–C).
Figure 5.
Effect of fustin on serum (A) insulin, (B) leptin, and (C) adiponectin in HFD and STZ-induced diabetic rats.
2.6. Oxidative Stress Biomarkers
2.6.1. Effect of Fustin on Hepatocyte Biomarkers of Oxidative Stress and TNF-α in HFD and STZ-Induced Diabetes in Rats
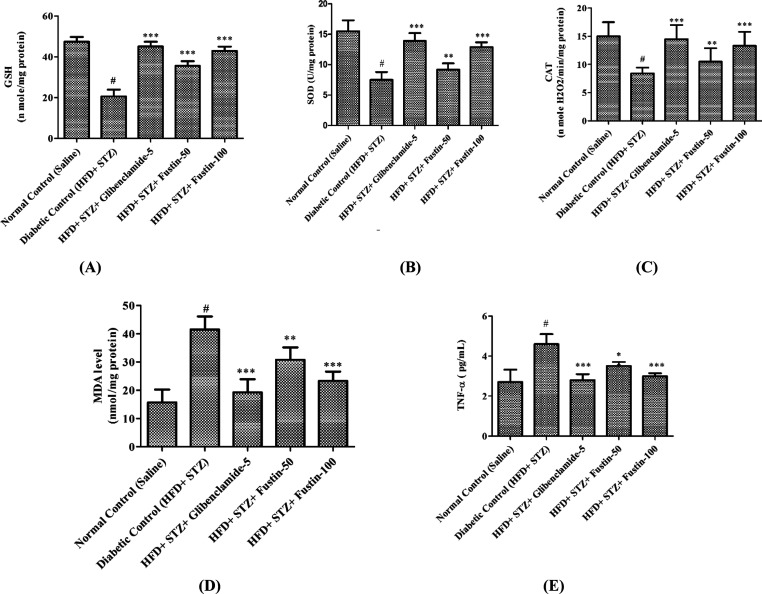
At the end of the experimental protocol, it was observed that the diabetic control animals had a remarkable decrease (p < 0.001) in intracellular levels of glutathione (GSH), superoxide dismutase (SOD), and catalase (CAT) activity, whereas a significant increase (p < 0.001) in malondialdehyde (MDA) and TNF-α as compared to the normal control groups was observed. The treatment regimen with the standard drug glibenclamide 5 mg/kg and the test drug fustin 100 mg/kg more significantly decreases (p < 0.001) the elevated intracellular indices of MDA and TNF-α. Furthermore, it restores the suppressed antioxidant enzymes GSH, SOD, and CAT as compared to the diabetic control groups. However, a low dose of the test drug fustin 50 mg/kg less significantly [(p < 0.01) and (p < 0.05)] restores the elevated intracellular levels of MDA and TNF-α as compared to the diabetic control groups and moderately increases (p < 0.01) the levels of GSH, SOD, and CAT (Figure 6A–E).
Figure 6.
Effect of fustin on hepatic markers of oxidative stress and TNF-α in STZ and HFD-induced diabetic rats. (A) GSH, reduced glutathione; (B) SOD, superoxide dismutase; (C) CAT, catalase activity; (D) MDA, malondialdehyde; and (E) TNF-α, tumor necrosis factor-α.
3. Discussion
In comparison, in the analysis between the normal control and the HFD and STZ-induced diabetes rats, diabetic rats show specific clinical symptoms of diabetes, which mainly include a reduction in body weight, polydipsia, and hyperglycemia.21,22 Similar to a previously reported study,22 in the present study, there is a remarkable reduction in body weight that occurs in HFD and STZ treatment at the end of the study. Moreover, treatment with HFD and STZ during 12 weeks significantly decreases the body weight in all treated groups, whereas HFD-fed rats show increased body weight and after administration of STZ, a progressive reduction in body weight was observed in the experimental groups. The underlying clinical correlation behind the reduction of weight was assumed to be insulin deficiency that leads to protein and fat catabolism.21 Similarly, another set of protocols on diabetes postulated that rats of the HF-STZ group showed elevated levels of serum glucose when subjected to analysis for serum blood on days 16th and 18th, indicating that HF-STZ is an efficient tool for induction of diabetes in an animal model. This clinical elucidation helps us to select a proper model for evaluating the antidiabetic potential of fustin in the present study.23
Earlier investigations have identified the significance of abnormal serum lipid levels in microvascular complications associated with diabetes.24 Previously reported data postulated the efficacy of extraction of Embelia ribes on diabetes-induced dyslipidemia in experimental animal models. In view of histopathological abnormalities in the experimental animal group treated with HFD and STZ, type 2 diabetes revealed abnormality in hepatic tissue associated with lipid and fat accumulation. However, animal groups treated with E. ribes extract demonstrated a remarkable reduction in lipid accumulation in hepatocytes. The mechanism through which fat reduction was achieved includes the inhibition of lipase activity from the pancreas, which is a fruitful outcome for the treatment of metabolic disorders and obesity.25
The previously reported data on type 2 diabetes revealed that liver stenosis and lipid dysfunction type of metabolic disorders had a high rate of prevalence among patients. This study also focuses on type 2 DM and the contribution of infrared in the development of liver-associated problems such as hepatocyte steatosis, decreased lipolysis, increased free fatty acids (FFAs), and liver lipid accumulations.26 Several other investigators also demonstrated that the HFD and STZ animal models displayed increased hepatic triglyceride and abnormal lipid counts along with a remarkable elevation of liver pathogenic biomarkers in the serum.21,22,27
Similarly, some of the important investigations stated that classes of adipokines, specifically free fatty acid, adiponectin, and leptin, are important biomarkers and have key roles in the pathology of type 2 diabetes. In this study, free fatty acids and their abnormal serum concentrations are crucial biomarkers for the pathogenesis of type 2 diabetes and its connections to β-cell dysfunctions where serum levels, mainly leptin, adiponectin, and free fatty acids (FFAs), are significantly decreased in diabetic conditions.28 An antidiabetic study of E. ribes extract postulated that there is a significant reduction of serum FFA levels of leptin and adiponectin in the diabetic control group, whereas the animal group treated with E. ribes significantly improves the circulating levels of these FFAs in the serum.29 This investigation clearly demonstrated that serum leptin and adiponectin levels are remarkably decreased in the diabetes-treated group as compared to the normal control groups, and this postulation was clinically correlated in the present study where the treatment group that received fustin efficiently increased the adipokine profiling, such as leptin and adiponectin. Previously reported studies also show that the HFD model or obesity is an important contributing factor for the development of oxidative stress, which gradually increases with the development of diabetes.30,31 In some studies, it was found that an increased level of blood glucose diminishes enzymatic antioxidant levels such SOD and CAT that result in the free radical scavenging activity, which is finally counted for lipid peroxidation.32 The nonenzymatic antioxidant GSH plays a protecting role in oxidative damage to cells, and this antioxidant is majorly found in the liver and involved in the process of liver detoxification. The experimental model for diabetes revealed elevated serum levels of lipid peroxides (MDA). Furthermore, the study also postulated a remarkable reduction in the nonenzymatic activity of SOD, GSH, and CAT from the liver tissue of diabetic rats as compared to the normal control rats. Likewise, in the present study, it was observed that the diabetes control group showed an increased level of MDA and decreased activity of nonenzymatic antioxidant GSH, SOD, and CAT that resulted in significant reflections of oxidative stress to a rodent, which is clinically confirmed via a biochemical analysis. The treatment with fustin as protecting properties against diabetes and HFD-induced oxidative stress. The fustin-treated group when subjected to biochemical analysis demonstrated a significant decrease in the lipid peroxide levels; on other hand, there was a significant increase in the activity of GSH, SOD, and CAT in the group treated with fustin. TNF-α is one of the significant contributing factors in the pathogenesis, and all steps of nonalcoholic steatohepatitis are associated with oxidative stress. The most rationalized therapy regimen for NASH is targeting TNF-α.33 In view of the abovementioned pathway, previously reported studies observed that HFD-treated rats showed a significant increase in hepatic TNF-α and plasma MDA levels. After treatment with the testing drug α-lipoic acid, we observed a significant reduction of the inflammatory biomarker TNF-α, which concurrently reduces oxidative stress in rodents.34 Hence, the reported study strongly put forward TNF-α as an important biomarker in oxidative stress. Similarly, based upon the hypothesis, we postulated the role of fustin against TNF-α-associated oxidative stress in an experimental diabetes model. In our study, we observed that the diabetes-treated group showed a remarkable increase in serum TNF-α (p < 0.001) levels. Furthermore, the fustin-treated group showed a significant reduction in TNF-α levels (p < 0.001).
4. Conclusions
In this study, induction of diabetes with the administration of HFD and STZ resulted in weight reduction; increased blood glucose levels; abnormal liver profile; dyslipidemia; and abnormal serum levels of certain hormones such as insulin, leptin, and adiponectin through biochemical findings. The underlying molecular mechanisms of action are probably involved, and the ability of fustin to exert strong antioxidant effects by regulating stress biomarkers, mainly TNF- α, and producing a reverse effect on low serum levels of adiponectin and leptin is observed in HFD and STZ in the diabetes-induced rat model. The present study found clinical evidence for the first time regarding the significant antidiabetic antihyperlipidemic activities. Further, fustin also suppressed elevated liver function enzymes and oxidative stress. Findings and analysis of different biochemical and intracellular enzyme levels clearly show that fustin may be a potential candidate in the development of economical phytochemical alternatives for the prognosis of diabetes and its complications. In the future, fustin will be a pivotal candidate for the treatment of metabolic syndrome if preclinical data are validated for clinical trials.
5. Methodology
5.1. Animals
Wistar rats (150–200 g) were housed in standard laboratory conditions comprising (n = 6) a 12:12 h light/dark cycle module with 24 ± 3 °C temperature and 50–60% controlled humidity. The rats received a 60% total calories fat diet and water ad libitum. The rats were acclimatized for 7 days under standard laboratory conditions. The research protocol was approved for conducting experiments on rodents by the Local Committee of Bioethics (LCBE) (RKDFCP/IAEC/2020/33), and the study was conducted in RKDFCP, India.
5.2. Drugs and Chemicals
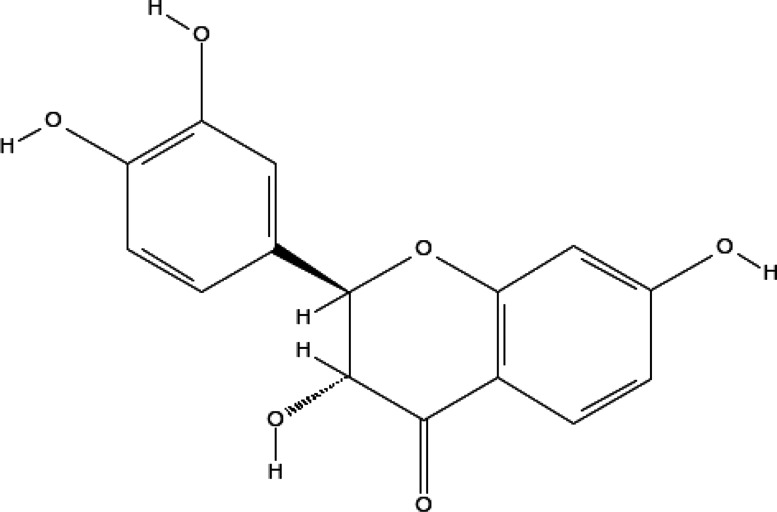
STZ was purchased from (Sigma-Aldrich). Fustin (Figure 7), dimethyl sulfoxide (DMSO), and all other consumables utilized for the experiments were of analytical standards.
Figure 7.
Fustin structure.
5.3. Experimental Design
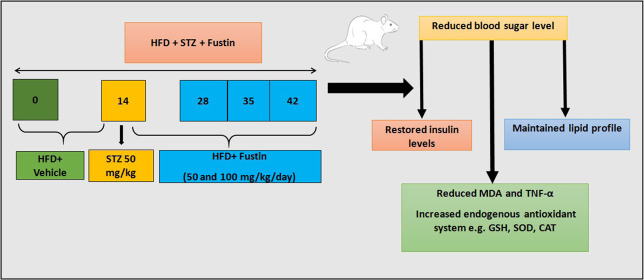
The present experimental study design was based on previously reported studies with slight modification.23,35,36 Rats with more than 250 mg/dL levels of fasting blood glucose levels were considered for the study and randomized into five groups (n = 6). All of the rats that were tested were subjected to a 60% total calories high-fat diet until the end of the study, i.e., 6 weeks. After 2 weeks, i.e., on the 14th day of the study, the rats were subjected to overnight fasting for 12 h and administered a 50 mg/kg, i.p., single dose of STZ prepared in a 0.1 M cold citrate buffer (pH 4.5). The design of the experimental protocol is shown in Figure 8. The treatment was initiated on the 14th day post-STZ administration, which was considered as the first day of the regimen, and continued thereafter for 4 weeks with glibenclamide (5 mg/kg p.o.) and fustin (50 and 100 mg/kg/day p.o.) as standard and test groups soluble with DMSO, respectively. The normal and diabetic control groups received vehicles via an oral route during the said period. Blood glucose was measured every week, and the body weight at the onset and at the end of the study. At the end of the investigation (6 weeks), the animals were placed individually for 24 h in metabolic cages. For obtaining blood samples, the animals were given mild anesthesia and blood was taken from the retro-orbital sinus using heparinized capillary tubes, and the serum was separated by centrifugation of blood at 4000 rpm for 10 min and subjected to biochemical estimation.
Figure 8.
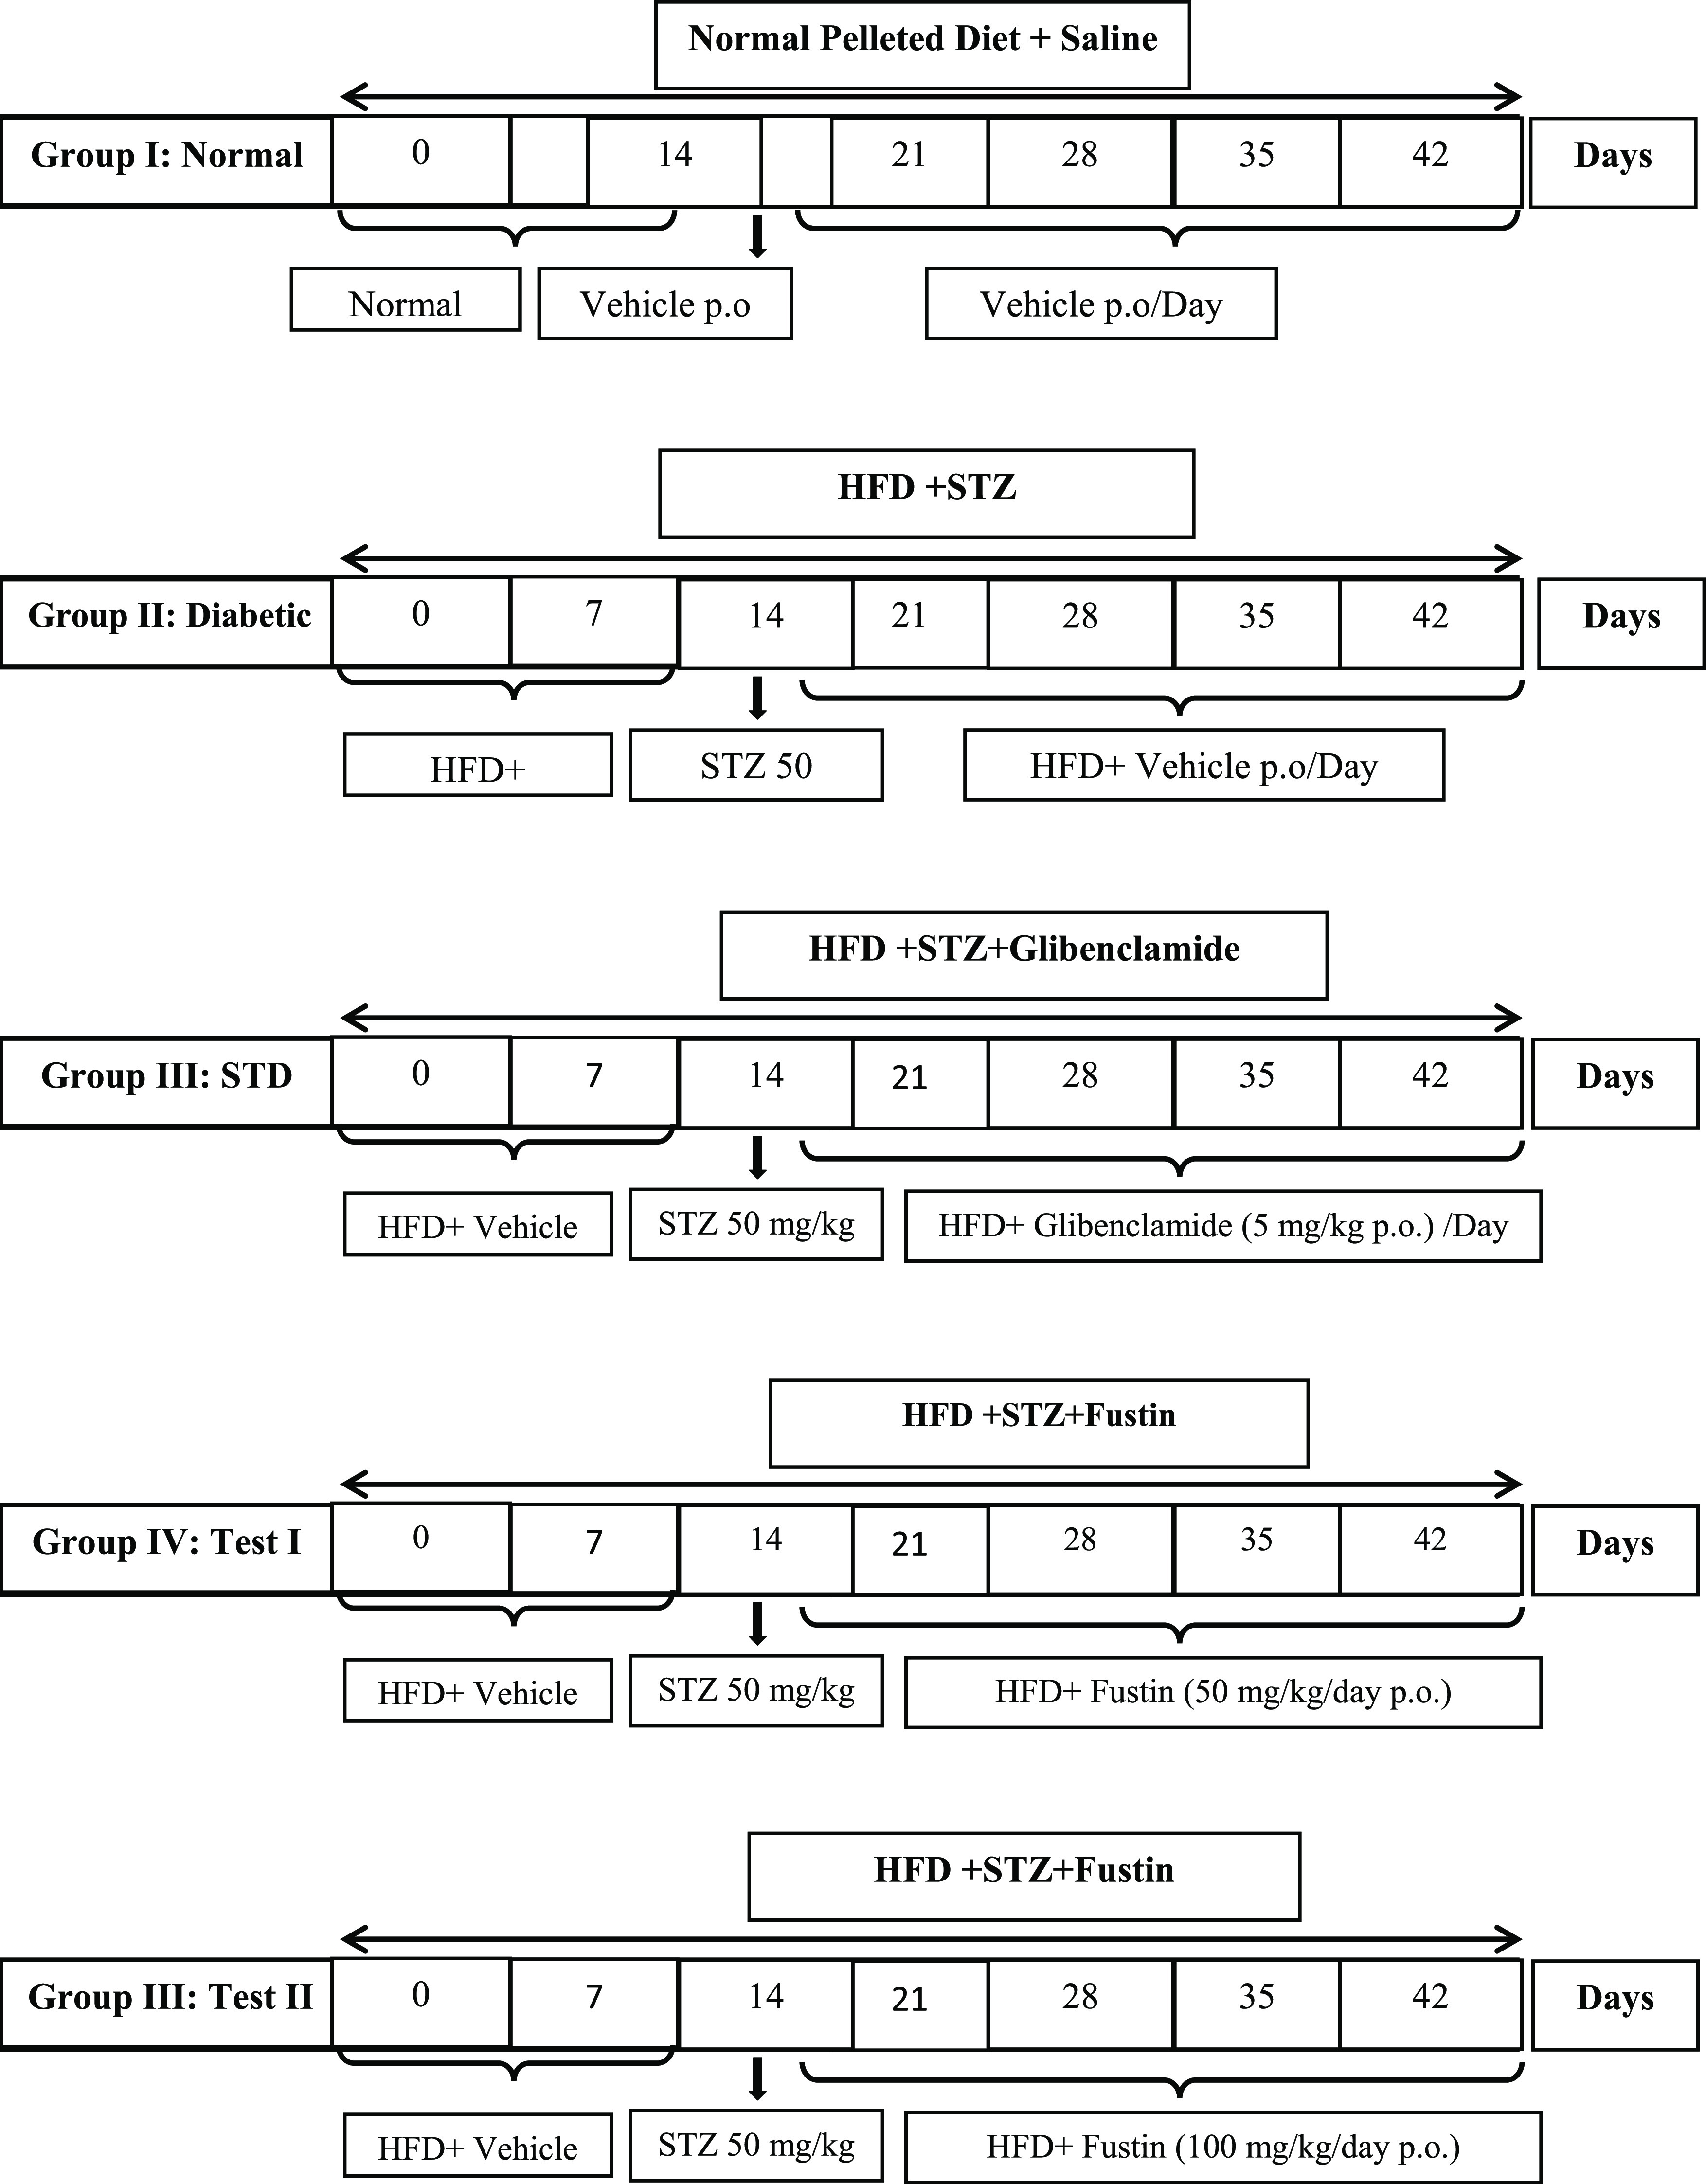
Experimental design.
5.4. Biochemical Evaluation in Serum
5.4.1. Serum Lipid, Liver Test, and TNF-α Estimation
Serum lipids, ALT, AST, and TNF-α were determined following the manufacturer’s instructions. Briefly, the samples were diluted at 1:101 or 1:20, respectively, with buffer, incubated for 60 min at 37° in a 96-well plate according to protocols of washing and incubation cycles, together with controls and the required reagents. Parameters were quantified using a microplate reader adhering to the manufacturer’s instructions and using assay kits by enzymatic methods.
5.4.2. Determination of Serum Leptin, Adiponectin, and Insulin
Serum leptin, adiponectin, and insulin levels were measured using ELISA kits and previously mentioned methods and protocols suggested by manufacturers with slight modifications. Following protocol, serum was separated from animals and centrifuged at 14 000 rpm for 10 min. The desired number of coated strips were placed in a holder, and standard (e.g., insulin, leptin, and adiponectin), control, and serum samples were pipetted into appropriate wells. After adding working insulin enzyme conjugates, the samples were incubated for 60 min at 20–25 °C. After incubating three times, the samples were washed with 300 μL of wash buffer. After adding 100 μL of TMB substrate, the samples were subjected to incubation at room temperature for 15 min. After the final incubation, the required quantity of stopping solution was added to all wells and subjected to absorbance reading on a monochromatic microplate reader at 450 nM.37
5.4.3. Biochemical Indicator Assessment
The biochemical indicator assessment was performed based on a previously reported study.22 Serum estimation of oxidative stress biomarkers was carried out according to a previously reported study with slight modification. In the assessment, a specimen organ (liver) was removed from each group with 10% w/v and homogenized separately with a homogenizer. For the estimation of the presence of different protein contents, the specimens were homogenized in 7.4 pH phosphate buffer saline (PBS) of conc. 10 and 50 mM for determination of malondialdehyde (MDA) by thiobarbituric acid reactive substances and the reduction in glutathione (GSH) level, superoxide dismutase (SOD), and the catalase (CAT) activity. According to the method for estimation of protein presented by Rosebrough et al., the obtained tissue homogenate was subjected to centrifugation at 10 000 rpm for 15 min.38 The pink chromogen produced indicates formation of MDA as the final product. MDA, an indicator of lipid peroxidation, reacts with TBA and produces TBARS, a pink chromogen, measured spectrophotometrically at 532 nm. A MDA standard was used to obtain a standard curve against which absorption of the samples was recorded.39 Similarly, GSH produced a yellow compound on spectrophotometric evaluation at 405 nM on employing commercially available kits and their manufacturers’ instructions for estimation.40 Determination of the CAT enzyme activity based on earlier reported methods by Sinha including colorimetric estimation at 570 nM in the presence of hydrogen peroxide and glacial acetic acid was carried out.41
Determination of the superoxide dismutase enzyme activity was performed by employing a 96-well microplate reader at 490 nM, available commercial kits, and the manufacturers’ instructions for use to indicate the required amount of protein to inhibit auto-oxidation of 6-hydroxydopamine.42
5.5. Statistical Analysis
The data were analyzed using a Windows-based software (GraphPad Prism) version 5.02. Results of the present study are expressed as mean ± standard error of the mean (SEM). One-way analysis of variance (ANOVA), followed by Tukey’s multiple comparison test, was performed to test the significance levels and plot the difference between the variables among each group. p values of less than 0.05 were considered statistically significant.
Acknowledgments
This research was funded by the Deanship of Scientific Research at Princess Nourah bint Abdulrahman University through the Fast-track Research Funding Program to support publication in the top journal (Grant no. 42-FTTJ- 86).
Author Contributions
S.J.G. and N.S. conducted the experiments and wrote the manuscript. I.K. designed the study. M.N.B.-J. critically revised the manuscript. F.A.A.-A. and M.S.N. interpreted the experimental data. M.A. approved the final version of the manuscript.
The authors declare no competing financial interest.
References
- Yu S.-H.; Chen S.-Y. T.; Li W.-S.; Dubey N. K.; Chen W.-H.; Chuu J.-J.; Leu S.-J.; Deng W.-P. Hypoglycemic activity through a novel combination of fruiting body and mycelia of Cordyceps militaris in high-fat diet-induced type 2 diabetes mellitus mice. J. Diabetes Res. 2015, 2015, 723190 10.1155/2015/723190. [DOI] [PMC free article] [PubMed] [Google Scholar]
- Tucker K. L.; Buranapin S. Nutrition and aging in developing countries. J. Nutr. Biochem. 2001, 131, 2417S–2423S. 10.1093/jn/131.9.2417S. [DOI] [PubMed] [Google Scholar]
- Nakamura T.; Terajima T.; Ogata T.; Ueno K.; Hashimoto N.; Ono K.; Yano S. Establishment and pathophysiological characterization of type 2 diabetic mouse model produced by streptozotocin and nicotinamide. Biol. Pharm. Bull. 2006, 29, 1167–1174. 10.1248/bpb.29.1167. [DOI] [PubMed] [Google Scholar]
- Szkudelski T. Streptozotocin–nicotinamide-induced diabetes in the rat. Characteristics of the experimental model. Exp. Biol. Med. 2012, 237, 481–490. 10.1258/ebm.2012.011372. [DOI] [PubMed] [Google Scholar]
- Drel V. R.; Mashtalir N.; Ilnytska O.; Shin J.; Li F.; Lyzogubov V. V.; Obrosova I. G. The leptin-deficient (ob/ob) mouse: a new animal model of peripheral neuropathy of type 2 diabetes and obesity. Diabetes 2006, 55, 3335–3343. 10.2337/db06-0885. [DOI] [PubMed] [Google Scholar]
- Commerford S. R.; Bizeau M. E.; McRae H.; Jampolis A.; Thresher J. S.; Pagliassotti M. J. Hyperglycemia compensates for diet-induced insulin resistance in liver and skeletal muscle of rats. Am. J. Physiol.: Regul., Integr. Comp. Physiol. 2001, 281, R1380–R1389. 10.1152/ajpregu.2001.281.5.R1380. [DOI] [PubMed] [Google Scholar]
- Zhang X.; Cui Y.; Fang L.; Li F. Chronic high-fat diets induce oxide injuries and fibrogenesis of pancreatic cells in rats. Pancreas 2008, 37, e31–e38. 10.1097/MPA.0b013e3181744b50. [DOI] [PubMed] [Google Scholar]
- Turk Z. Glycotoxines, carbonyl stress and relevance to diabetes and its complications. Physiol. Res. 2010, 59, 147–156. 10.33549/physiolres.931585. [DOI] [PubMed] [Google Scholar]
- de M Bandeira S.; Da Fonseca L. J. S.; Guedes D. S.; Rabelo L. A.; Goulart M. O.; Vasconcelos S. M. L. Oxidative stress as an underlying contributor in the development of chronic complications in diabetes mellitus. Int. J. Mol. Sci. 2013, 14, 3265–3284. 10.3390/ijms14023265. [DOI] [PMC free article] [PubMed] [Google Scholar]
- Nowotny K.; Jung T.; Höhn A.; Weber D.; Grune T. Advanced glycation end products and oxidative stress in type 2 diabetes mellitus. Biomolecules 2015, 5, 194–222. 10.3390/biom5010194. [DOI] [PMC free article] [PubMed] [Google Scholar]
- Moller D. E. New drug targets for type 2 diabetes and the metabolic syndrome. Nature 2001, 414, 821–827. 10.1038/414821a. [DOI] [PubMed] [Google Scholar]
- Florez H.; Luo J.; Castillo-Florez S.; Mitsi G.; Hanna J.; Tamariz L.; Palacio A.; Nagendran S.; Hagan M. Impact of metformin-induced gastrointestinal symptoms on quality of life and adherence in patients with type 2 diabetes. Postgrad. Med. 2010, 122, 112–120. 10.3810/pgm.2010.03.2128. [DOI] [PubMed] [Google Scholar]
- Bell D. S.; Patil H. R.; O’Keefe J. H. Divergent effects of various diabetes drugs on cardiovascular prognosis. Rev. Cardiovasc. Med. 2013, 14, e107–e122. [DOI] [PubMed] [Google Scholar]
- Kim M.-Y.; Chung I.-M.; Choi D.-C.; Park H.-J. Quantitative analysis of fustin and sulfuretin in the inner and outer heartwoods and stem bark of Rhus verniciflua. Nat. Prod. Sci. 2009, 15, 208–212. [Google Scholar]
- Park B. C.; Lee Y. S.; Park H.-J.; Kwak M.-K.; Yoo B. K.; Kim J. Y.; Kim J.-A. Protective effects of fustin, a flavonoid from Rhus verniciflua Stokes, on 6-hydroxydopamine-induced neuronal cell death. Exp. Mol. Med. 2007, 39, 316–326. 10.1038/emm.2007.35. [DOI] [PubMed] [Google Scholar]
- Wu T.; McCallum J. L.; Wang S.; Liu R.; Zhu H.; Tsao R. Evaluation of antioxidant activities and chemical characterisation of staghorn sumac fruit (Rhus hirta L.). Food Chem. 2013, 138, 1333–1340. 10.1016/j.foodchem.2012.10.086. [DOI] [PubMed] [Google Scholar]
- Kossah R.; Zhang H.; Chen W. Antimicrobial and antioxidant activities of Chinese sumac (Rhus typhina L.) fruit extract. Food Control 2011, 22, 128–132. 10.1016/j.foodcont.2010.06.002. [DOI] [Google Scholar]
- Olchowik E.; Sciepuk A.; Mavlyanov S.; Abdullajanova N.; Zamaraeva M. Antioxidant capacities of polyphenols from Sumac (Rhus typhina L.) leaves in protection of erythrocytes against oxidative damage. Biomed. Prev. Nutri. 2012, 2, 99–105. 10.1016/j.bionut.2011.06.008. [DOI] [Google Scholar]
- Kim K. H.; Moon E.; Choi S. U.; Kim S. Y.; Lee K. R. Polyphenols from the bark of Rhus verniciflua and their biological evaluation on antitumor and anti-inflammatory activities. Phytochemistry 2013, 92, 113–121. 10.1016/j.phytochem.2013.05.005. [DOI] [PubMed] [Google Scholar]
- Cho N.; Lee K. Y.; Huh J.; Choi J. H.; Yang H.; Jeong E. J.; Kim H. P.; Sung S. H. Cognitive-enhancing effects of Rhus verniciflua bark extract and its active flavonoids with neuroprotective and anti-inflammatory activities. Food Chem. Toxicol. 2013, 58, 355–361. 10.1016/j.fct.2013.05.007. [DOI] [PubMed] [Google Scholar]
- Guo C.; Zhang C.; Li L.; Wang Z.; Xiao W.; Yang Z. Hypoglycemic and hypolipidemic effects of oxymatrine in high-fat diet and streptozotocin-induced diabetic rats. Phytomedicine 2014, 21, 807–814. 10.1016/j.phymed.2014.02.007. [DOI] [PubMed] [Google Scholar]
- Silvares R. R.; Pereira E. N. G. dS.; Flores E. E. I.; Estato V.; Reis P. A.; Silva I. J. d.; Machado M. P.; Neto H. C. dC. F.; Tibiriça E.; Daliry A. Combined therapy with metformin and insulin attenuates systemic and hepatic alterations in a model of high-fat diet-/streptozotocin-induced diabetes. Int. J. Exp. Pathol. 2016, 97, 266–277. 10.1111/iep.12184. [DOI] [PMC free article] [PubMed] [Google Scholar]
- Magalhães D. A.; Kume W. T.; Correia F. S.; Queiroz T. S.; Neto A.; Edgar W.; Santos M. P.; Kawashita N. H.; França S. A. High-fat diet and streptozotocin in the induction of type 2 diabetes mellitus: a new proposal. An. Acad. Bras. Cienc. 2019, 91, e20180314 10.1590/0001-3765201920180314. [DOI] [PubMed] [Google Scholar]
- Hammer S. S.; Busik J. V. The role of dyslipidemia in diabetic retinopathy. Vision Res. 2017, 139, 228–236. 10.1016/j.visres.2017.04.010. [DOI] [PMC free article] [PubMed] [Google Scholar]
- Kim G.-N.; Shin M.-R.; Shin S. H.; Lee A. R.; Lee J. Y.; Seo B.-I.; Kim M. Y.; Kim T. H.; Noh J. S.; Rhee M. H.; Roh S.-S. Study of Antiobesity Effect through Inhibition of Pancreatic Lipase Activity of Diospyros kaki Fruit and Citrus unshiu Peel. BioMed. Res. Int. 2016, 2016, 1723042 10.1155/2016/1723042. [DOI] [PMC free article] [PubMed] [Google Scholar]
- Tolman K. G.; Fonseca V.; Dalpiaz A.; Tan M. H. Spectrum of liver disease in type 2 diabetes and management of patients with diabetes and liver disease. Diabetes care 2007, 30, 734–743. 10.2337/dc06-1539. [DOI] [PubMed] [Google Scholar]
- Li Y.-g.; Ji D.-f.; Zhong S.; Lin T.-b.; Lv Z.-q. Hypoglycemic effect of deoxynojirimycin–polysaccharide on high fat diet and streptozotocin-induced diabetic mice via regulation of hepatic glucose metabolism. Chem.-Biol. Interact. 2015, 225, 70–79. 10.1016/j.cbi.2014.11.003. [DOI] [PubMed] [Google Scholar]
- Yaturu S. Obesity and type 2 diabetes. J. Diabetes Mellitus 2011, 1, 79–95. 10.4236/jdm.2011.14012. [DOI] [Google Scholar]
- Bhandari U.; Chaudhari H. S.; Khanna G.; Najmi A. K. Antidiabetic effects of Embelia ribes extract in high fat diet and low dose streptozotocin-induced type 2 diabetic rats. Front. Life Sci. 2013, 7, 186–196. 10.1080/21553769.2014.881304. [DOI] [Google Scholar]
- Chaudhari H. S.; Bhandari U.; Khanna G. Preventive effect of embelin from embelia ribes on lipid metabolism and oxidative stress in high-fat diet-induced obesity in rats. Planta Med. 2012, 78, 651–657. 10.1055/s-0031-1298379. [DOI] [PubMed] [Google Scholar]
- Wang Y.; Campbell T.; Perry B.; Beaurepaire C.; Qin L. Hypoglycemic and insulin-sensitizing effects of berberine in high-fat diet-and streptozotocin-induced diabetic rats. Metabolism 2011, 60, 298–305. 10.1016/j.metabol.2010.02.005. [DOI] [PubMed] [Google Scholar]
- Strugała P.; Dzydzan O.; Brodyak I.; Kucharska A. Z.; Kuropka P.; Liuta M.; Kaleta-Kuratewicz K.; Przewodowska A.; Michałowska D.; Gabrielska J.; et al. Antidiabetic and antioxidative potential of the blue Congo variety of purple potato extract in streptozotocin-induced diabetic rats. Molecules 2019, 24, 3126. 10.3390/molecules24173126. [DOI] [PMC free article] [PubMed] [Google Scholar]
- Marra F.; Lotersztajn S. Pathophysiology of NASH: perspectives for a targeted treatment. Curr. Pharm. Des. 2013, 19, 5250–5269. 10.2174/13816128113199990344. [DOI] [PMC free article] [PubMed] [Google Scholar]
- Sena C. M.; Cipriano M. A.; Botelho M. F.; Seiça R. M. Lipoic acid prevents high-fat diet-induced hepatic steatosis in Goto Kakizaki rats by reducing oxidative stress through Nrf2 activation. Int. J. Mol. Sci. 2018, 19, 2706. 10.3390/ijms19092706. [DOI] [PMC free article] [PubMed] [Google Scholar]
- Kiran G.; Nandini C. D.; Ramesh H.; Salimath P. Progression of early phase diabetic nephropathy in streptozotocin-induced diabetic rats: evaluation of various kidney-related parameters. Indian J. Exp. Biol. 2012, 50, 133–140. [PubMed] [Google Scholar]
- Aydın A. F.; Bingül İ.; Küçükgergin C.; Doğan-Ekici I.; Doğru Abbasoğlu S.; Uysal M. Carnosine decreased oxidation and glycation products in serum and liver of high-fat diet and low-dose streptozotocin-induced diabetic rats. Int. J. Exp. Pathol. 2017, 98, 278–288. 10.1111/iep.12252. [DOI] [PMC free article] [PubMed] [Google Scholar]
- Wilkin T.; Nicholson S.; Casey C. A micro enzyme-linked immunosorbent assay for insulin antibodies in serum. J. Immunol. Methods 1985, 76, 185–194. 10.1016/0022-1759(85)90490-9. [DOI] [PubMed] [Google Scholar]
- Lowry O. H.; Rosebrough N. J.; Farr A. L.; Randall R. J. Protein measurement with the Folin phenol reagent. J. Biol. Chem. 1951, 193, 265–275. 10.1016/S0021-9258(19)52451-6. [DOI] [PubMed] [Google Scholar]
- Ohkawa H.; Ohishi N.; Yagi K. Assay for lipid peroxides in animal tissues by thiobarbituric acid reaction. Anal. Biochem. 1979, 95, 351–358. 10.1016/0003-2697(79)90738-3. [DOI] [PubMed] [Google Scholar]
- Tietze F. Enzymic method for quantitative determination of nanogram amounts of total and oxidized. Ana.l Biochem. 1969, 27, 502–522. 10.1016/0003-2697(69)90064-5. [DOI] [PubMed] [Google Scholar]
- Sinha A. K. Colorimetric assay of catalase. Anal. Biochem. 1972, 47, 389–394. 10.1016/0003-2697(72)90132-7. [DOI] [PubMed] [Google Scholar]
- Crosti N.; Servidei T.; Bajer J.; Serra A. Modification of the 6-hydroxydopamine technique for the correct determination of superoxide dismutase. J. Clin. Chem. Clin. Biochem. 1987, 25, 265–266. [PubMed] [Google Scholar]


