Dear Editor,
The resection of cystic renal masses (CRMs) represents a challenging process in terms of nephron‐sparing surgery because the mostly fluid‐filled growth pattern of renal cancers causes them easy to rupture. 1 As the malignant tumours rupture, cancer cells metastasize in the abdominal cavity, patients face a high risk of recurrence. 2 Meanwhile, studies have shown that more functional nephrons correlate with a better prognosis of patients. 3 Therefore, it is crucial to achieving accurate and complete tumour resection during partial nephrectomy (PN).
The near‐infrared II (NIR‐II, 1000–1700 nm) window fluorescence imaging is a highly promising strategy for medical applications. Based on our experience of image‐guided surgery, 4 a novel NIR‐II fluorescence imaging system was developed for helping the resection of CRM (Supplementary S1). From October 2019 to November 2020, nine patients who underwent PN for resection of CRM were enrolled (Table 1). After exposing tumours, indocyanine green (ICG, 0.5 mg/kg body weight) was injected intravenously, the NIR‐II fluorescence imaging system was used for the visualization of tumours (Figure 1, Supplementary S2). Under the guidance of NIR‐II fluorescence imaging, all tumours were completely resected without rupture, no recurrence or metastasis was found after 4–17 months of follow‐up.
TABLE 1.
Characteristics and preoperative diagnosis of patients with CRM
| Variable | Value |
|---|---|
| Patients, n | 9 |
| Age/year, M (range) | 46 (35–65) |
| Gender, n | |
| Male | 8 |
| Female | 1 |
| Affected side, n | |
| Left | 5 |
| Right | 4 |
| Tumour diameter/mm, M (range) | 48 (27–61) |
| Preoperative eGFR, M (range) | 92 (68–113) |
| RENAL score, M (range) | 8 (4–9) |
| Ischaemia time/min, M (range) | 14 (10–25) |
| Blood loss/ml, M (range) | 100 (10–400) |
| Hospital stay/day, M (range) | 6 (3–6) |
| Pathology | |
| ccRCC | 4 |
| BRC | 4 |
| PKD | 1 |
| Postoperative eGFR, M (range) | 72 (41–105) |
Abbreviations: BRC, benign renal cyst; ccRCC, clear cell renal cell carcinoma; eGFR; estimated glomerular filtration rate; M, median; PKD, polycystic kidney disease.
FIGURE 1.

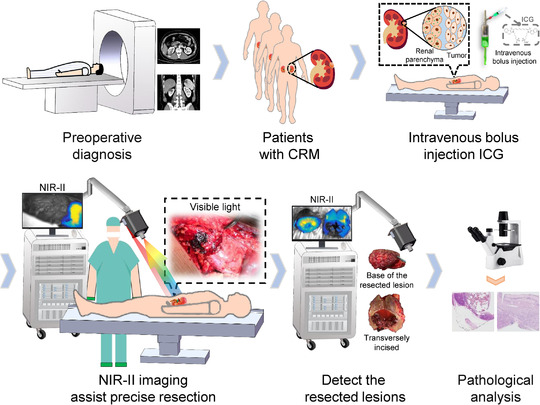
Flow diagram of the study protocol. Patients first received preoperative imaging examinations to determine whether eligible for the study. On the day of surgery, after laparotomy, ICG with a dose of 0.5 mg/kg body weight was administrated intravenously before blocking the renal artery. Then, the tumour boundaries were marked on the kidney surface under the guidance of the NIR‐II images, which were followed by arteries clamping and tumour resection. After resection, images of the surgical margins and resected lesions in the white‐light illumination and NIR‐II region were acquired separately. Lastly, pathological examinations were carried out
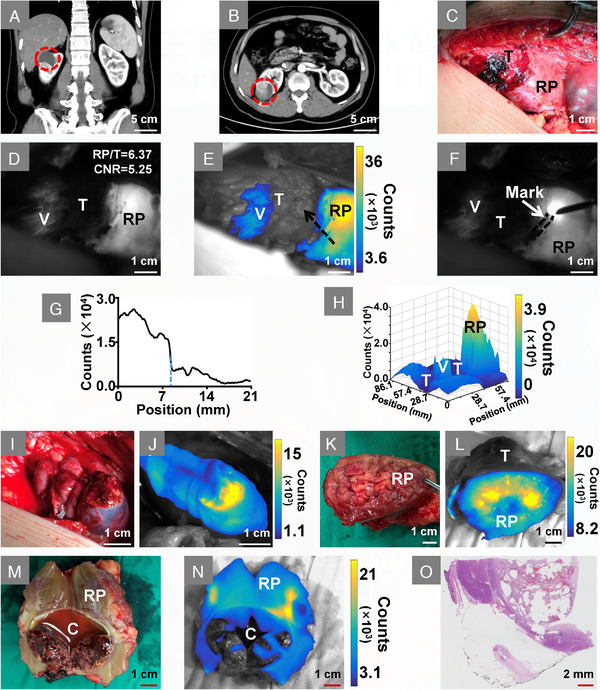
For a representative patient, the enhanced CT examination revealed a renal mass located at the right kidney (Figure 2A and B). After kidney exposure, the surgical region was first imaged under white light illumination (Figure 2C). One minute after ICG injection, NIR‐II fluorescence was observed in renal parenchyma and partial of the tumour vessels. The boundaries between tumour and renal parenchyma were distinct in the NIR‐II fluorescence images (Figure 2D and E), in which the renal parenchyma‐to‐tumour (RP/T, defined in Supplementary S3) fluorescence intensity ratio was 6.37 and the contrast‐to‐noise ratio (CNR, defined in Supplementary S3) was 5.25. Subsequently, tumour boundaries were marked by electrocautery guided by NIR‐II imaging (Figure 2F). Fluorescence signal intensity extracted from the position of the black arrow in Figure 2E showed the intensity weakened sharply from renal parenchyma to tumour (Figure 2G). The three‐dimensional fluorescence distribution map of the imaged area in Figure 2D further showed the signal intensity of renal parenchyma was significantly higher than that of the tumour (Figure 2H), which again proved the efficacy of NIR‐II imaging to detected tumour boundaries. After resection, the visual inspection did not detect residual tumours on the surgical margin (Figure 2I), the NIR‐II imaging also exhibited intense fluorescence (Figure 2J). A similar fluorescence‐guided surgery was conducted on other patients (Figure S1 and Video S1).
FIGURE 2.

Intraoperative NIR‐II image‐assisted tumour resection. (A and B) Coronal‐plane and transverse‐plane of the enhanced CT image, red circle indicates a renal mass located at the right kidney. (C) Visible‐light image of the tumour and renal parenchyma. (D) Fluorescence is observed in renal parenchyma and partial tumour vessels after ICG injection. (E) Overlay image of D, in which fluorescence is shown in pseudo‐colour. (F) Tumour boundaries were marked by electrocautery on the kidney surface, the black dotted line showed the mark traces. (G) Cross‐sectional fluorescence intensity, which was extracted from the position of the black arrow in E. The blue dotted line in G indicates the place where is the boundary between tumour and renal parenchyma. (H) Three‐dimensional mapping of the fluorescence distribution of D. (I) White‐light illumination image of the surgical margins. (J) NIR‐II imaging shows intense fluorescence on the surgical margin. (K) Visible‐light image of the tumour base. (L) Overlay image shows intense fluorescence on the base of the tumour. (M) Visible‐light image of the tumour cavity, the intact internal fluid indicates the tumour is resected without rupture. (N) Overlay image of the tumour cavity. (O) Pathological examination with haematoxylin and eosin staining shows the tumour is ccRCC. Abbreviations: C, tumour cavity; RP, renal parenchyma; T, tumour; V, vessel
Subsequently, resected tissue of the patient was further inspected, intense fluorescence was detected on the base of the lesion (Figure 2K and L). Combining the NIR‐II images of the surgical margin with the visual examination, the tumour was considered to be completely removed. The lesion was then dissected along its maximum axis, the internal fluid in the cavity indicated no rupture occurred during resection (Figure 2M and N). Finally, pathological examination showed the tumour was clear cell renal cell carcinoma (ccRCC) and was completely resected (Figure 2O).
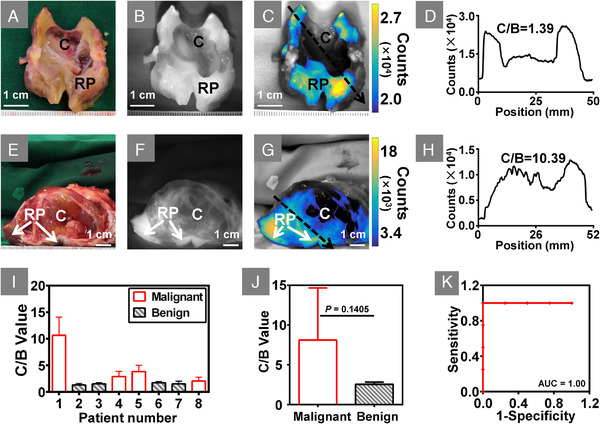
The fluorescence images of the dissected lesions were further analysed. Quantitative analysis showed that NIR‐II imaging was able to identify ccRCC from the resected lesions (Figure 3, Figure S2). For a benign renal cyst transversely incised, almost no fluorescence was exhibited in the tumour cavity (Figure 3A–C). The cross‐sectional fluorescence intensity profile also showed a lower intensity in the tumour cavity (Figure 3D). Conversely, fluorescence was detected in some areas of the tumour cavity of ccRCC (Figure 3E–G), which was proved by the cross‐sectional fluorescence intensity profile (Figure 3H). Eight of the nine resected lesions were dissected and all the tumour cavity‐to‐background (C/B, defined in Supplementary S3) fluorescence intensity ratio of ccRCCs was much higher than those of benign tumours (Figure 3I and J; 4.87 ± 3.40 vs. 1.53 ± 0.15, p = 0.1405). Besides, for each ccRCC, the C/B ratio was greater than 2.0, while the C/B ratio was lower than 1.8 for benign tumours, the receiver operating characteristic analysis about categorizing resected lesions showed the area under the curve (AUC) was 1.00 (Figure 3K).
FIGURE 3.

NIR‐II imaging identified ccRCC from resected lesions. (A) A benign renal cystic tumour was dissected along the maximum axis. (B and C) NIR‐II image and overlay image showed there was almost no fluorescence in the tumour cavity. (D) Cross‐sectional fluorescence intensity corresponding to the location and direction of the black arrow in C, which also demonstrated the lower intensity in the cavity. (E) A ccRCC tumour was dissected along the maximum axis. (F and G) NIR‐II image and overlay image showed some areas of the tumour cavity also appeared fluorescence. (H) Cross‐sectional fluorescence intensity corresponding to the location and direction of the black arrow in G, which also showed the intense fluorescence presented in the tumour cavity. (I) Bar graph of the C/B ratio of each patient, the error bars indicate the standard deviation over all pixels within the region of interest of tumour cavity. (J) The comparison of the average ratio of C/B between benign and malignant tumours. (K) The ROC analysis about discriminating ccRCC by NIR‐II imaging. Abbreviations: C, tumour cavity; RP, renal parenchyma
As shown in the above results, clinical benefits were brought with the use of NIR‐II imaging. ICG‐based traditional first near‐infrared window (700–900 nm) fluorescence imaging of renal tumour is limited to reduce the positive margin rate. 5 The rate of positive surgical margins after nephron‐sparing surgery is as high as nearly 10%. 6 One of the key obstacles is that those small residual tumours on the surgical margins are shadowed by the intense fluorescence of renal parenchyma during fluorescence imaging. In this study, surgical margins and base of the resected lesions received NIR‐II imaging, only when both appeared intense fluorescence was the tumour considered completely removed. Our pilot clinical results demonstrate this approach is an effective method for detecting residual tumours in the condition where normal tissue exhibits higher intense fluorescence than tumours.
The ICG injection dose is an important influence factor of fluorescence imaging during PN. Briefly, different dose causes renal parenchyma appears inadequate fluorescence or otherwise tumours appear undesirable fluorescence. 7 Diverse injection doses have been reported, but not all tumours were successfully detected in the previous studies. 8 , 9 In this trial, ICG at a dose of 0.5 mg/kg body weight was administrated, benefited from the lower auto‐fluorescence and less interfered from the ambient light in the NIR‐II region, tumours were distinctly identified in all patients. The injection dose can be a reference for NIR‐II imaging in other renal‐related researches. Additionally, the ccRCC was identified based on the diversity of C/B ratios between different lesions. Although the relationship between the fluorescence in the tumour cavity and the ICG administration dose needed to be investigated. Our finding highlights the NIR‐II imaging as a potential diagnostic technique that may alter the treatment of CRM.
In summary, the first clinical trial of NIR‐II imaging for the resection of CRM was reported in this study. The novel technique brings benefits to patients, such as no positive surgical margins and no tumour ruptured during resection. In the future, other relevant benefits of the NIR‐II imaging assists CRM resection can be explored.
CONFLICT OF INTERESTS
The authors declare no conflict of interests.
Supporting information
Supplement information
Supplement information
ACKNOWLEDGEMENTS
This study was supported by the National Key Research and Development Program of China (2017YFA0205200), the National Natural Science Foundation of China (62027901, 81930053, 92059207, 81227901, and 82072828), Beijing Natural Science Foundation (JQ19027), the innovative research team of high‐level local universities in Shanghai and the Zhuhai High‐level Health Personnel Team Project (Zhuhai HLHPTP201703). We acknowledge the instrumental and technical support of the multi‐modal biomedical imaging experimental platform, Institute of Automation, Chinese Academy of Sciences.
Contributor Information
Zhenhua Hu, Email: zhenhua.hu@ia.ac.cn.
Jie Tian, Email: tian@ieee.org.
Shudong Zhang, Email: zhangshudong@bjmu.edu.cn.
REFERENCES
- 1. Hindman NM. Imaging of cystic renal masses. Urol Clin North Am. 2018;45:331‐349. [DOI] [PubMed] [Google Scholar]
- 2. Pradere B, Peyronnet B, Delporte G, et al. Intraoperative cyst rupture during partial nephrectomy for cystic renal masses—does it increase the risk of recurrence? J Urol. 2018;200:1200‐1206. [DOI] [PubMed] [Google Scholar]
- 3. Tobis S, Knopf JK, Silvers C, et al. Robot‐assisted and laparoscopic partial nephrectomy with near infrared fluorescence imaging. J Endourol. 2012;26:797‐802. [DOI] [PubMed] [Google Scholar]
- 4. Hu Z, Fang C, Li B, et al. First‐in‐human liver‐tumour surgery guided by multispectral fluorescence imaging in the visible and near‐infrared‐I/II windows. Nat Biomed Eng. 2020;4:259‐271. [DOI] [PubMed] [Google Scholar]
- 5. Secil M, Elibol C, Aslan G, et al. Role of intraoperative US in the decision for radical or partial nephrectomy. Radiology. 2011;258:283‐290. [DOI] [PubMed] [Google Scholar]
- 6. Marszalek M, Carini M, Chlosta P, et al. Positive surgical margins after nephron‐sparing surgery. Eur Urol. 2012;61:757‐763. [DOI] [PubMed] [Google Scholar]
- 7. Angell JE, Khemees TA, Abaza R. Optimization of near infrared fluorescence tumor localization during robotic partial nephrectomy. J Urol. 2013;190:1668‐1673. [DOI] [PubMed] [Google Scholar]
- 8. Veccia A, Antonelli A, Hampton LJ, et al. Near‐infrared fluorescence imaging with indocyanine green in robot‐assisted partial nephrectomy: pooled analysis of comparative studies. Eur Urol Focus. 2020;6:505‐512. [DOI] [PubMed] [Google Scholar]
- 9. Mitsui Y, Shiina H, Arichi N, et al. Indocyanine green (ICG)‐based fluorescence navigation system for discrimination of kidney cancer from normal parenchyma: application during partial nephrectomy. Int Urol Nephrol. 2012;44:753‐759. [DOI] [PubMed] [Google Scholar]
Associated Data
This section collects any data citations, data availability statements, or supplementary materials included in this article.
Supplementary Materials
Supplement information
Supplement information


