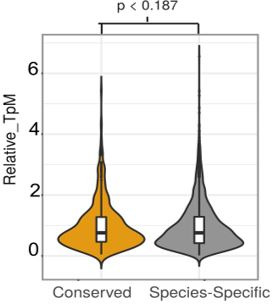
Author response image 1. Conserved and species-specific circRNAs expression distributions.

Violin plots describing relative expression levels of conserved and species-specific circRNAs. circRNA expression is measured in Relative TpM values. The difference in circRNA expression was statistically tested using the Wilcoxon rank-sum test.
