Abstract
Objective:
To determine the dose-response relation between epileptiform activity burden and outcomes in acutely ill patients.
Methods:
Single center retrospective analysis of 1967 neurologic, medical and surgical patients who underwent > 16 hours of continuous EEG between 2011–2017. We developed an AI algorithm to annotate 11.02 terabytes of EEG and quantify epileptiform activity burden within 72 hours of recording. We evaluated burden in 1) the first 24 hours of recording, 2) the 12-hr epoch with highest burden (peak burden), and 3) cumulative through the first 72 hours of monitoring. Machine learning was applied to estimate the effect of epileptiform burden on outcome. Outcome measure was discharge modified Rankin Scale, dichotomized as good (0–4) vs. poor (5–6).
Results:
Peak epileptiform burden was independently associated with poor outcomes (p<0.0001). Other independent associations included age, APACHE II, seizure on presentation, and diagnosis of hypoxic ischemic encephalopathy. Model calibration error was calculated across three strata based on the time interval between last EEG measurement (up to 72 hours of monitoring) and discharge: 1) < 5 days between last measurement and discharge: 0.0941 [CI 0.0706, 0.1191); 5–10 days between last measurement and discharge: 0.0946 [CI 0.0631, 0.1290]; > 10 days between last measurement and discharge: 0.0998 [CI 0.0698, 0.1335]. After adjusting for covariates, increase in peak epileptiform activity burden from 0% to 100% increased the probability of poor outcome by 35%.
Interpretation:
Automated measurement of peak epileptiform activity burden affords a convenient, consistent, and quantifiable target for future multi-center randomized trials investigating whether suppressing epileptiform activity improves outcomes.
Keywords: EEG, Critical care, Seizures, Status epilepticus, machine learning, outcomes research, Acute brain injuries
Introduction
Seizures and seizure-like periodic and rhythmic patterns of brain activity (“epileptiform activity”) occur in up to half of critically ill patients who undergo brain monitoring with electroencephalography (EEG)1–4. In small focused cohorts these patterns have been shown to be associated with increased neurologic disability and mortality, with the probability of a poor outcome rising in proportion to the burden of epileptiform activity1,2,4–8. However, the prognostic relevance of epileptiform activity (EA) burden has not been quantified in a large and heterogeneous cohort spanning the full range of neurological, medical and surgical illnesses. Analysis of continuous EEG data and quantification of EA burden on a large scale not only for prognostic studies, but also for potential therapeutic trials has been limited by the time-consuming nature of reviewing and annotating raw EEG.
In this study we developed a novel automated approach that enabled us to efficiently annotate all epileptiform patterns in a large set of continuous EEG recordings from acutely ill hospitalized patients. Using these annotations we developed a machine-learning model to estimate the independent contribution of sustained exposure to epileptiform activity to the level of neurologic disability at the time of hospital discharge.
Methods
Study design and participants
We retrospectively identified medical, surgical and neurological patients hospitalized between September 2011 and February 2017 who underwent continuous EEG (cEEG) monitoring at Massachusetts General Hospital. Patients were admitted to medical, neurological and surgical intensive care and general care units. We enrolled patients aged 18 years or greater who underwent cEEG for at least 16 hours to monitor for seizure activity. We chose a 16-hour cut off because prior work shows that the probability that seizures will occur if none have occurred after 16 hours of surveillance is < 5%9.
We selected two groups of 1000 patients each by reviewing text reports of EEG findings in the electronic health record. First, we selected 1000 patients identified by a clinical neurophysiologist or epileptologist as having electrographic epileptiform activity (EA). Patterns included in our definition of EA are defined below. Second, we selected 1000 consecutive patients who underwent at-least 16 hours of cEEG monitoring, independent of cEEG findings, to ensure diversity in the cohort. We selected the two groups to ensure we had both a representative sample of consecutive patients, and also a representative sample of epileptiform activity for model building. Limiting the study to consecutive patients only could result in insufficient epileptiform data points across the large sample. Similarly limiting the study to an enriched cohort of epileptiform activity only could reduce the diversity in the cohort. The study team was blinded to outcomes and distribution of epileptiform activity burden in the cohort selection process.
A cohort size of 2000 allowed us to include >200 patients within each of 4 disease subgroups (acute brain injury, hypoxic ischemic encephalopathy, acute seizures/status epilepticus in the absence of brain injury, and primary systemic illness). Prior work in patients with subarachnoid hemorrhage shows that a mean electrographic seizure burden of 6 hours (i.e. a total of 6 hours of recorded time spent seizing) is associated with approximately 60% probability of poor outcomes6. Similarly, in patients with subarachnoid hemorrhage a maximum daily EA burden of 6 hours was associated with approximately 60% probability of poor outcomes7. Using this value for mean EA burden, our sample size of 2000 patients (including at least 200 patients within each subgroup), provided >90% power to detect a 15% increase in the probability of poor outcomes in patients with EA burden one standard deviation above the mean.
The study was approved by the local institutional review board. The requirement for written informed consent was waived. The results are reported in accordance with the Strengthening the Reporting of Observational Studies in Epidemiology (STROBE) guidelines for reporting observational studies10.
Clinical covariates
We abstracted clinical and demographic variables from electronic health records. Clinical covariates included admission diagnosis and pre-morbid medical conditions, disease severity defined by admission Glasgow Coma Score (GCS) and the Acute Physiology and Chronic Health Evaluation II (APACHE II) scores, hospital-acquired conditions (e.g. hospital acquired pneumonia, catheter associated infections, venous thromboembolism), variables extracted from diagnostic studies (neuroimaging reports, laboratory tests), vital signs, and, medications administered throughout hospitalization. Variables with greater than 1% missing data were discarded, and missing values were imputed with group medians for the rest.
Acquisition of cEEG data
Clinical cEEG recordings were acquired according to an institutional protocol applying a standard 21-electrode montage with a physical reference electrode recorded over Cz or posterior cervical spine (C2) according to the international 10–20 system11. Signal quality (e.g. lead maintenance and minimization of artifacts) was maintained by twice-daily lead checks by EEG technicians, per routine clinical care. All cEEG data were reviewed and reported clinically by 2 clinical neurophysiologists per our institutional standard of care.
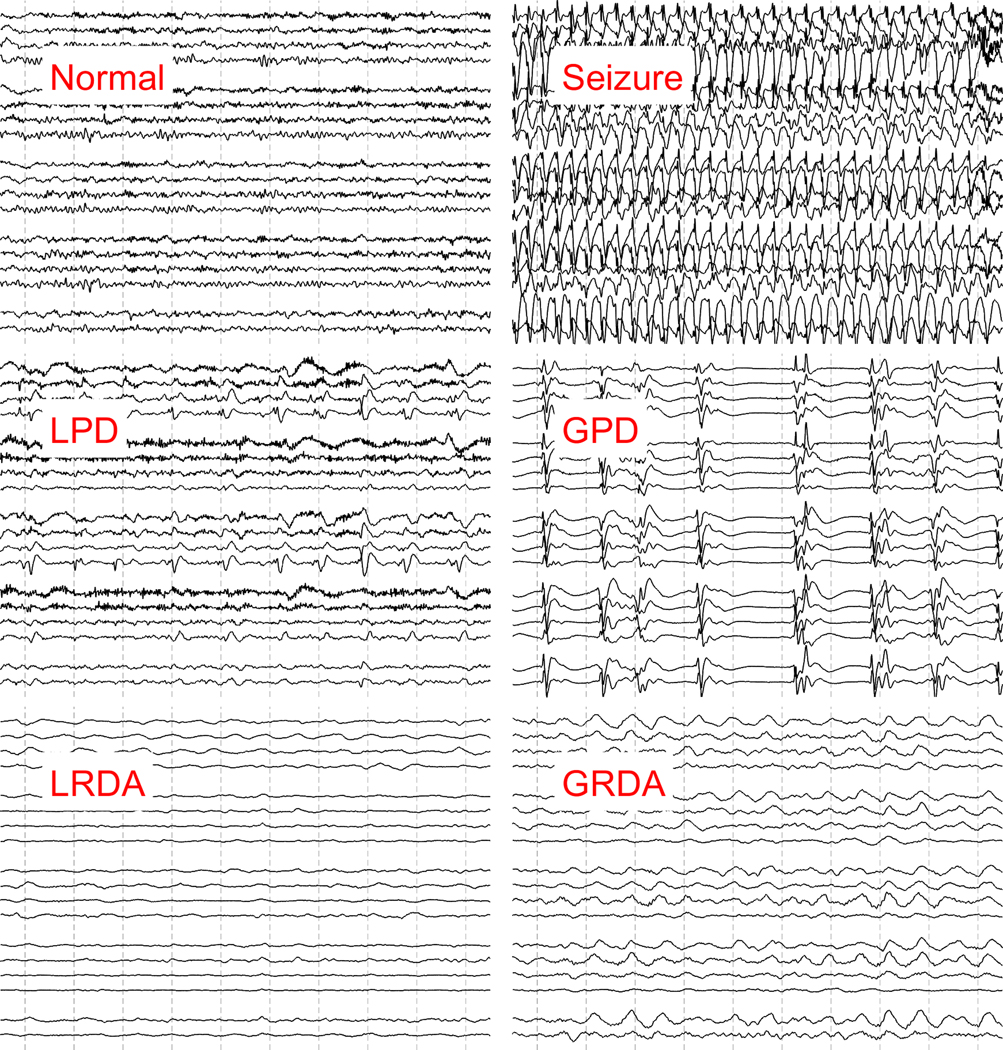
We operationally defined epileptiform activity (EA) for this study as electrographic seizures, periodic and rhythmic patterns that are associated with seizures in critically-ill patients, or associated with poor outcomes and likely to be treated with anti-epileptic drugs 7,12. Periodic and rhythmic patterns were defined using standardized nomenclature, including: lateralized periodic discharges (LPDs), bilateral independent periodic discharges (BIPDs), generalized periodic discharges (GPDs), and lateralized rhythmic delta activity (LRDA)13. LRDA was included in our definition of epileptiform activity as it both confers a future seizure risk and is likely to be treated7,13. We excluded generalized rhythmic delta activity (GRDA) from our definition of EA as prior studies suggest this pattern has minimal association with seizures or poor functional outcomes7,12,14. Sporadic epileptiform discharges were not included in our definition of EA. Examples of EA EEG patterns are shown in Figure 1.
Figure 1. Examples of epileptiform activity.
Examples of normal EEG background, seizure and periodic patterns are shown. Each EEG image shows a 10 second clip of recording in a longitudinal bipolar montage.
GPD: Generalized periodic discharges, GRDA: generalized rhythmic delta activity. LRDA: lateralized rhythmic delta activity, LPD: Lateralized periodic discharges.
Automated annotation and quantification of epileptiform activity burden
To quantify the burden of EA in our patients we developed a method to efficiently label large-scale cEEG data15,16. Extraction and processing of cEEG involved the following steps:
Feature extraction from cEEG: All cEEG data was resampled to 200Hz and converted to longitudinal bipolar montage. The cEEG data was then divided into 2-second nonoverlapping segments. We then extracted several features in the spectral and time domains (e.g. line length, kurtosis, entropy), as previously described16. To obtain information from the surrounding EEG, we also extracted these features in windows of 6, 10 and 14 seconds centered on each 2-second segment. The scalp spatial representation included four regions (LL: Left Lateral, RL: Right Lateral, LP: Left Parasagittal, and RP: Right Parasagittal). After combining the spectral and temporal features from all temporal scales and all spatial regions, we had a total of 592 features which collectively describe each 2 second segment of cEEG.
Clustering cEEG data: We applied change point detection (CPD) with conservative settings on the total power to divide cEEG data into homogeneous segments, i.e., segments in which the EEG patterns remains constant. We then used an unsupervised affinity propagation plus bag-of-words (BoW) based model to cluster CPD-segmented cEEG data from each patient into 30–50 clusters15,16.
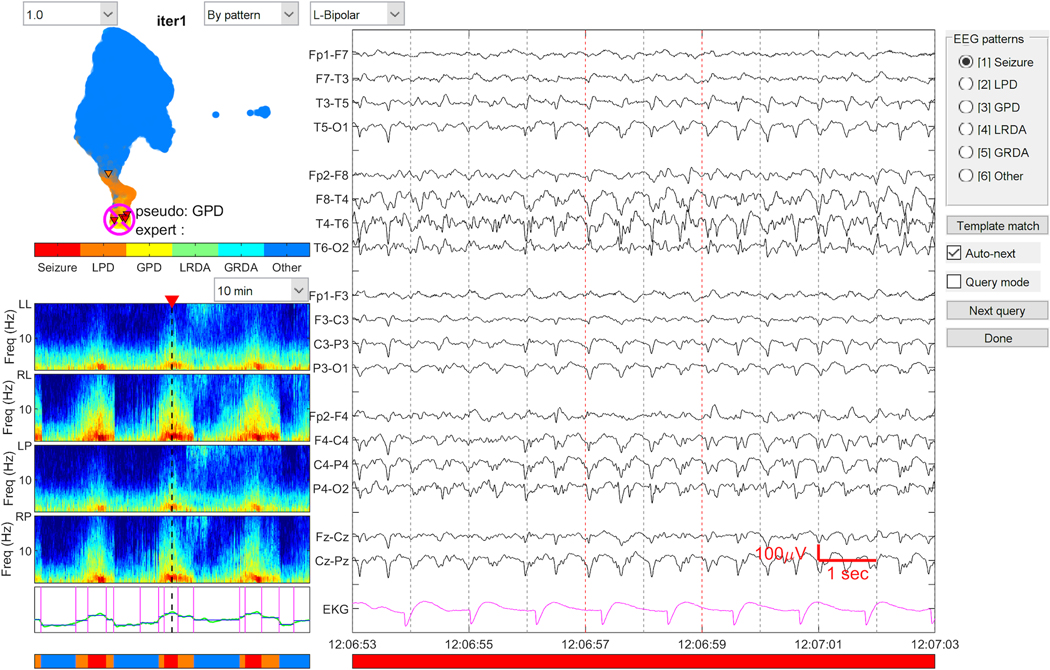
Rapid manual cEEG annotation: A MATLAB based graphical user interface (GUI) was developed for experts (SFZ, ESR, MBW) to score the medoid of each cluster. EEG patterns were scored based on the ACNS nomenclature as: “Seizure”, “LPD”, “GPD”, “LRDA”, “GRDA”. EEG patterns were labeled “Other” for any pattern (including background, artifact) that did not fall into any of the above categories. With this scoring tool, experts generally only need to label 30 to 50 cluster medoids per patient to obtain high quality labels for the entire EEG. Non-medoid cEEG samples automatically inherit the labels from their medoids. The graphical user interface used for this process is shown in Figure 2. We note that the graphical display of clusters was not part of the final classification of each event performed by the trained model. Rather, clustering was an intermediate step used as part of the process of gathering the labeled samples that were used to train the model in the final step, described next.
Automated final annotation: Finally, using the labels created in the prior step we trained a convolutional neural network, and used this to label all EEG segments in the 2000 EEG recordings consistently, at a resolution of one annotation per 2 seconds16.
Calculation of EA burden: EA burden was calculated within 72 hours of cEEG initiation. We evaluated the following definitions of EA burden in our statistical analysis:
Figure 2. Graphical User Interface for EEG annotation.
The graphical user interface for annotating EEG is shown. Experts were asked to label the primary pattern seen on the raw EEG clip (right). The spectrogram shown on the bottom left shows the 30-minute window from which the raw EEG clip is taken. The map on the top left shows the distribution of EA patterns labeled in the entire recording. This map is an intermediate step, and updated as the model is trained and then classified.
EA: Epileptiform activity, GPD: Generalized periodic discharges, GRDA: generalized rhythmic delta activity. LRDA: lateralized rhythmic delta activity, LPD: Lateralized periodic discharges.
EA burden over the first 24 hours
Peak burden defined as maximum EA burden captured within any 12-hour window in the first 72 hours of recording.
Cumulative EA burden over the first 72 hours of recording.
We restricted calculation of EA burden to the first 72 hours of recording to maintain homogeneity of the exposure window.
Primary and secondary outcomes
We assessed the impact of EA burden on neurologic outcome at hospital discharge. Our primary outcome measure was the modified Rankin Scale (mRS) (mRS 0: no symptoms; mRS 1: no significant disability; mRS 2: slight disability; mRS 3: moderate disability; mRS 4: moderate severe disability; mRS 5: severe disability; mRS 6: death)17. The primary outcome was dichotomized and poor outcome was pre-specified as a discharge mRS score of 5 or 6 (versus 0–4)17. The secondary outcome measure was discharge Glasgow Outcome Scale Extended (GOSE) (GOSE 1: death; 2: vegetative state; 3. upper severe disability; 4: lower severe disability; 5: upper moderate disability; 6: lower moderate disability – some disability but can potentially return to some form of employment; 7: lower good recovery – minor physical or mental defect; 8: upper good recovery – full recovery). The secondary outcome was dichotomized, and poor outcome was pre-specified as a discharge GOSE score of 1–4 (versus 5–8)18.
We abstracted mRS and GOSE from physician and physical therapy notes documented at the time of hospital discharge. Outcomes were abstracted retrospectively and adjudicated by independent reviewers (MT, HAN, MS, JG, SK, ME, EB). During outcome abstraction reviewers were blinded to EEG findings and to the anti-seizure medication treatment status.
Statistical analysis
Mean, median, and inter-quartile ranges were calculated for descriptive analysis. Univariate analysis was performed using a linear regression model, and significance was set at <0.05. We subtracted the GCS contribution from the APACHE II score to compute the physiologic APACHE II score, because GCS on admission and worst GCS in the first 24 hours were included separately as independent variables. Admission diagnosis was divided into four categories: 1) acute brain injury (any structural injury other than hypoxic ischemic encephalopathy), 2) hypoxic ischemic encephalopathy (HIE), 3) acute seizures/status epilepticus in the absence of acute structural brain injury or HIE, or 4) primary systemic illnesses without acute structural brain injury or HIE.
Model Estimation and Validation
We created a multivariable logistic regression model using epileptiform activity burden, while adjusting for clinical variables as covariates. We evaluated all three automated EA burden measures: EA burden over the first 24 hours, peak burden within 72 hours of recording start time, and cumulative EA burden within the first 72 hours. The covariates included baseline clinical variables, measures of disease severity and variables with established associations with outcome19,20. These included: Age, gender, initial GCS, worst GCS in the 1st 24 hours, past history of acute brain injury, history of epilepsy, cardiac arrest on presentation, seizure on presentation, admission diagnosis: 1) acute brain injury, 2) hypoxic ischemic encephalopathy, 3) acute seizures/status epilepticus, 4) primary systemic illness.
For feature selection, we used L1 (LASSO) regularization21. We used 10-fold nested cross validation (10-CV) for feature selection. For each of the 10 rounds of 10-CV, we split the data into training (90%) and test (10%) data. For each fold of CV, the training data was further split into training and internal validation data. Patients from the enriched and consecutive cohorts were randomly distributed across the 10 folds during 10 fold CV, so that each of the 10 folds included approximately 10% of patients from each of the 2 groups. Models were fit to the training for a range of L1 regularization parameter values λ, and for each value the performance was measured on the internal validation data. The globally optimal value of λ was selected as the largest value such that deviance is within one standard error of the best average performance across the 10 folds. This optimal value was then used to train a single model on the entire training dataset. After model fitting on the training data, model calibration was assessed on the test set. To account for differences in length of stay, within the test set we stratified patients based on the time interval between the last EEG measurement (within up to 72 hours of monitoring) and discharge. The test set was stratified into three groups: 1) <5 days between last EEG measurement and discharge, 2) 5–10 days between last EEG measurement and discharge, 3) > 10 days between last EEG measurement and discharge. We combined the features selected from each fold and selected 9 features in the final model. We performed 10,000 rounds of bootstrapping to obtain confidence bounds on model calibration error.
Subgroup analyses
We developed regression models using the features selected in our overall model to quantify the association of EA burden with outcomes within each of the four diagnostic categories: 1) acute brain injury (any structural injury other than hypoxic ischemic injury), 2) hypoxic ischemic encephalopathy (HIE), 3) acute seizures/status epilepticus in the absence of acute structural brain injury or HIE, or 4) primary systemic illnesses without acute structural brain injury or HIE.
Results
Of 2000 patients initially included in the study, 33 were excluded due to corrupted cEEG files or <16 hours of interpretable cEEG recording. Demographic and clinical variables for 1967 patients are summarized in Supplemental Table 1. The median age was 62 years, and 48% (n = 950) patients were female. The median physiologic APACHE II score was 10, and the median GCS on admission was 11. Most patients had a primary diagnosis of acute brain injury (n=1194, 60.7%) followed by seizures/status epilepticus (n=279, 14.2%), and primary systemic illness (n=246, 12.5%). 429 (21.8%) had clinical seizures at admission. 59% (n=1160) of patients received anti-epileptic drug (AED) treatment. Discharge mortality was 25.7% (n= 506).
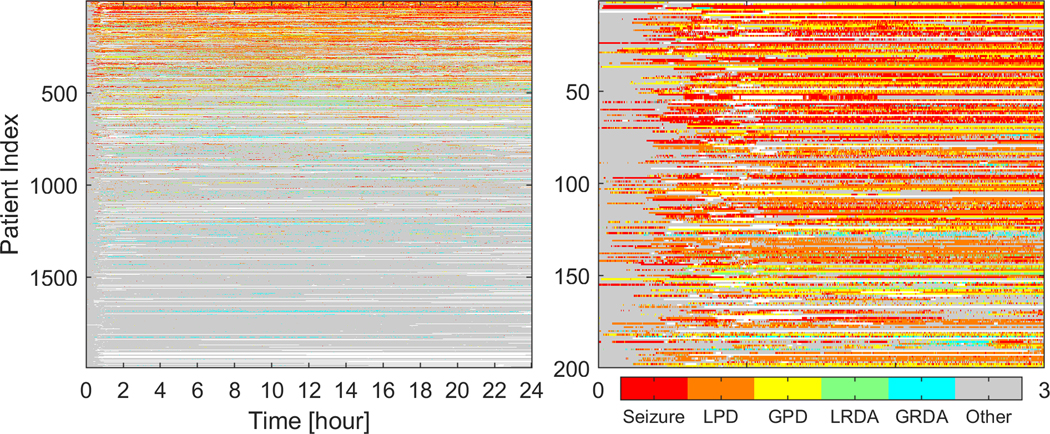
We annotated epileptiform activity in 11.02 terabytes of EEG data. 99% (n=1953) had EA patterns on cEEG monitoring. The median duration of cEEG monitoring was 52 hours. Figure 3 shows a swimmer plot summarizing EEG patterns from the first 24 hours across all patients. For patients with 16–23 hours of cEEG recording (n=110), all available cEEG data was considered as the first 24-hr epoch. Peak EA burden was calculated within 72 hours of recording initiation, and defined as maximum EA burden captured within any 12-hour window. Peak EA burden was calculated as the percentage of the 12-hour epoch occupied by EA patterns. For patients with <72 hours of recording all available cEEG data was considered for calculation of peak burden. Figure 4 shows examples of varying peak EA burdens. A peak EA burden of 100% means the entire 12-hour window is continuously occupied by EAs. In other words, a 0 to 100% increase in peak EA burden means going from absent or zero epileptiform activity in the 12-hr epoch to continuous epileptiform activity present throughout the entire 12-hr epoch. The median time from initiation of cEEG to peak burden was 21 hours (IQR 8–38), and 1627 (85%) patients had their peak burden within 48 hours of monitoring.
Figure 3. First 24-hour epileptiform activity burden.
A) The first 24 hours of cEEG recording for all patients is shown. The x-axis shows hours of recording, and y-axis shows individual patients. The color codes represent different EA patterns.
B) A magnified view of the upper left corner is shown to demonstrate the hour-by-hour pattern type and burden in the first 3 hours.
EA: epileptiform activity; GPD: Generalized periodic discharges, GRDA: generalized rhythmic delta activity. LRDA: lateralized rhythmic delta activity, LPD: Lateralized periodic discharges.
Figure 4. Peak epileptiform activity burden.
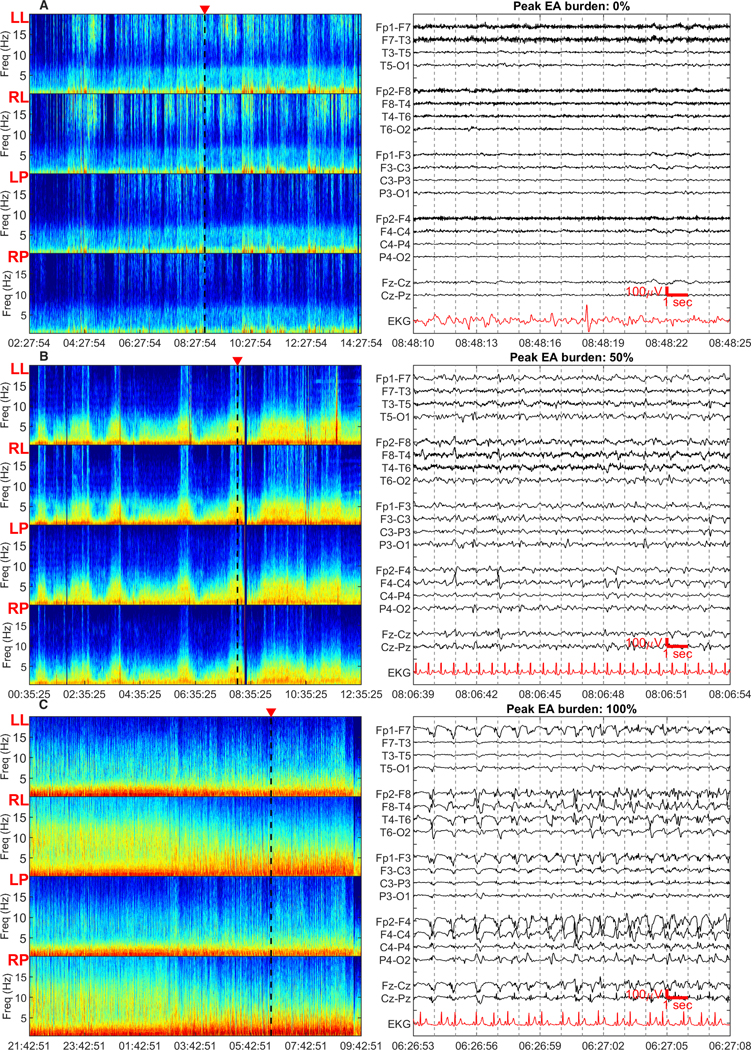
12-hour spectrogram windows with representative 15-second raw EEG clips are shown. Spectrogram panels from top to bottom show left lateral, right lateral, left parasaggital and right parasaggital regions. The triangular marker on top of the spectrogram panels denotes the region from where the raw EEG clip is taken. The raw EEG image shows a 15 second clip of recording in a longitudinal bipolar montage. Peak EA burden was defined as the maximum burden captured within any 12-hour window, and measured as the percentage of the 12-hour epoch occupied by EA patterns. The peak EA burden was measured within 72 hours of recording.
a) Peak EA burden of 0% - the spectrogram is characterized by non sustained <5Hz band of high power. The raw EEG clip shows generalized slowing without epileptiform activity.
b) Peak EA burden of 50% - the spectrogram is characterized by appearance of spectrogram segments with high-power and bandwidth, irregularly rising up from the delta range into theta range. The raw EEG shows right sided periodic discharges.
c) Peak EA burden of 100% - the spectrogram is characterized by sustained higher power at low frequencies with minimal variation or very gradual waxing and waning of frequencies within the high-power band. The raw EEG clip shows continuous epileptiform activity over the right hemisphere, characterized by spikes and spikes and slow waves with evolving frequency.
We examined the inter-rater agreement for EEG patterns between clinical neurophysiologists, and between clinical neurophysiologists and machine annotations. The average percent agreement between expert raters for the different EEG patterns was as follows: Seizures: 88.7%; LPDs: 87.6%; GPDs: 92.6%; LRDA: 89.8%; GRDA: 87.6%. The average percent agreement between expert raters and the machine learning model for the different EEG patterns as was follows: Seizures: 88.8%; LPDs: 85.4%; GPDs: 92.7%; LRDA: 92.5%; GRDA: 90.1%. Thus, on average, the model agrees with experts at least as well as they agree with one another as to the class of epileptiform abnormalities.
Primary outcome (mRS 5–6)
Significant associations with poor outcome (mRS 5–6) on univariate analysis are shown in Table 1. All three measures of automated EA burden (first 24-hour burden, peak burden and cumulative burden) were significantly associated with poor outcome. Other significant associations included primary diagnosis of HIE, age and physiologic APACHE II score.
Table 1.
Variables associated with poor outcome (modified Rankin Scale 5–6)
| Univariate analysis | |||
|---|---|---|---|
|
| |||
| Covariate | Regression Co-efficient* [CI] | P-value | |
| EA burden, initial 24 h | 1.715 [1.239 2.192] | <0.0001 | |
| Peak burden (Maximum 12-h EA burden) | 1.8560 [1.226 21.894] | <0.0001 | |
| Cumulative burden (EA burden over the entire recording) | 2.133 [1.598 2.192] | <0.0001 | |
| Age | 0.018 [0.013 0.024] | <0.0001 | |
| Initial GCS | −0.104 [−0.124 −0.085] | <0.0001 | |
| Worst GCS, initial 24 h | −0.102 [−0.121 −0.084] | <0.0001 | |
| APACHE II | 0.109 [0.093 0.124] | <0.0001 | |
| History of Epilepsy | −0.657 [−0.890 −0.423] | <0.0001 | |
| Cardiac arrest on presentation | 1.237 [0.931 1.542] | <0.0001 | |
| Seizure on presentation | −0.638 [−0.858 −0.419] | <0.0001 | |
| Primary diagnosis of HIE | 1.727 [1.374 2.080] | <0.0001 | |
| Primary diagnosis of acute SZ/status epilepticus | −0.912 [−1.182 −0.642] | <0.0001 | |
|
| |||
| Multivariate analysis | |||
|
| |||
| Covariate | Number of folds in which feature selected ** | Regression Co-efficient [CI] | p-value |
|
| |||
| Peak burden (Maximum 12-h EA burden) | 10 | 1.470 [1.099 1.841] | <0.0001 |
| Age | 10 | 0.017 [0.011 0.023] | <0.0001 |
| Initial GCS | 10 | −0.038 [−0.079 −0.003] | 0.070 |
| Worst GCS, initial 24 h | 10 | −0.056 [−0.094 −0.018] | 0.004 |
| APACHE II | 10 | 0.072 [0.055 0.088] | <0.0001 |
| History of epilepsy | 6 | −0.119 [−0.400 0.161] | 0.400 |
| Seizure on presentation | 10 | −0.612 [−0.888 −0.335] | <0.0001 |
| Primary diagnosis of HIE | 10 | 1.185 [0.792 1.579] | <0.0001 |
| Primary diagnosis of acute SZ/SE | 10 | −0.385 [−0.719 −0.053] | 0.02 |
For predictors with a positive regression coefficient, presence/higher value is associated with higher probability of poor outcome. For predictors with a negative regression coefficient, presence/higher value is associated with lower probability of poor outcome.
For multivariate analysis, the number of folds of cross-validation in which each feature was selected is shown.
ABI: acute brain injury; CI: confidence interval; EA: Epileptiform activity; GCS: Glasgow Coma Scale score; HIE: hypoxic ischemic encephalopathy; SZ/SE: acute seizure/status epilepticus
Nine features were selected by LASSO regularization and cross validation to be included in the final multivariable model (Table 1). Outcomes and epileptiform activity burden were evenly distributed across the training and testing samples and across the 10 folds of CV. Across the 10 folds, the average percentage of good outcomes was 51% in the training, and 51% in the testing data. The distribution of epileptiform activity burden was similar across the 10 folds, and differed between good and poor outcome groups primarily at the extremes: the good outcome group had relatively more patients with low (<0.1) EA burden, and the poor outcome group had relatively more patients with high (>0.9) IIIC burden. The median peak burden in patients with poor outcomes across the 10 folds was 0.11 [Q1-Q3 0.01–0.1] and the median peak burden in patients with good outcomes across the 10 folds was 0.04 [Q1-Q3 0.03–0.05].
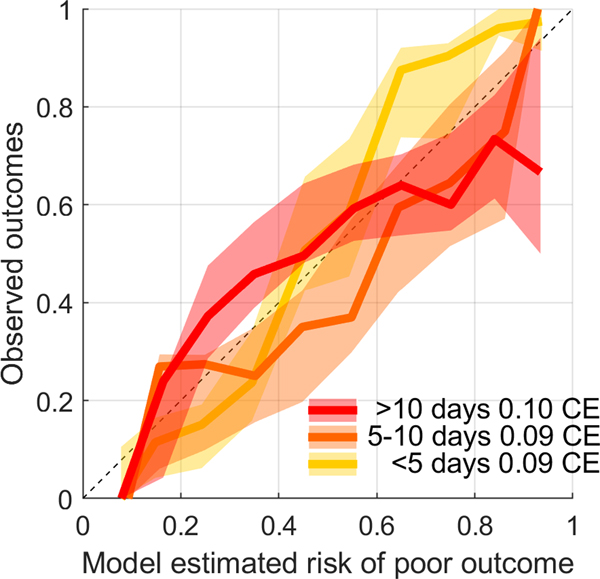
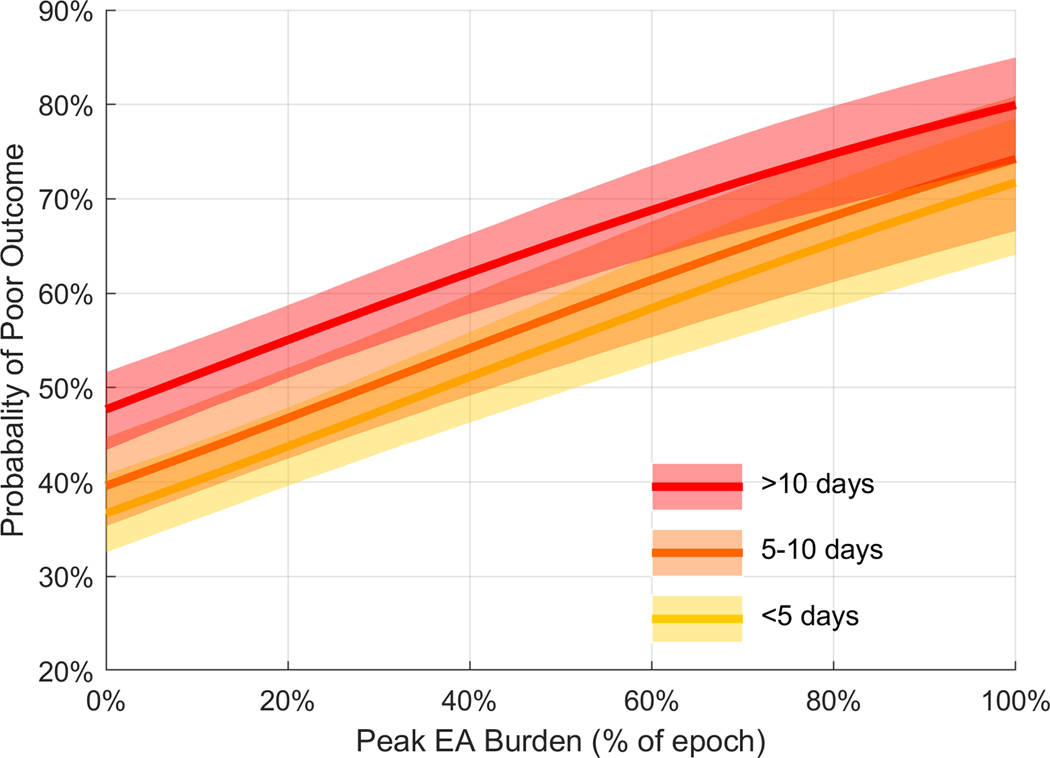
Among automated EA burden measures, the peak burden (maximum burden in any 12-hour window measured in the first 72 hours) was selected, and had a coefficient value in the final multivariable model of 1.470 [1.099, 1.841] (p <0.0001), demonstrating a strong independent association with poor outcome. The mean calibration errors for the multivariable outcome model across the three strata were as follows: 1) discharge < 5 days after last EEG measurement: 0.0941 [CI 0.0706, 0.1191); discharge 5–10 days after last EEG measurement: 0.0946 [CI 0.0631, 0.1290]; discharge > 10 days after last EEG measurement: 0.0998 [CI 0.0698, 0.1335]. The mean calibration errors indicate good agreement between model-estimated and observed risk across all three strata (Figure 5). Figure 6 shows the probability of poor outcome as a function of increasing EA burden. Increasing the peak EA burden from 0 to 100% increased the probability of a poor neurologic outcome by approximately 35% across the three strata.
Figure 5. Modeled performance: Calibration curves.
Model calibration curves across the three strata of time intervals between measurement of peak EA and discharge are shown. The mean calibration errors for the multivariable outcome model across the three strata were as follows: 1) < 5 days between last EEG measurement and discharge: 0.0941 [CI 0.0706, 0.1191); 5–10 days between last EEG measurement and discharge: 0.0946 [ CI 0.0631, 0.1290]; > 10 days between last EEG measurement and discharge: 0.0998 [CI 0.0698, 0.1335].
Figure 6. Dose-response relation between peak epileptiform activity burden and outcomes.
The figure shows the modeled probability of poor outcome (mRS 5–6) with increasing peak burden (maximum EA burden captured within any 12-hour window). This dose-response plot is obtained from the multivariable model that included the final 9 covariates: Age, initial GCS, worst GCS in the first 24 hours, APACHE II score, history of epilepsy, seizure on presentation, primary diagnosis of HIE, primary diagnosis of acute seizure/SE, peak burden. The shaded area represents the 95% confidence intervals of the model output. Increasing the peak EA burden from 0 to 100% increases the probability of a poor outcome by approximately 35% across all strata. The median value of other covariates is used to build the curve.
ABI: acute brain injury; GCS: Glasgow Coma Scale score; EA: epileptiform activity; HIE: hypoxic ischemic encephalopathy; SZ/SE: acute seizure/status epilepticus
Secondary outcomes (GOSE 1–4)
Among automated EA burden measures, the peak burden (maximum burden in any 12-hour window) was selected 10/10 times as a covariate associated with poor outcome. The multivariable outcome model yielded results similar to the primary outcome of mRS, with the following mean calibration errors: 1) < 5 days between last EEG measurement and discharge: 0.1184 [CI 0.0817, 0.1586]; 5–10 days between last EEG measurement and discharge: 0.1405 [CI 0.0686, 0.2193]; > 10 days between last EEG measurement and discharge: 0.1367 [CI 0.0891, 0.1857].
Subgroup analysis
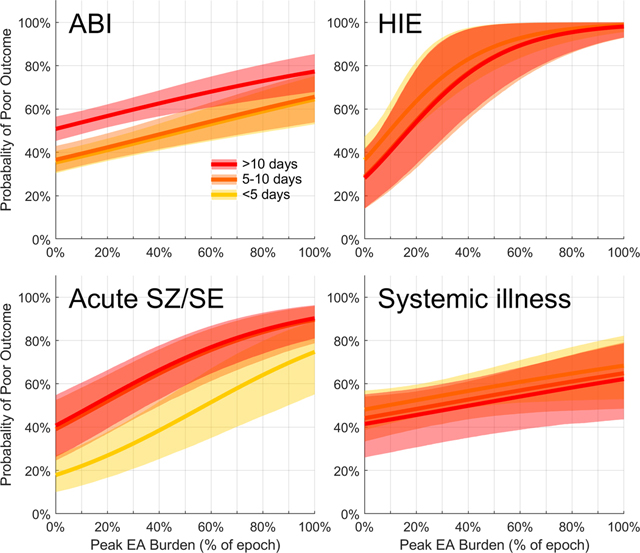
A dose-dependent association between peak EA burden and poor outcomes was seen across all diagnostic categories i.e. acute brain injury, HIE, acute seizures/status epilepticus and primary systemic illness (Figure 7). This association was highest for patients with HIE across all three strata (average 65% increase in the probability of poor outcome when comparing patients with peak EA burden of 0 vs. 100%), followed by patients with seizure/status (average 50% increase in probability of poor outcome with increasing peak EA burden). Among patients with acute brain injury there was an average 30% increase in the probability of poor outcome comparing patients with EA burden of 0 vs. 100% across all three strata. In patients with primary systemic illness there was an average 15% increase in the probability of poor outcome comparing patients with EA burden of 0 vs. 100% across all three strata.
Figure 7. Dose response relation between epileptiform activity burden and outcome in subgroup analysis.
a) Among patients with acute brain injury there was a 20–30% increase in the probability of poor outcome comparing patients with peak EA burden of 0 vs. 100%.
b) Among patients with HIE there was a 60–70% increase in the probability of poor outcome comparing patients with peak EA burden of 0 vs. 100%.
c) Among patients with acute seizure/status epilepticus there was a 50% increase in the probability of poor outcome comparing patients with peak EA burden of 0 vs. 100%.
d) Among patients with primary systemic illness there was a 10–20% increase in the probability of poor outcome comparing patients with peak EA burden of 0 vs. 100%.
ABI: acute brain injury; GCS: Glasgow Coma Scale score; EA: epileptiform activity; HIE: hypoxic ischemic encephalopathy; SZ/SE: seizure/status epilepticus
Discussion
Using automated EEG labeling, we efficiently quantified epileptiform activity burden in a large cohort of patients across a wide variety of diagnoses. We found that an increasing EA burden is associated with worse neurologic outcomes at hospital discharge. Specifically, peak (maximum 12-hour) EA burden is associated with worse outcomes in a dose-dependent manner. Other factors being equal, increasing peak EA burden from 0 to 100% increases the probability of poor neurologic outcome by 35%. This dose-response relation is seen independent of the time interval between the last EEG measurement and discharge.
Increasing burden of electrographic seizures has been shown to be associated with worse outcomes in prior studies6,22. A prospective cohort of pediatric critically ill patients found a seizure burden threshold of >20% (12 minutes) per hour was associated with worse neurologic outcomes22. In subarachnoid hemorrhage patients, increasing seizure burden is similarly associated with worse outcomes, as is increasing burden of seizure-like rhythmic and periodic EEG patterns6,7. In a more recent study of moderate-severe traumatic brain injury patients, while the burden of EAs was associated with disease severity, the authors did not find any association with 3-month functional outcomes23. However, the authors evaluated average burden, and did not quantify the peak burden. This work builds on that by demonstrating that high intensity of EAs (highest peak burden) may be of greater importance compared with the overall or cumulative burden of EAs.
Both seizures and periodic EEG patterns are associated with increased cerebral metabolism24. In traumatic brain injury patients, seizures and periodic discharges are associated with low brain glucose and elevated microdialysis lactate/pyruvate ratios, a condition described as metabolic crisis25. This mismatch between metabolic supply and demand may be a driver of worse outcomes seen with increasing EA burden.
Although the dose-dependent relationship between EA burden and poor outcomes in our cohort was present across diagnostic categories, a greater effect was seen in patients who presented with clinical seizures/status epilepticus, compared to patients with acute brain injuries. This finding is similar to the finding in pediatric critically ill patients, where the association between seizure burden and neurological decline was stronger in patients with acute seizures than in patients with acute brain injury. Seizures on presentation was associated with better outcomes, likely because many of these patients had established epilepsy presenting with breakthrough seizures, and therefore had lower illness severity, less comorbid heterogeneity, and a lower baseline probability of poor outcomes.
Limitations of our study include its retrospective design and performance at a single center. We assessed outcomes at discharge rather than long-term, whereas functional outcomes can continue to evolve after discharge. Additionally, cognitive outcomes were not assessed, and should be evaluated in future studies. Although half the patients in our cohort received AED treatment, we did not include AEDs in our outcome model as we considered them to be a part of the causal pathway linking EA burden to outcomes. Investigating the impact of AED treatment is also limited by confounding by indication. Future controlled prospective studies that address these challenges are needed to determine whether treatment with AEDs improves outcomes.
Epileptiform activity burden is associated with worse neurologic outcomes in medical, neurologic and surgical patients. Peak or maximum epileptiform activity burden is thus a promising target for future multi-center randomized control trials investigating whether suppressing such activity can improve neurologic outcomes. The automated method for EEG labeling and quantification of EA burden has a future role in the high-throughput assessment of candidate therapies. As a next step, this tool has applications in studies investigating the long-term impact of epileptiform activity on functional and cognitive outcomes, and the longitudinal effect of anti-seizure treatment.
Supplementary Material
Acknowledgements
The study was conducted with research support from SAGE therapeutics (Co-PIs SFZ, ESR, MBW); however the sponsor had no role in the study design, data analysis, or reporting of the results. The study received research support from NIH/NINDS K23NS114201 (SFZ) and K23NS105950 (ESR), 1R01NS102190, 1R01NS102574, 1R01NS107291, 1RF1AG064312 (MBW)
Footnotes
Data availability
The data that support the findings of this study are available from the corresponding author, (SFZ) upon reasonable request.
Potential Conflicts of Interest
AJC has been a consultant to Sage Therapeutics unrelated to this work; Sage Therapuetics provided research support for this study, but was not involved in study design, execution, or evaluation of results. SFZ, ESR, JJ, WG, MT, HAN, MS, HS, FJ, SL, ME, EB, JG, VMJ, MG, YS, SA, JS, MBW report no potential conflict of interest.
References
- 1.Claassen J, Hirsch LJ, Frontera JA, Fernandez A, Schmidt M, Kapinos G, et al. Prognostic significance of continuous EEG monitoring in patients with poor-grade subarachnoid hemorrhage. Neurocritical care 2006;4:103–12. [DOI] [PubMed] [Google Scholar]
- 2.Claassen J, Jette N, Chum F, Green R, Schmidt M, Choi H, et al. Electrographic seizures and periodic discharges after intracerebral hemorrhage. Neurology 2007;69:1356–65. [DOI] [PubMed] [Google Scholar]
- 3.Oddo M, Carrera E, Claassen J, Mayer SA, Hirsch LJ. Continuous electroencephalography in the medical intensive care unit. Critical care medicine 2009;37:2051–6 [DOI] [PubMed] [Google Scholar]
- 4.Kurtz P, Gaspard N, Wahl AS, Bauer RM, Hirsch LJ, Wunsch H, et al. Continuous electroencephalography in a surgical intensive care unit. Intensive care medicine 2014;40:228–34. [DOI] [PubMed] [Google Scholar]
- 5.Ribeiro A, Singh R, Brunnhuber F. Clinical outcome of generalized periodic epileptiform discharges on first EEG in patients with hypoxic encephalopathy post cardiac arrest. Epilepsy & Behavior 2015;49:268–72. [DOI] [PubMed] [Google Scholar]
- 6.De Marchis GM, Pugin D, Meyers E, Velasquez A, Suwatcharangkoon S, Park S, et al. Seizure burden in subarachnoid hemorrhage associated with functional and cognitive outcome. Neurology 2016;86:253–60. [DOI] [PMC free article] [PubMed] [Google Scholar]
- 7.Zafar SF, Postma EN, Biswal S, Boyle EJ, Bechek S, O’Connor K, et al. Effect of epileptiform abnormality burden on neurologic outcome and antiepileptic drug management after subarachnoid hemorrhage. Clin Neurophysiol 2018;129:2219–27. [DOI] [PMC free article] [PubMed] [Google Scholar]
- 8.Tabaeizadeh M, Nour HA, Shoukat M, Sun H, Jing J, Javed F, et al. Burden of Epileptiform Activity Predicts Discharge Neurologic Outcomes in Severe Acute Ischemic Stroke. Neurocritical care 2020; April 3. [DOI] [PMC free article] [PubMed] [Google Scholar]
- 9.Westover MB, Shafi MM, Bianchi MT, Moura LM, O’rourke D, Rosenthal ES, et al. The probability of seizures during EEG monitoring in critically ill adults. Clinical Neurophysiology 2015;126:463–71. [DOI] [PMC free article] [PubMed] [Google Scholar]
- 10.von Elm E, Altman DG, Egger M, Pocock SJ, Gøtzsche PC, Vandenbroucke JP. The Strengthening the Reporting of Observational Studies in Epidemiology (STROBE) statement: guidelines for reporting observational studies. Int J Surg 2014;12:1495–9.25046131 [Google Scholar]
- 11.Claassen J, Taccone FS, Horn P, Holtkamp M, Stocchetti N, Oddo M. Recommendations on the use of EEG monitoring in critically ill patients: consensus statement from the neurointensive care section of the ESICM. Intensive Care Med 2013;39:1337–51. [DOI] [PubMed] [Google Scholar]
- 12.Ruiz AR, Vlachy J, Lee JW, Gilmore EJ, Ayer T, Haider HA, et al. Association of periodic and rhythmic electroencephalographic patterns with seizures in critically ill patients. JAMA neurology 2017;74:181–8. [DOI] [PubMed] [Google Scholar]
- 13.Hirsch LJ, Laroche SM, Gaspard N, Gerard E, Svoronos A, Herman ST, et al. American clinical neurophysiology society’s standardized critical care EEG terminology: 2012 version. J Clin Neurophysiol 2013;30:1–27. [DOI] [PubMed] [Google Scholar]
- 14.Kim JA, Rosenthal ES, Biswal S, Zafar S, Shenoy AV, O’Connor KL, et al. Epileptiform abnormalities predict delayed cerebral ischemia in subarachnoid hemorrhage. Clin Neurophysiol 2017;128:1091–9. [DOI] [PMC free article] [PubMed] [Google Scholar]
- 15.Jing J, d’Angremont E, Zafar S, Rosenthal ES, Tabaeizadeh M, Ebrahim S, et al. Rapid annotation of seizures and interictal-ictal continuum eeg patterns. In 2018. 40th Annual International Conference of the IEEE Engineering in Medicine and Biology Society (EMBC) 2018 Jul 18 (pp. 3394–3397). IEEE. [DOI] [PMC free article] [PubMed] [Google Scholar]
- 16.Ge W, Jing J, An S, Herlopian A, Ng M, Struck AF, et al. Deep active learning for Interictal Ictal Injury Continuum EEG patterns. J Neurosci Methods 2021. March 1;351:108966. [DOI] [PMC free article] [PubMed] [Google Scholar]
- 17.Farrell B, Godwin J, Richards S, Warlow C. The United Kingdom transient ischaemic attack (UK-TIA) aspirin trial: final results. Journal of Neurology, Neurosurgery & Psychiatry 1991;54:1044–54. [DOI] [PMC free article] [PubMed] [Google Scholar]
- 18.Wilson JL, Pettigrew LE, Teasdale GM. Structured interviews for the Glasgow Outcome Scale and the extended Glasgow Outcome Scale: guidelines for their use. J Neurotrauma. 1998;15:573–85. [DOI] [PubMed] [Google Scholar]
- 19.Knaus WA, Draper EA, Wagner DP, Zimmerman JE. APACHE II: a severity of disease classification system. Critical care medicine 1985;13:818–29. [PubMed] [Google Scholar]
- 20.Sandroni C, Cavallaro F, Callaway CW, D’Arrigo S, Sanna T, Kuiper MA, et al. Predictors of poor neurologic outcome in adult comatose survivors of cardiac arrest: A systematic review and meta-analysis. Part 2: Patients treated with therapeutic hypothermia. Resuscitation. 2013;84:1324–1338 [DOI] [PubMed] [Google Scholar]
- 21.James G, Witten D, Hastie T, & Tibshirani R. (2013). An introduction to statistical learning (Vol. 112, pp. 3–7). New York: springer. [Google Scholar]
- 22.Payne ET, Zhao XY, Frndova H, McBain K, Sharma R, Hutchison JS, et al. Seizure burden is independently associated with short term outcome in critically ill children. Brain 2014;137:1429–38. [DOI] [PMC free article] [PubMed] [Google Scholar]
- 23.Lee H, Mizrahi MA, Hartings JA, Sharma S, Pahren L, Ngwenya LB, Moseley BD, Privitera M, Tortella FC, Foreman B. Continuous electroencephalography after moderate to severe traumatic brain injury. Critical care medicine. 2019. April;47(4):574. [DOI] [PMC free article] [PubMed] [Google Scholar]
- 24.Struck AF, Westover MB, Hall LT, Deck GM, Cole AJ, Rosenthal ES. Metabolic correlates of the ictal-interictal continuum: FDG-PET during continuous EEG. Neurocritical care 2016;24:324–31. [DOI] [PMC free article] [PubMed] [Google Scholar]
- 25.Vespa P, Tubi M, Claassen J, Buitrago-Blanco M, McArthur D, Velazquez AG, et al. Metabolic crisis occurs with seizures and periodic discharges after brain trauma. Annals of neurology 2016;79: 579–90. [DOI] [PubMed] [Google Scholar]
Associated Data
This section collects any data citations, data availability statements, or supplementary materials included in this article.


