Abstract
The new coronavirus (COVID-19) is having a major impact on mortality and survival in most countries of the world, with Mexico being one of the countries most heavily impacted by the pandemic. In this paper, we study the impact of COVID-19 deaths on period life expectancy at birth in Mexico by sex and state. We focus on the loss of life expectancy at different ages as a geographically comparable measure of the pandemic’s impact on the population in 2020. Results show that males have been affected more than women since they have lost more years of life expectancy at birth due to COVID-19, and they have also experienced a high variation of life expectancy loss across states. The biggest life expectancy loss concentrates in the Northeastern, Central, and Southeastern (Yucatan peninsula) states. Considering the likely undercount associated with COVID-19 deaths, sensitivity analysis suggests that the new coronavirus is having a much larger impact on life expectancy in Mexico than the official government data appears to indicate. Continuos assessment of the pandemic will help state governments quantify the effect of current and new public health measures.
Keywords: COVID-19, Mortality, Multiple decrement process, Life expectancy, Excess mortality, Mexico
RÉSUMÉ
La nouvelle maladie à coronavirus (COVID-19) a un impact majeur sur la mortalité et la survie dans la plupart des pays du monde, le Mexique étant parmi les pays les plus fortement touchés par la pandémie. Dans cet article, nous étudions l’impact des décès dus à la COVID-19 sur l’espérance de vie à la naissance comme mesure géographiquement comparable de l'impact de la pandémie sur la population en 2020. Les résultats montrent que les hommes ont été plus touchés que les femmes, ils ont perdu plus d'années d'espérance de vie à la naissance en raison de la COVID-19 et ont également connu une forte variation de la perte d'espérance de vie entre les États mexicains. La plus grande perte d'espérance de vie est concentrée dans les États du nord-est, du centre et du sud-est (péninsule du Yucatan). L'analyse de sensibilité tient compte du sous-dénombrement probable associé aux décès dus à la COVID-19 et suggère que la maladie a un impact beaucoup plus important sur l'espérance de vie au Mexique que les données officielles du gouvernement ne semblent l'indiquer. Une évaluation continue de la pandémie aidera les gouvernements des États à quantifier l'effet des mesures de santé publique actuelles et nouvelles à mesure que la pandémie se poursuit.
Mots-clé: COVID-19, mortalité, décréments multiples, espérance de vie, excès de mortalité, Mexique
Introduction
The new coronavirus disease (COVID-19), caused by the SARS-CoV-2 virus, is having a major impact on mortality and survival in most countries of the world since the World Health Organization (WHO) declared the pandemic emergence on March 11, 2020 (WHO, 2020). The spread, impact, and government response to mitigate the impact of the pandemic have been heterogeneous between and within countries. While high-income European countries reacted with a strict lockdown early on, most low- and middle-income countries characterized by weaker labor markets and fragmented health care systems could not afford to lockdown the entire population (except for some countries like Argentina, Bolivia, Colombia, El Salvador, and Peru) (Kaplan et al., 2020). At the beginning of the pandemic, the empirical evidence based on the European and Asian experience showed that older adults were the most vulnerable population to COVID-19 (Dowd et al., 2020; Kashnitsky & Aburto, 2020). But as the virus spread to the Americas, where high-, middle-, and low-income countries coexist, new evidence emerged suggesting a different age pattern of mortality. This evidence has shown that the most vulnerable population was not among older adults, but among those with multimorbidity characterized by many chronic-degenerative diseases which are mainly concentrated in young adults (Glassman et al., 2020). This is characteristic of populations where malnutrition and obesity coexist, such as in Mexico (Min et al, 2018; Rivera et al, 2014; Kroker-Lobos et al, 2014, Abdullah, 2015, Glassman et al., 2020).
In this paper, we study the impact of COVID-19 deaths on life expectancy at birth in Mexico by sex and state. We estimate the age pattern of the relative decrease in life expectancy measuring the age at maximum loss and differences by sex. We also calculate a traditional age decomposition of the difference in life expectancies (Arriaga, 1984). We use information on deaths in Mexico and its states from the Secretariat of Health (DGE-SS, 2020) and the Mexican official population projections at mid-2020, and 2020 life tables by sex at national and state levels (CONAPO, 2018). We use a life table approach to assess the impact of COVID-19 since it estimates life expectancy, an indicator that is easy to understand and that is comparable across regions. This allows us to use life expectancy at birth, and by age, as a proxy to assess the impact of COVID-19 on the country and across states.
The COVID-19 Pandemic in Mexico
By the end of 2020, the United States, Brazil, and Mexico were among the countries with the highest cumulative number of COVID-19 cases and deaths in the world (Our World in Data, 2020), even though Mexico is one of the countries that tested less intensively for the disease (Hasell et al, 2020). The first three cases of COVID-19 in Mexico were confirmed on February 27th (two in Mexico City and one in Sinaloa), and were reported by the Sentinel Surveillance System which was launched in 2009 for the H1N1 pandemic. According to Mexico’s Secretariat of Health, such cases were imported from abroad. By February 28th, the Mexican government, through the Secretariat of Health, thus announced the first phase of the pandemic in Mexico, characterized by cases imported from abroad (Suarez et al., 2020; SS-SPPS, 2020b). Two weeks later, on March 18th, the first death from COVID-19 was registered in Mexico. On March 23rd, the government declared the beginning of the National Strategy of Social Distance and one day later, on March 24th, the Secretariat of Health announced the beginning of the second phase of the pandemic in Mexico, characterized by community transmission.
Although the Secretariat of Health in Mexico has used polymerase chain reaction (PCR) tests since early April, their use has been limited. For example, since April 6, 2020, the Secretariat of Health mandated that all hospitals should apply PCR tests to 100% of severe patients and to 10% of ambulatory patients (CONAVE, 2020). However, tests applied in private laboratories and private hospitals on patients who did not require hospitalization are not recorded in official registries. People without severe symptoms or without three or more symptoms are not able to be tested in public hospitals. Although all confirmed and suspicious deaths are recorded, there is a lag of between 15 and 20 days in their incorporation to the official mortality database (Gutiérrez et al., 2020). On April 12, 2020, the Secretariat of Health launched a publicly available dashboard with COVID-19 cases including deaths by age, sex, and some comorbidities, among other individual variables with daily updates. This government response followed the strategy for containing the spread of the pandemic in the country in order to not exceed hospital capacity.
Data and Methods
To measure the loss of life expectancy at each age, we apply an extension of the associated single-decrement tables from period data (ASDT, Preston et al., 2001). In the traditional ASDT method, one is interested in knowing what a life expectancy (and the entire life table) would be if only one cause of decrement was diminishing the population. Such cause of decrement could be conceptualized as all causes other than i (denoted as -i) in the context of a multiple decrement process.1 As an extension, we could add, instead of deleting, a cause of death, say j (in this case ), to the existing multiple-decrement process in order to analyze the effect of adding such cause in the population’s survivorship. More precisely, let and be the force of mortality at age x for all causes of death and for cause of death i, respectively; if we have k mutually exclusive causes of death, then . If we add a new cause of death j, then . The probability of surviving from age x to is given by , and if we add a new cause of death j, the probability of surviving from age x to considering the new cause of death j is calculated as
| 1 |
where is the probability of surviving from age x to in the associated single-decrement table, i.e., the life table associated with cause j. Equation (1) indicates that the age-specific probability of survival when a new cause is added can be estimated as the product of two terms, the survival probability under a previous mortality regime (i.e., in the absence of cause j, given by ) and the survival probability when only decrement j operates in the population (). The first term is readily available from an estimated or projected life table that does not include the new cause of death j. The second term can be computed under some assumptions. Following Preston et al. (2001, pp. 80–84), we assume that the force of decrement from cause j is constant in the age interval x to . With such assumption , where is the observed age-specific mortality rate from cause i.2 Thus, the probability of surviving from age x to in the associated single-decrement table is calculated as
| 2 |
The rest of the life table’s functions are calculated as any single-decrement process. For parsimony, we borrow from the projected life table without the new cause of death to calculate the life table with the new cause of death, but a graduation formula can be applied, like the proposed by Keyfitz (1966). Moreover, we could also calculate the loss of life expectancy due to the new cause of death by calculating the difference between life expectancy without the new cause of death j (, from previous estimates or projections) and the life expectancy (at birth or any other age) with the new cause of death ().
We apply the above procedure to data in Mexico using deaths from COVID-19 as the new cause of death. We use daily cumulative deaths related to COVID-19 by age and sex at the state and municipality levels that are publicly available through the Health Secretariat (DGE-SS, 2020). This database considers confirmed and suspicious deaths from COVID-19 with a lag period of about 15 to 20 days (SS-SPPS, 2020a). Thus, our data include deaths reported from March 16, 2020, through December 31, 2020.3 We also use Mexican official population projections at mid-2020, and 2020 life tables by sex at national and state levels (CONAPO, 2018).4
Results
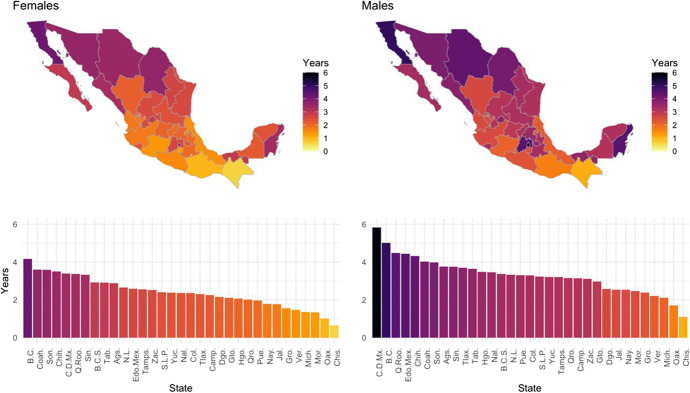
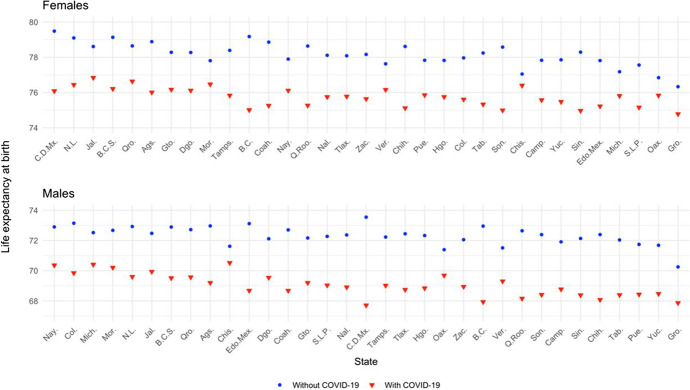
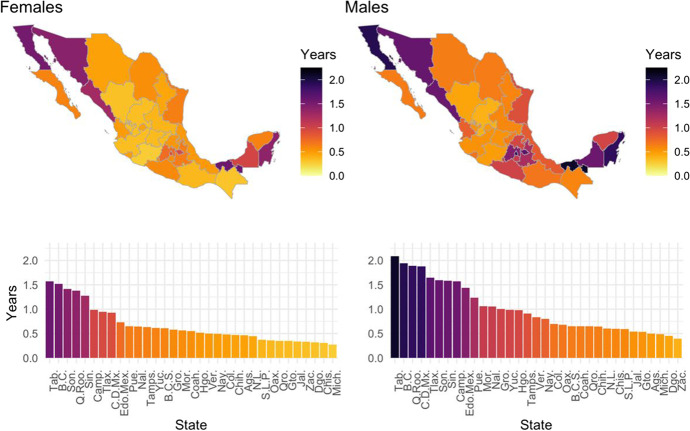
By December 31, 2020, there were 187,558 accumulated deaths from COVID-19 in Mexico (SS-SPPS, 2020ab). Our results show that, by this date, the Mexican population had lost about 2.5 and 3.6 years of life expectancy at birth (LE0) for females and males, respectively (Figs. 1 and 6). This loss did not occur homogenously across the country. Figure 1 shows differences in life expectancies at birth by sex and state pre- and post-COVID-19, i.e., loss in life expectancy associated with COVID-19. Darker colors indicate larger loss of LE0. The figure shows that losses in LE0 are concentrated in a few states in the Northwest, Central, and Southeast regions, particularly in the Yucatan Peninsula. It is evident from this figure that males have lost more years of LE0 than females. For example, for males, the vast majority of states (23 out of 32) have lost more than 3 years of LE0 due to COVID-19. In contrast, for females, less than a quarter of the states (7 out of 32 states) have lost more than 3 years of LE0.5
Fig. 1.
Subnational distribution of years of life expectancy at birth lost by COVID-19, by sex, February–December 2020. Source: Own calculations based on DGE-SS (2020), and CONAPO (2018). Names and acronyms of states are presented in Table 1 and Fig. 10
Fig. 6.
Life expectancy at birth projected by 2020 (without COVID-19) and estimated via ASDT adding COVID-19 as new cause of death, February–December 2020. Source: Own calculations based on Open Data from DGE-SS (2020) and projected life tables from CONAPO (2018). Names and acronyms of states are presented in Table 1 and Fig. 10
Results in Fig. 1 also highlight the large variability across states in the loss of LE0 among both men and women. For example, there is a large gap in lost LE0 of about 5 years among men between the most and least affected states: Mexico City6 and Chiapas (with a loss of LE0 of 6 years and 1 year, respectively). In contrast, the largest gap among women, between the most and least affected states, is about 3.5 years between Baja California and Chiapas (4 and 0.5 years of loss of LE0, respectively). For men and women, Chiapas is the state least affected by the pandemic during 2020.
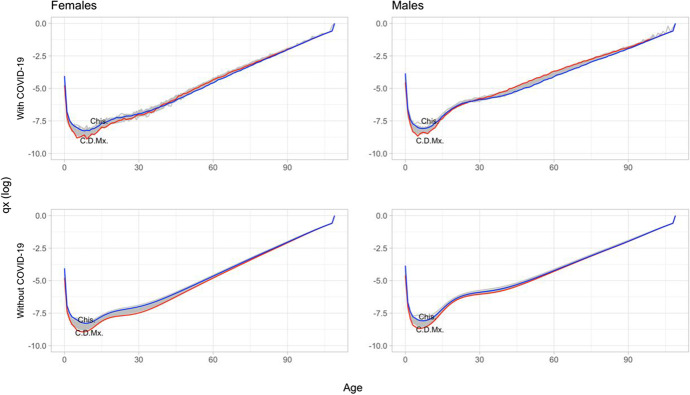
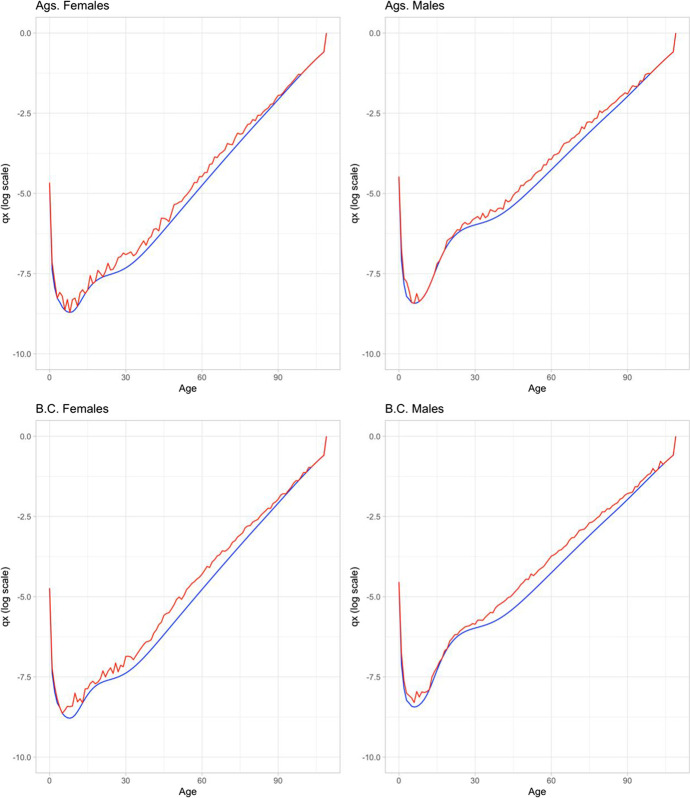
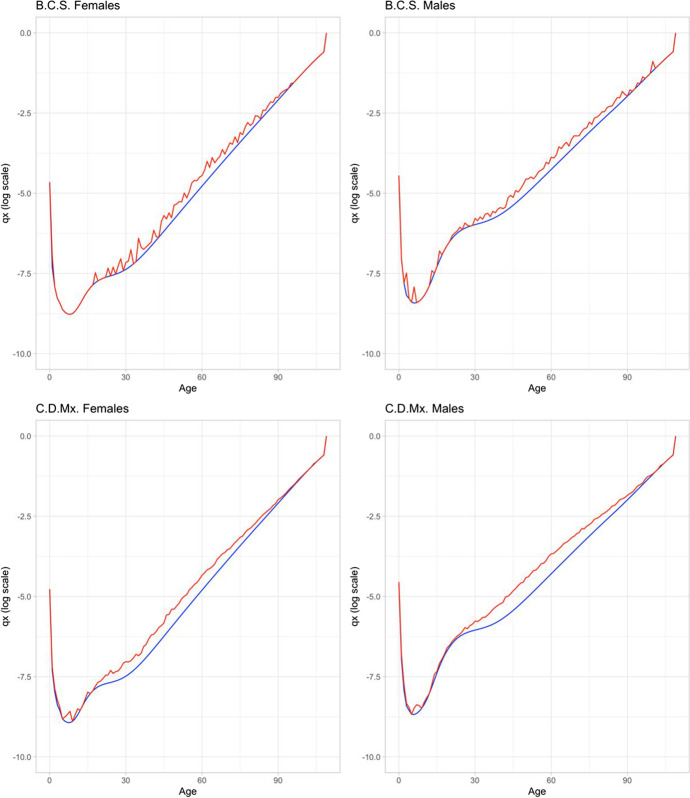
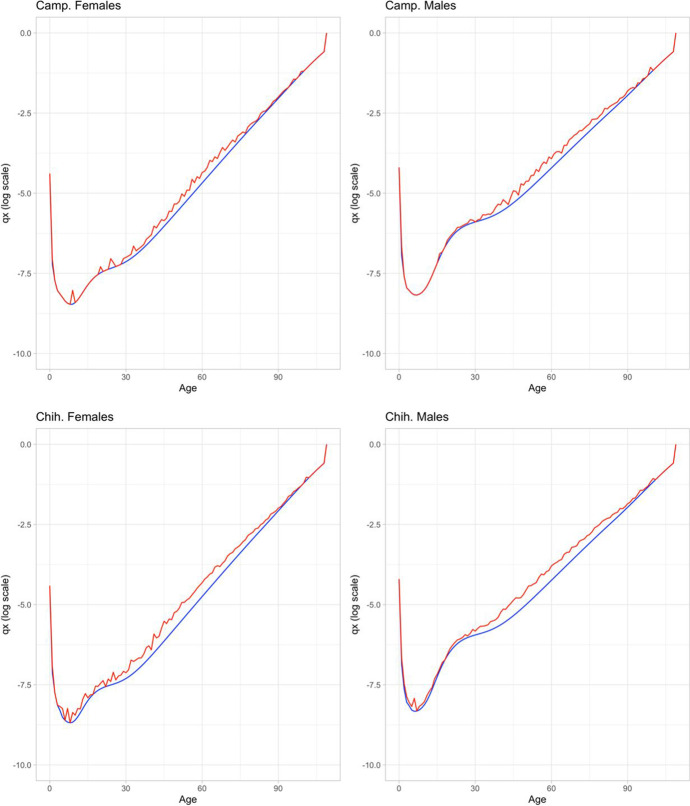
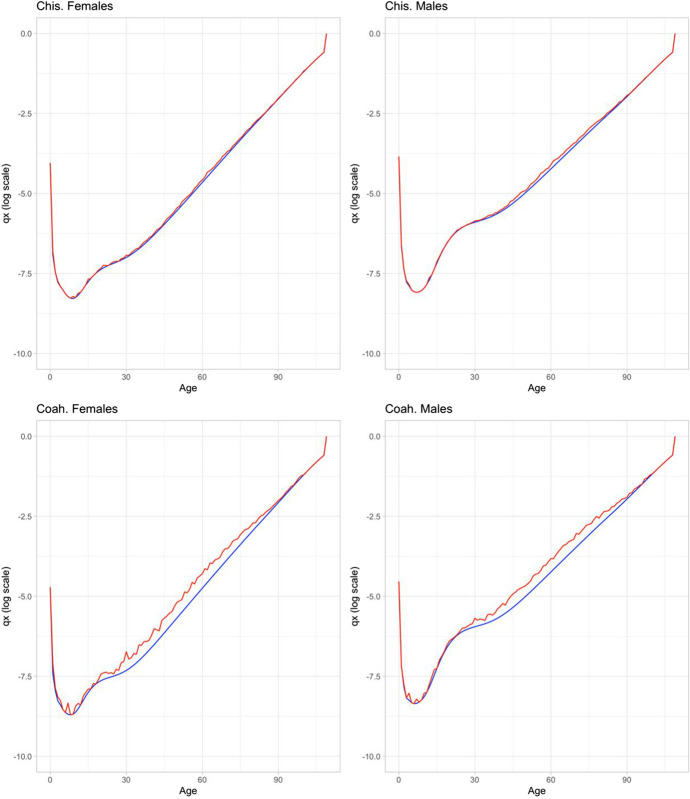
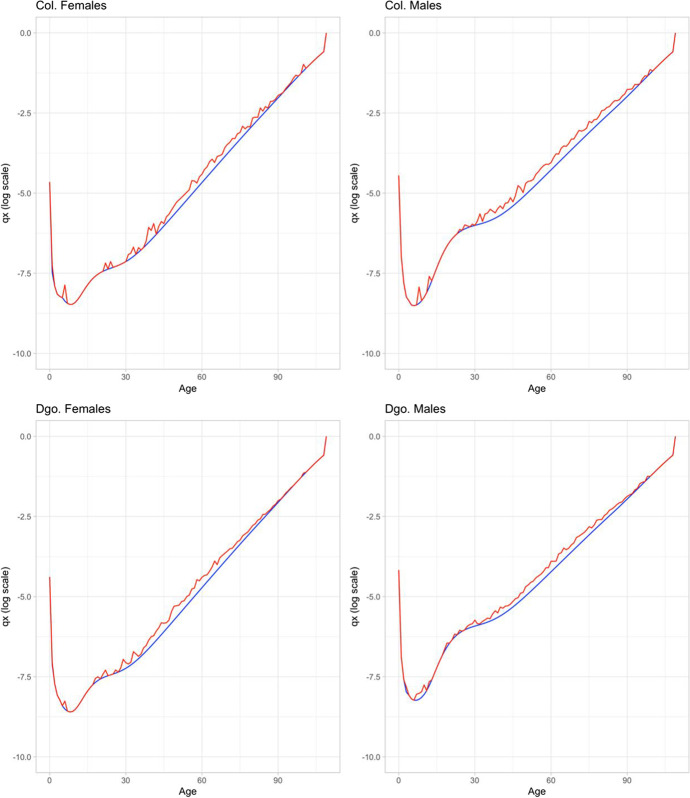
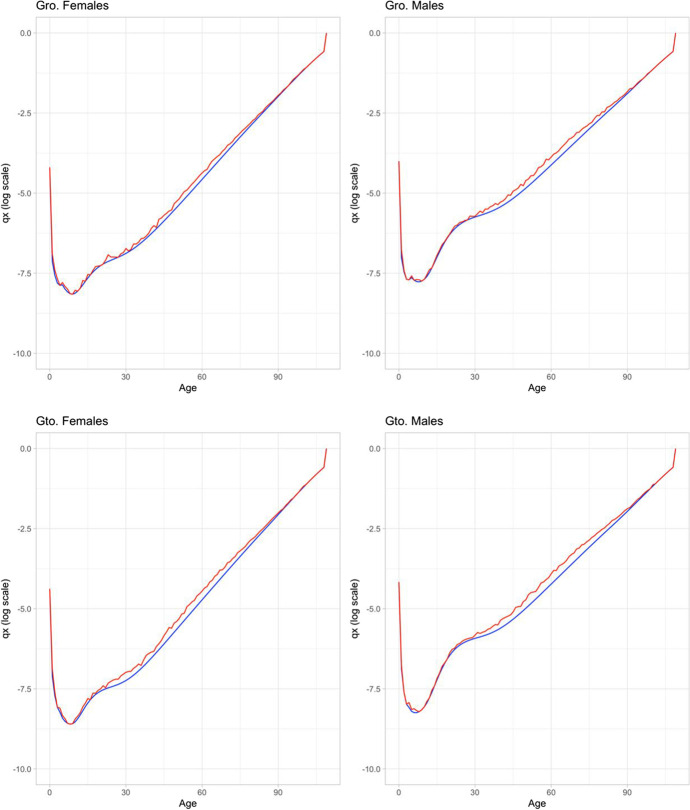
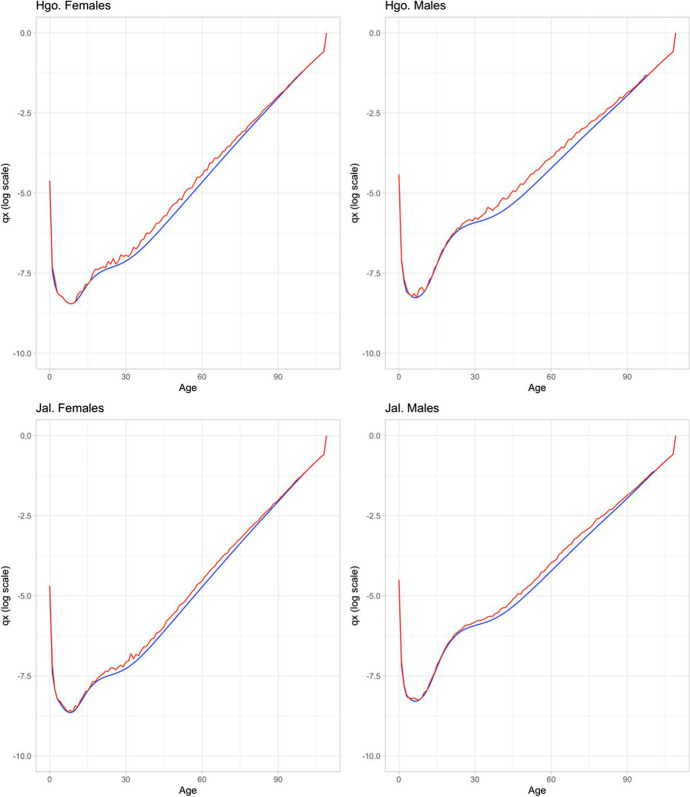
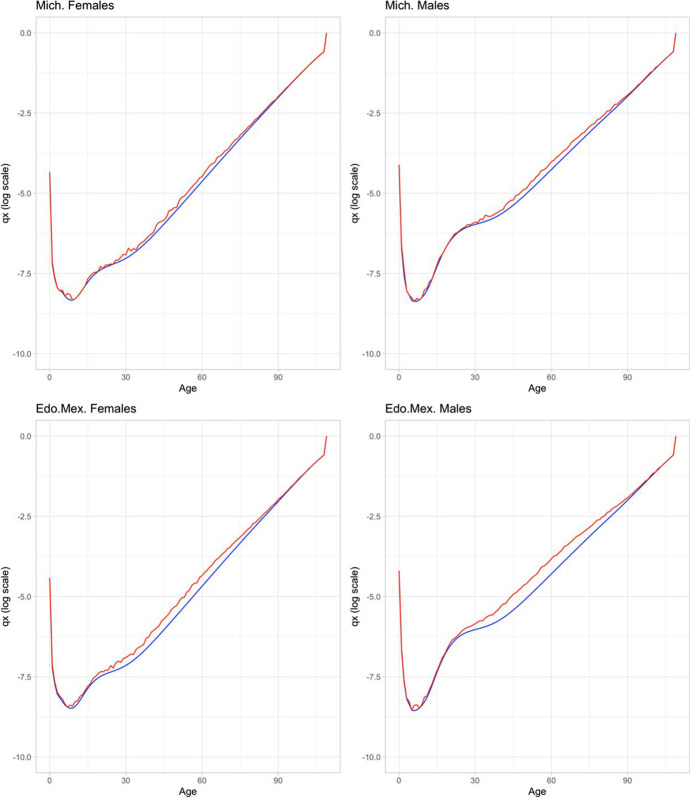
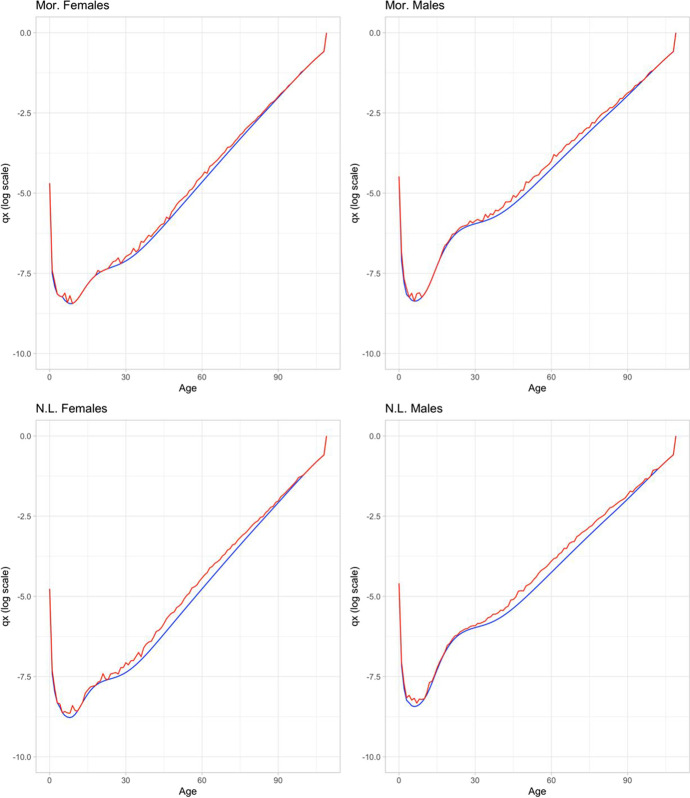
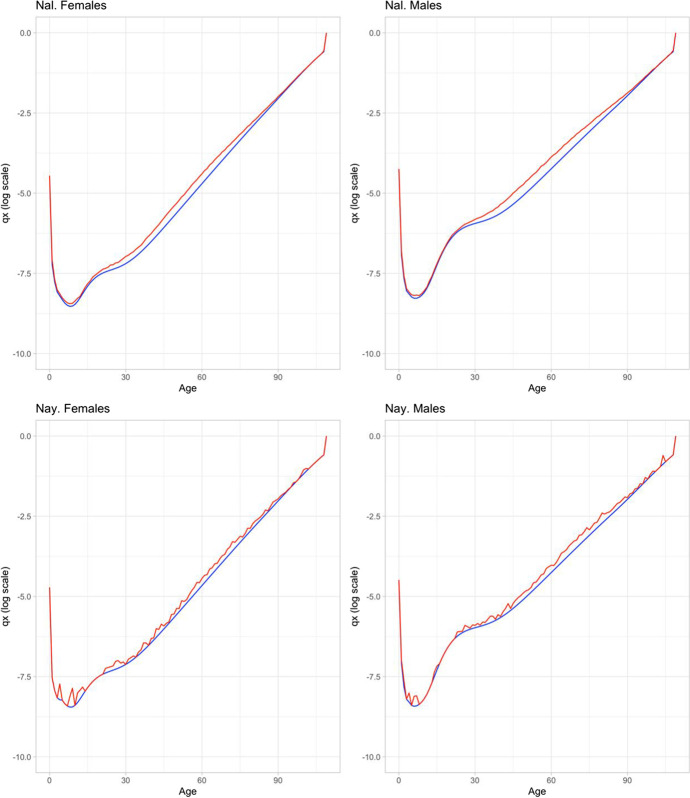
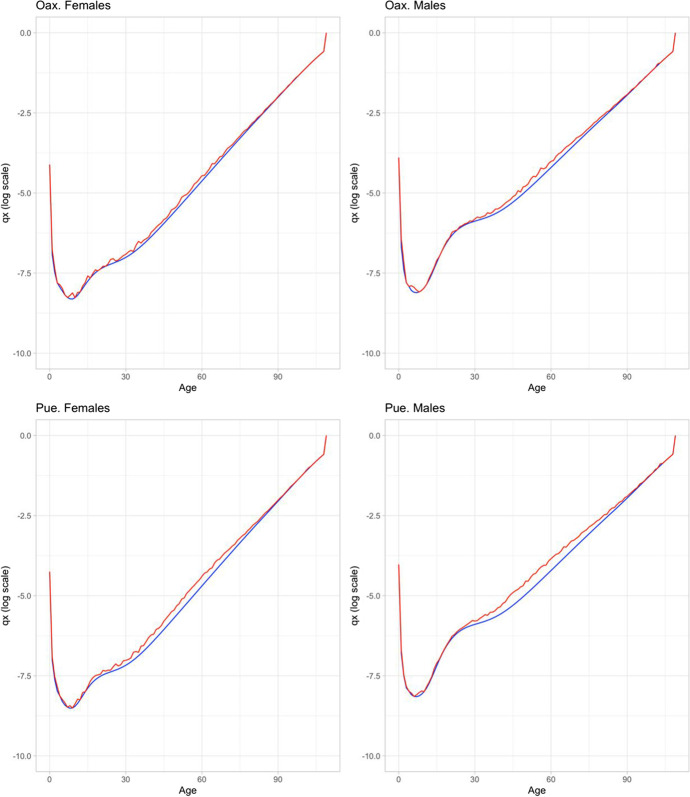
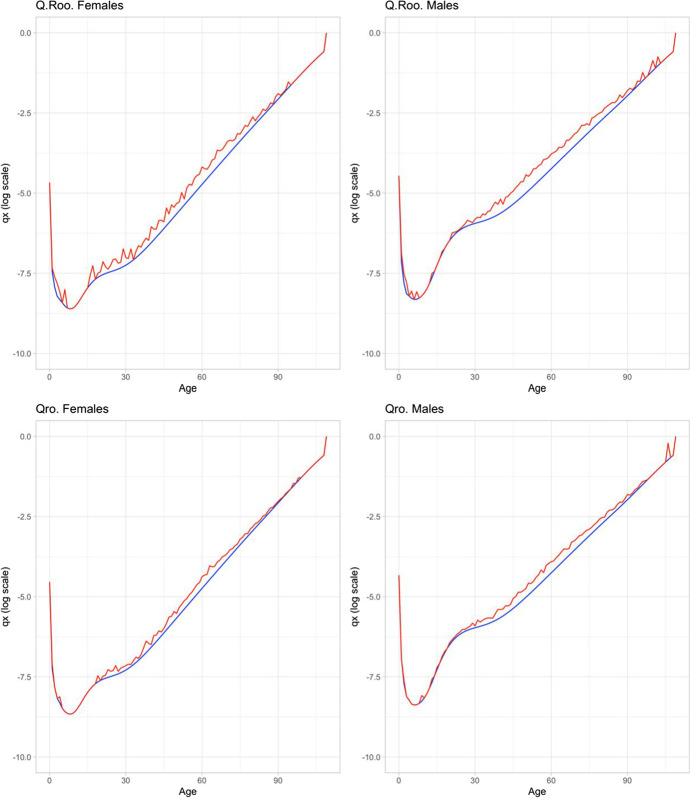
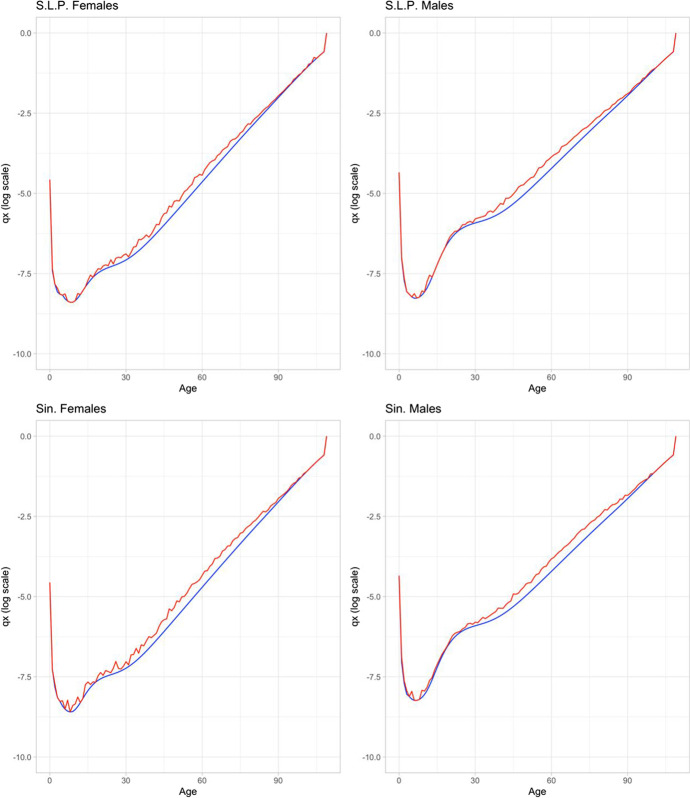
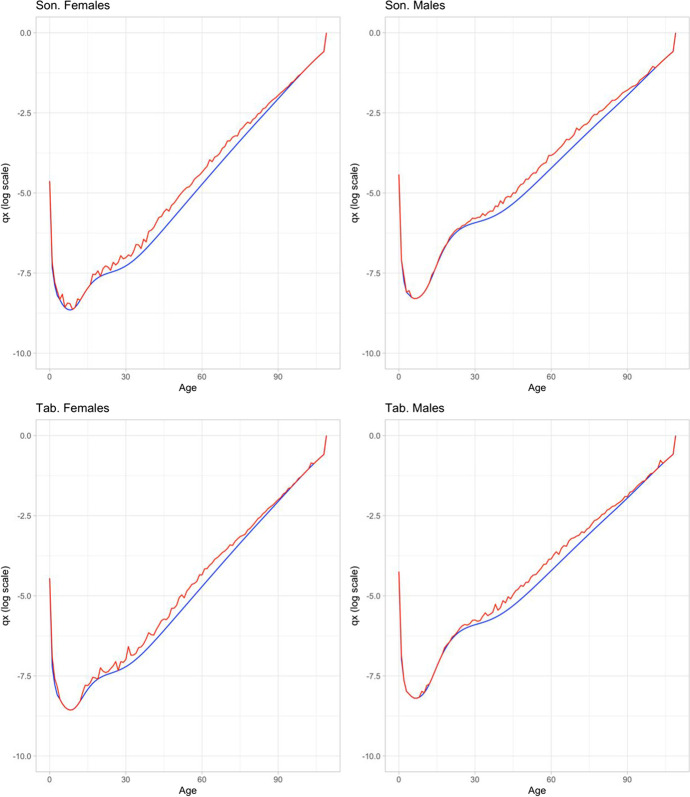
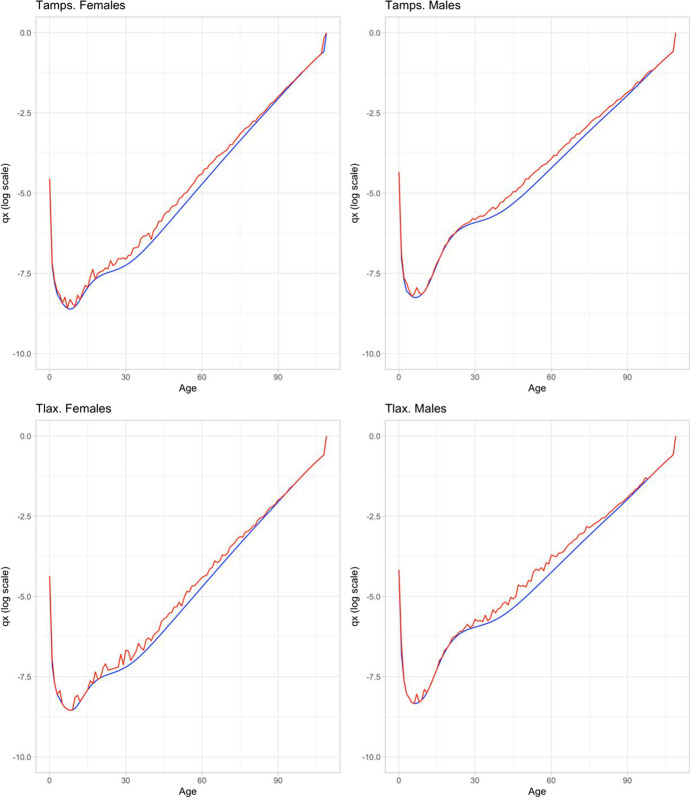
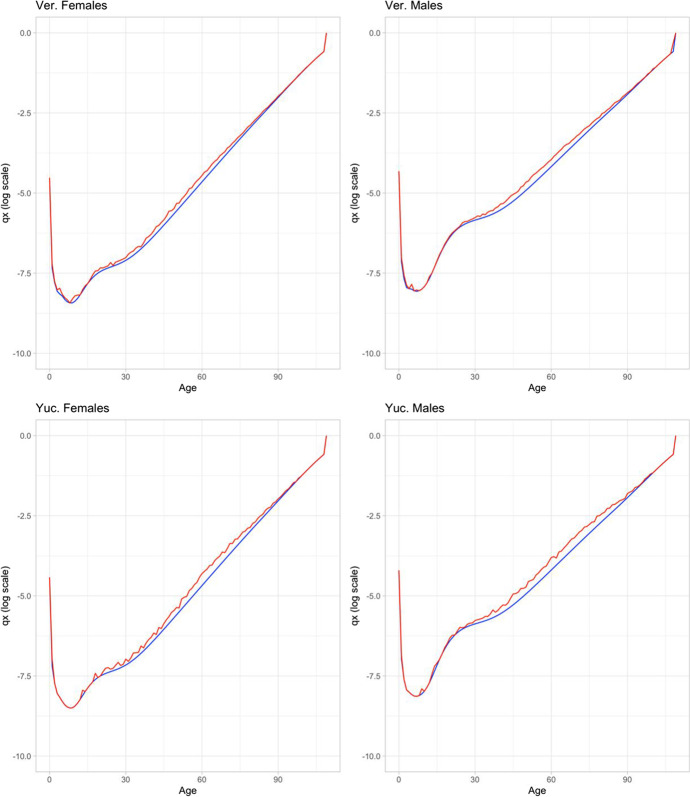
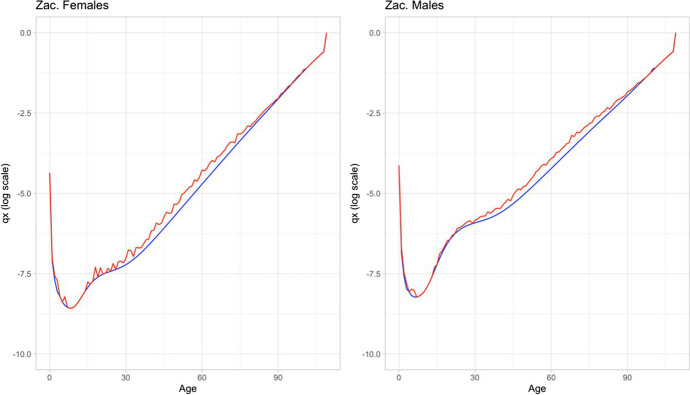
In order to better understand the impact of COVID-19, we further look at age-specific probabilities of dying () by sex and state (Fig. 2). The figure shows probabilities with (top panel) and without (bottom panel) COVID-19. We highlight Mexico City (red) and Chiapas (blue), the states with highest and lowest impact from COVID-19. The bottom panel of Fig. 2 shows that prior to the pandemic, the ’s in Chiapas are higher than those in Mexico City for all ages for both males and females. This is consistent as Chiapas is one of the poorest states, whereas Mexico City is one of the most developed states. However, after COVID-19, the ’s of these two states cross each other at ages that were more impacted by the disease (see top panel of Fig. 2). That is, Mexico City’s are higher than Chiapas’ after age 40 for females, and after age 30 for males. Nevertheless, all states have been hit by the pandemic. Figure 9 in the Appendix shows how after the pandemic are higher than before the pandemic, for both sexes and for all the states.
Fig. 2.
Age-specific probabilities of dying with and without COVID-19 by sex and state, February–December 2020. Source: Own calculations based on DGE-SS (2020) and CONAPO (2018). Names and acronyms of states are presented in Table 1 and Fig. 10
Fig. 9.
Comparison of conditional probabilities of death by age (log scale) with and without COVID-19 (red and blue, respectively) by sex and state. Source: Own calculations based on DGE-SS (2020) and CONAPO (2018). Names and acronyms of states are presented in Table 1 and Fig. 10
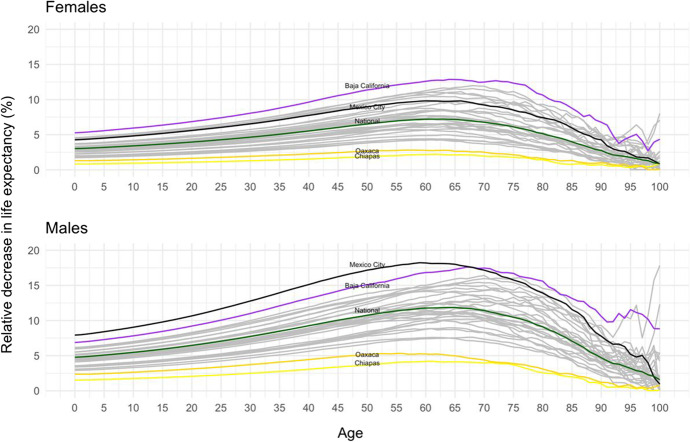
Results from Figs. 1 and 2 show clear sex and geographical differences in the age pattern of mortality from COVID-19. Men die, on average, at a younger age than females in states where the pandemic has hit the hardest. In states where the pandemic has had a less strong impact, the sex differentials by age are less clear. We further evaluate the age distribution of the relative decreases in life expectancy by sex at national and state levels. This relative measure indicates the percentage change in age-specific life expectancy due to COVID-19, relative to life expectancy forecasted by 2020 using pre-COVID-19 data (CONAPO, 2018). This measure is simply computed as: , where higher values indicate a greater loss of life expectancy at a given age .
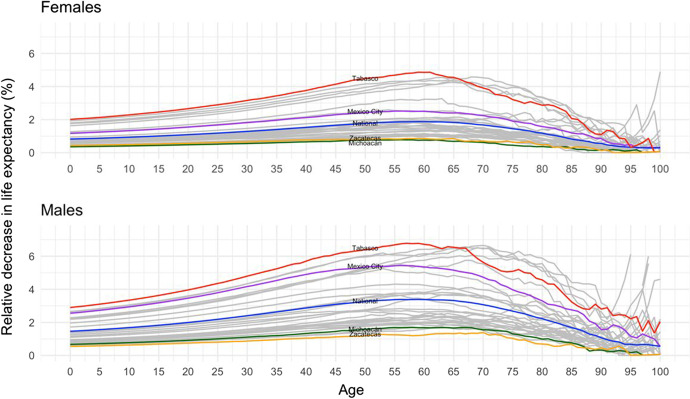
This indicator of relative decrease in life expectancy at different ages allows us to show two main results. First, at which ages there is a greater loss in years of life (an increase in the relative value); and second, at which age it reaches its maximum. Figure 3 shows the percentage change in age-specific life expectancy. It shows that the age distribution of the relative decrease in life expectancy is more dispersed for males than females, indicating that COVID-19 impacted men at more ages relative to women. The age pattern shows a concave downwards trend reaching its peak at ages 60–70 among males, and at ages 65–75 among females, except for Oaxaca and Chiapas where the peak is reached at younger ages. States that have been hit the hardest by the pandemic also experienced a greater loss of life at younger ages. The relative loss in life expectancy in Mexico City is quite large, reaching levels of 18% among males and 10% among females. Although the relative loss in life expectancy in Baja California is somewhat smaller than in Mexico City, it reached values at around 15% among males aged 65–70. This pattern is in sharp contrast to that found in states where the pandemic was less severe and where the peak was reached at younger ages. For example, Chiapas and Oaxaca are the states least affected by COVID-19, for both sexes, and it is clear that their population experienced low relative loss of life expectancy at every age. The age pattern of mortality for people in these two states is fairly flat with relative losses in life expectancy close or below 5% at every age for both men and women.
Fig. 3.
Age distribution of the relative decrease in life expectancy by sex at national and state levels, February–December 2020. Source: Own calculations based on DGE-SS (2020) and CONAPO (2018)
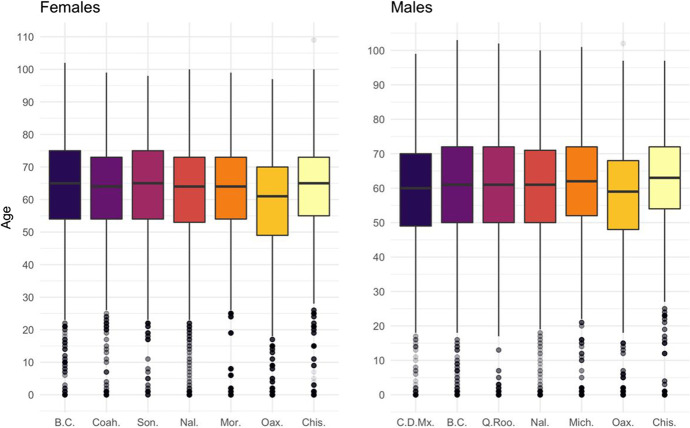
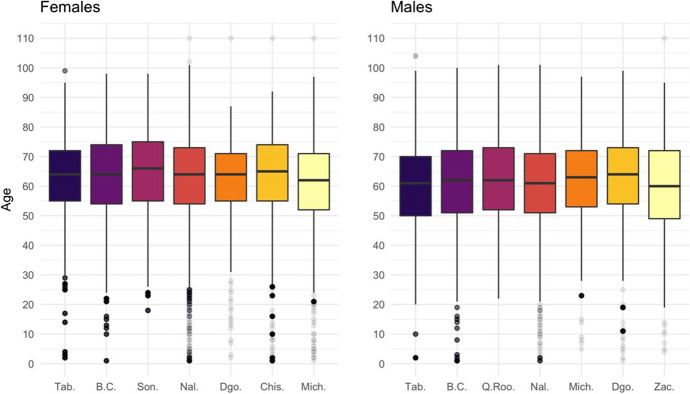
We further disaggregated the results by estimating age decompositions of loss of years of life at the national and state levels following the method proposed by Arriaga (1984). We focus on the three most and least affected states by the pandemic during 2020, with the highest and lowest years of LE0 as shown in Fig. 1. In order to simplify the results from the age decompositions, we graph box plots to indicate the ages at which there was a certain percent accumulation of years of life lost (Fig. 7 at the Appendix). The interquartile range (IQR) is around 20 years and it is mainly concentrated between ages 50 and 70, which indicates that about half of the loss in LE0 due to COVID-19 occurred among people aged 50–70. The values for females indicate a slightly older pattern than males (5 years older).
Fig. 7.
Quartiles of age decomposition of loss in life expectancy due to COVID-19, by sex for selected states and at national level, February–December 2020. Source: Own calculations based on DGE-SS (2020) and CONAPO (2018). Names and acronyms of states are presented in Table 1 and Fig. 10
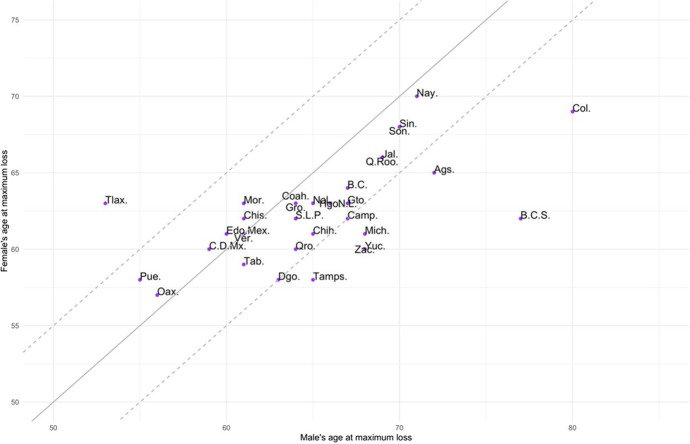
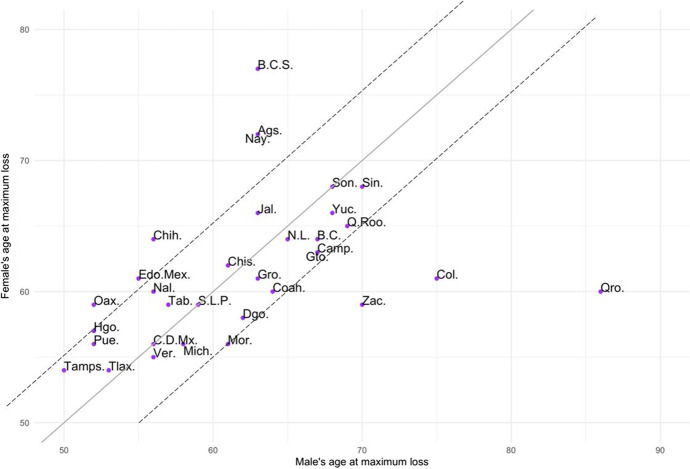
Figure 3 also shows clear differences by sex in the age at which there is the largest loss of life expectancy. This differential pattern by sex is further shown in Fig. 4, where each dot represents a state with the age at the largest loss of life expectancy for women on the y-axis and the corresponding value for men on the x-axis. The solid diagonal line corresponds to the identity line, values below it indicate that females experienced larger loss of life expectancy at a younger age than men in the same state, and the opposite is true for values above the identity line. In more than 75% of the states, females had the largest loss of life expectancy at a younger age than males. For the most part, however, the sex difference in the age of largest loss of life expectancy is within a 5-year age range. Nonetheless, in three states (Aguascalientes, Baja California Sur, and Colima), women experienced the age at maximum loss of life expectancy at a considerably much younger age than men (more than 15 years younger), while the opposite is true in one state (Tlaxcala).
Fig. 4.
Age at maximum loss of life expectancy due to COVID-19 by sex and state, February–December 2020. Source: Own calculations based on DGE-SS (2020) and CONAPO (2018). Names and acronyms of states are presented in Table 1 and Fig. 10
Sensitivity analysis
It is well-known that there is an under-registration of COVID-19 deaths in most countries of the world. Mexico is not an exception. We conducted a sensitivity analysis to ascertain the potential impact of COVID-19 on life expectancy at birth by focusing on Mexico City as a case study. Mexico City was heavily affected by the pandemic early on as it recorded two of the first three COVID-19 cases at the end of February. It is worth noting that the under-registration of COVID-19 deaths in Mexico is exacerbated by the lack of an electronic vital registration system in the country. For example, in Mexico City, death certificates are filled out in the alcaldías (equivalent to municipalities ) which are then collected by a main office that sends paper copies of these certificates to the Mexican National Institute of Statistics and Geography (INEGI) for processing and recording at a later date. The processing time can beseveral weeks and it is during that time that COVID-19 deaths are likely to go unnoticed, even if they were recorded in the death certificate. We thus conducted two sets of analyses. First, we looked at the number of weekly death certificates recorded in the city during the year 2020 and compared it with death counts from the previous four years. We used weekly data on death certificates in Mexico City from Romero and Despeghel (2020). Second, we estimated the loss of life expectancy at birth in Mexico City considering two scenarios: half of death certificates are attributable to COVID-19 and the other half are excess of deaths due to other causes.
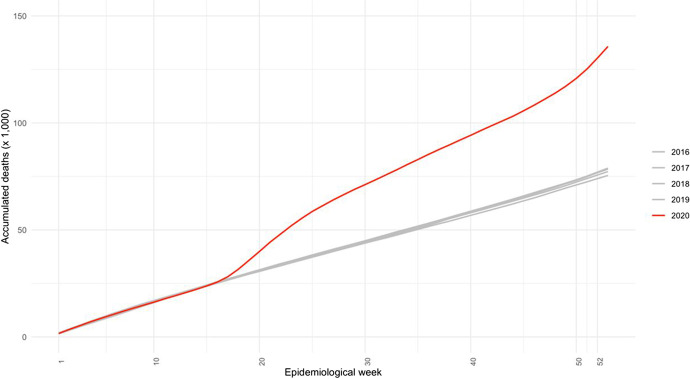
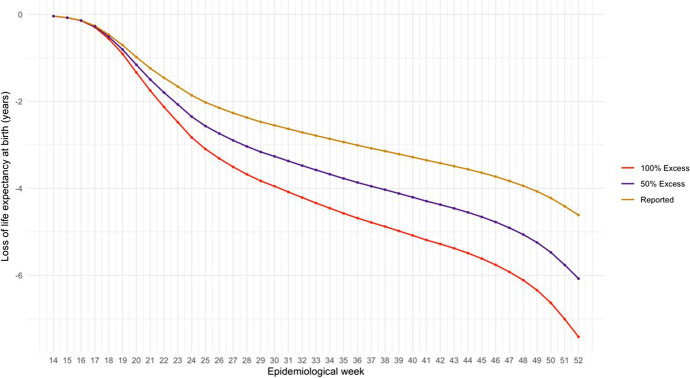
Our results show that starting at week 15 (end of April), there was a divergent pattern in the number of deaths being recorded in death certificates in 2020 relative to the number of deaths registered in the 4 years prior (see Fig. 8 in the Appendix). For example, by week 21 (early May), the cumulative number of deaths was more than 20,000 higher than in the four previous years. This is equivalent to a 170% increase in the cumulative number of deaths. This percentage kept constant by the end of 2020, but it represents more than 60,000 cumulated deaths than the observed values in the previous years. Excess mortality in Mexico City is expected to have major effects on LE0 (Fig. 5). For example, if we assume that about half of the death certificates in the city are due to COVID-19 during this period of time, we estimate that LE0 could have been reduced by about 6 years by the end of 2020. Moreover, if we consider that the rest of death certificates are from causes other than COVID-19, the loss in life expectancy is even greater, of about 7.5 years. This exercise illustrates the major impact that COVID-19 may be having on the Mexican population.
Fig. 8.
Cumulative excess mortality observed by epidemiological week from 2016 to 2020 per 1000 inhabitants. Mexico City. Both sexes. Source: Own calculations based on data from https://github.com/mariorz/folio-deceso
Romero (2020)
Fig. 5.
Loss of life expectancy at birth due to COVID-19 , reported and estimated, by epidemiological week. Mexico City, both sexes combined, February–December 2020. Source: Own calculations based on DGE-SS (2020), CONAPO (2018), and
Romero (2020)
Discussion
The aim of this paper is to study the impact of COVID-19 deaths in Mexico by sex and state using the loss of life expectancy at birth (LE0) as a proxy measure. We also focus on sex differences in mortality by calculating a relative measure of the sex gap in life expectancy at some ages. This study reports three central findings. First, males have lost more years of LE0 than females due to COVID-19. This is also evident across states. In over 70% of the states, men have lost more than 3 years of life due to COVID-19, whereas this pattern is seen among women in only 22% of the states. Second, age decompositions further clarify that men not only lost more years of life expectancy due to COVID-19, but that they experienced a larger relative loss in life expectancy than females. Mexico City stands out as the state with higher relative loss among males than females, and where males also experienced higher loss at younger ages. In states heavily affected by the pandemic, such as Baja California and Mexico City, men experienced losses in life expectancy of about 20% while the corresponding figures for females are near 15%. Third, females experienced the largest loss of life expectancy at younger ages than males. These findings highlight a large burden of the pandemic on the Mexican population in general.
By December 2020, Mexico was among the three countries with the highest number of deaths due to COVID-19 in the world, and the country had lost 2.5 and 3.6 years of LE0 for females and males, respectively. To put these values in context, between 2005 and 2015, a period characterized by the effects of the so-called War on Drugs declared by President Calderón in 2006, LE0 declined by about 0.18 and 1 years for females and males, respectively (Canudas-Romo et al., 2014, 2016; Aburto et al., 2016; Aburto & Beltrán-Sánchez, 2019). The COVID-19 pandemic has exacerbated the mortality burden on the Mexican population in 2020 as the loss in LE0 far exceeds the declines in LE0 observed during a period of conflict and violence.
However, national estimates underscore major heterogeneity across states. Our results for Mexico City show that the loss of LE0 associated with COVID-19 is about 3.5 and 6 years for females and males, respectively. For Baja California, there is a loss of LE0 of 4 and 5 years for females and males, respectively. According to data from the Mexican Population Council, it took about 12 years for Mexico City to increase LE0 by about 3.5 years (from 69.5 to 73 in 2006) and it took 16 years to Baja California to increase LE0 by 4.5 years.7 This gain in life expectancy was largely eliminated by the impact of COVID-19 in a very short period of time. Moreover, sensitivity analysis suggests that the impact of COVID-19 on life expectancy at birth is likely to be much larger in the Mexican population.
Mexico, as most countries in the world, struggled with developing and implementing adequate public health measures early in the pandemic, and the response from the Mexican government appeared to have been taken too long. Italy, for example, implemented a series of measures early on starting with a lockdown of cities, then regions, and finally the entire country. However, these measures did not appear to reduce the spread of the virus as the Italian population did not generally adhere to them. In Mexico, however, although the first three cases of COVID-19 were confirmed on February 27, it was not until a month later (March 24) that the Mexican government began promoting a physical distancing measure, and even now there has not been a consistent policy on mask wearing. As it was the case in many other countries, including Italy and the US, the Mexican government failed to appropriately communicate the seriousness of the pandemic.
Our study has some limitations. First, the number of COVID-19 deaths in several states may be higher than officially reported, especially among older adults and among those who died early in the pandemic when there was no PRC testing available, before the peak of the first wave. Moreover, people who died at home or in non-urban areas may not have been tested for COVID-19 as testing was reserved for those hospitalized with severe symptoms. At the beginning of the second wave (by the beginning of November 2020), testing was available at different public and private laboratories but was not yet widely available. The deaths of those who without a test may not have been attributed to COVID-19 and, in some cases, were coded as atypical pneumonia (Escudero et al., 2020). Thus, our calculation of death rates may represent a conservative estimate as it was based on reported deaths. Second, we use a life table approach to assess the impact of COVID-19 because it creates an indicator such as life expectancy that is easy to understand and it is comparable across regions. This allows us to use it as a proxy to assess differences across states on the impact of COVID-19. However, we note an important limitation of this approach as it inherently assumes a stationary state in the mortality process. This implies that newborns in each state experience the COVID-19 mortality rates representing a long period of time and they are unable to ever leave. That is, we assumed that every member of a hypothetical cohort lives their entire life under a COVID-19 regime. While this is in principle a possibility, it is an unlikely scenario. We thus caution that our results may overestimate the impact on life expectancy of COVID-19.
In conclusion, the mortality burden of COVID-19 varies substantially across states in Mexico when measured by loss of years of life expectancy. A more organized government effort early in the pandemic focusing on successful containment and mitigation measures may have lessened the burden for some states, particularly in regions characterized by high mobility and high population density such as Mexico City, Baja California, and Quintana Roo. Although our results highlight major impacts of COVID-19 on life expectancy, they are likely to be conservative and may represent about half the real impact of the pandemic, as shown in the case of Mexico City. Continual assessment of the pandemic will help state governments quantify the effect of current and new public health measures.
Appendix
Fig. 10.
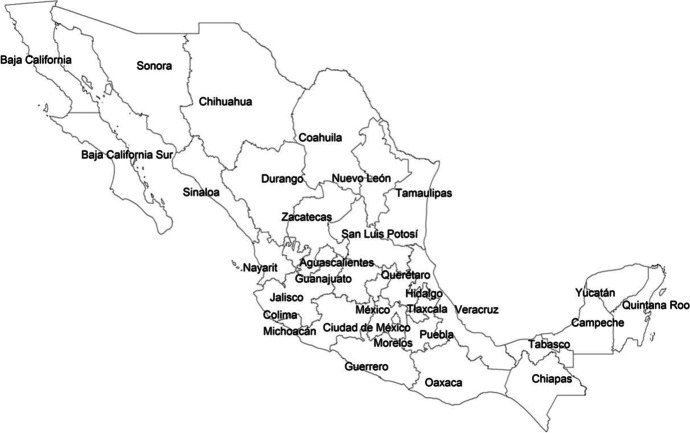
Map of Mexico and its states
Fig. 11.
Subnational distribution of years of life expectancy at birth lost due to COVID-19 by sex, February–August 2020. Source: Own calculations based on DGE-SS (2020) and CONAPO (2018). Names and acronyms of states are presented in Table 1 and Fig. 10
Fig. 12.
Quartiles of age decomposition in life expectancy at birth’s difference with and without COVID-19 by sex for selected states and at national level, February–August 2020. Source: Own calculations based on DGE-SS (2020) and CONAPO (2018). Names and acronyms of States are presented in Table 1 and Fig. 10
Fig. 13.
Age distribution of the relative decrease in life expectancy by sex at national and state levels, February–August 2020. Source: Own calculations based on DGE-SS (2020) and CONAPO (2018)
Fig. 14.
Age at maximum loss of life expectancy due to COVID-19 by sex and State, February–August 2020. Source: Own calculations based on DGE-SS (2020) and CONAPO (2018). Names and acronyms of states are presented in Table 1 and Fig. 10
Table 1.
Names and acronyms of Mexican states
| Name | Acronym |
|---|---|
| Aguascalientes | Ags. |
| Baja California | B.C. |
| Baja California Sur | B.C.S. |
| Campeche | Camp. |
| Coahuila | Coah. |
| Colima | Col. |
| Chiapas | Chis. |
| Chihuahua | Chih. |
| Ciudad de México/Mexico City | C.D.Mx. |
| Durango | Dgo. |
| Guanajuato | Gto. |
| Guerrero | Gro. |
| Hidalgo | Hgo. |
| Jalisco | Jal. |
| Estado de México | Edo.Mex. |
| Michoacán | Mich. |
| Morelos | Mor. |
| Nayarit | Nay. |
| Nuevo León | N.L. |
| Oaxaca | Oax. |
| Puebla | Pue. |
| Querétaro | Qro. |
| Quintana Roo | Q.Roo. |
| San Luis Potosí | S.L.P. |
| Sinaloa | Sin. |
| Sonora | Son. |
| Tabasco | Tab. |
| Tamaulipas | Tamps. |
| Tlaxcala | Tlax. |
| Veracruz | Ver. |
| Yucatán | Yuc. |
| Zacatecas | Zac. |
| National | Nal. |
Funding
Beltrán-Sánchez received support from grants by the National Institute on Aging (R01AG052030) and the National Institute of Child Health and Human Development (P2C-HD041022) to the California Center for Population Research at UCLA.
Data availability
Data is available in https://www.gob.mx/salud/documentos/datos-abiertos-1521270, and https://datos.gob.mx/busca/dataset/proyecciones-de-la-poblacion-de-mexico-y-de-las-entidades-federativas-2016-2050 and the code is available upon request.
Declarations
Conflict of interest
The authors declare no competing interests.
Research involving human participants and/or animals
This research does not contain any studies involving human participants or animals performed by any of the authors.
Footnotes
ASDT assumes independence among the causes of death. We are aware that this assumption constitutes a limitation to the method when one cause of death is taken out. However, this assumption allowed us to add COVID-19 as a new cause of death. Future studies might explain better how COVID-19 is associated with other causes of death, but when the pandemic was declared, it was defined as a novel cause of death, similar to what we implement in our method.
According to Preston et al. (2001, p. 82), this assumption is reasonable when using single years of age and assuming that the rate of increment is constant in the age interval.
The first version of this paper used deaths reported by August 17, 2020, that corresponded to deaths that occurred up to August 1, 2020, due to lags in the recording system. Figures 11, 12, 13, and 14 show these results.
These life tables were calculated by the Mexican National Population Council (CONAPO, 2017) using the demographic information available (census, demographic surveys —mainly to estimate infant mortality— and vital statistics) to calculate the life tables from 1950 to 2015 at national level and from 1970 to 2015 at state level. From this demographic reconstruction, the life tables at the national and state level are projected from 2016 to 2050 using a variant of the Lee-Carter method (CONAPO, 2018). The complete methodology for the estimates and projections is available at CONAPO’s website. Both the demographic conciliation and the population projections have been carried out by a group of demographers, and constitute the official information used for national decision-making.
The results by the end of the first wave of the pandemic are shown in Figs. 11, 12, 13, and 14 in the Appendix.
Mexico City is the capital of the country and is considered one of the 32 states. The Metropolitan Area of the Valley of Mexico includes both Mexico City (Ciudad de México) and the State of Mexico (Estado de México).
Since 2006, Mexico City and Baja California have decreased their life expectancies due to increase in homicides.
Publisher’s Note
Springer Nature remains neutral with regard to jurisdictional claims in published maps and institutional affiliations.
Contributor Information
Víctor M. García-Guerrero, Email: vmgarcia@colmex.mx
Hiram Beltrán-Sánchez, Email: beltrans@ucla.edu.
References
- Abdullah A. The double burden of undernutrition and overnutrition in developing countries: An update. Current Obesity Reports. 2015;4:337–349. doi: 10.1007/s13679-015-0170-y. [DOI] [PubMed] [Google Scholar]
- Aburto JM, Beltrán-Sánchez H. Upsurge of homicides and its impact on life expectancy and life span inequality in Mexico, 2005–2015. The American Journal of Public Health. 2019;109(3):483–489. doi: 10.2105/AJPH.2018.304878. [DOI] [PMC free article] [PubMed] [Google Scholar]
- Aburto JM, Beltrán-Sánchez H, García-Guerrero VM, Canudas-Romo V. Homicides in Mexico reversed life expectancy gains for men and slowed them for women, 2000–10. Health Affairs. 2016 doi: 10.1377/hlthaff.2015.0068. [DOI] [PMC free article] [PubMed] [Google Scholar]
- Arriaga E. Measuring and explaining the change in life expectancies. Demography. 1984;21(1):83–96. doi: 10.2307/2061029. [DOI] [PubMed] [Google Scholar]
- Canudas-Romo V, Aburto JM, García-Guerrero VM, Beltran-Sánchez H. Mexico’s Epidemic of Violence and its Public Health Significance on Average Length of Life. Journal of Epidemiology & Community Health. 2016 doi: 10.1136/jech-2015-207015. [DOI] [PMC free article] [PubMed] [Google Scholar]
- Canudas-Romo V, García-Guerreo VM, Echarri-Canovas CJ. The stagnation of the Mexican male life expectancy in the first decade of the 21st century: The impact of homicides and diabetes mellitus. Journal of Epidemiology & Community Health. 2014;69(1):28–34. doi: 10.1136/jech-2014-204237. [DOI] [PubMed] [Google Scholar]
- Comité Nacional para la Vigilacia Epidemiológica CONAVE . Aviso Epidemiológico CONAVE /09/ 2020/COVID-19, 6 de abril del 2020. Secretaría de Salud; 2020. [Google Scholar]
- Consejo Nacional de Población CONAPO . Conciliación demográfica de México 1950–2015. SEGOB, CONAPO, COLMEX, UNFPA México; 2017. [Google Scholar]
- Consejo Nacional de Población CONAPO . Proyecciones de la población de México y sus entidades federativas, 2016–2050, Documento metodológico. Secretaría de Gobernación, CONAPO, UNFPA México; 2018. [Google Scholar]
- Dowd JB, Andriano L, Brazel DM, Rotondi V, Block P, Ding X, Liu Y, Mills MC. Demographic science aids in understanding the spread and fatality rates of COVID-19. Proceedings of the National Academy of Sciences. 2020;117(18):9696–9698. doi: 10.1073/pnas.2004911117. [DOI] [PMC free article] [PubMed] [Google Scholar]
- Glassman A, Gaziano T, Bouillon Buendia CP, Guanais de Aguiar FC. Confronting the chronic disease burden in Latin America and the Caribbean. Health Affairs. 2020;20(12):2142–2148. doi: 10.1377/hlthaff.2010.1038. [DOI] [PubMed] [Google Scholar]
- Kroker-Lobos MF, Pedroza-Tobías A, Pedraza LS, Rivera JA. The double burden of undernutrition and excess body weight in Mexico. The American Journal of Clinical Nutrition. 2014;100(6):1652S–1658S. doi: 10.3945/ajcn.114.083832. [DOI] [PubMed] [Google Scholar]
- Min J, Zhao Y, Slivka L, Wang Y. Double burden of diseases worldwide: Coexistence of undernutrition and overnutrition-related non-communicable chronic diseases. Obesity Reviews. 2018;19:49–61. doi: 10.1111/obr.12605. [DOI] [PMC free article] [PubMed] [Google Scholar]
- Preston S, Heuveline P, Guillot M. Demography. Measuring and Modeling Population Processes. Blackwell Publishers Inc; 2001. [Google Scholar]
- Rivera JA, Pedraza LS, Martorell R, Gil A. Introduction to the double burden of undernutrition and excess weight in Latin America. The American Journal of Clinical Nutrition. 2014;100(6):1613S–1616S. doi: 10.3945/ajcn.114.084806. [DOI] [PubMed] [Google Scholar]
- Suárez V, Suarez Quezada M, Oros Ruiz S, Ronquillo De Jesús E. Epidemiología de COVID-19 en México: Del 27 de febrero al 30 de abril de 2020. Revista Clinica Espanola. 2020;220(8):463–471. doi: 10.1016/j.rce.2020.05.007. [DOI] [PMC free article] [PubMed] [Google Scholar]
- Dirección General de Epidemiología, Secretaría de Salud, DGE-SS (2020). Datos Abiertos-Dirección General de Epidemiología. Accesed on 04/15/2021. https://www.gob.mx/salud/documentos/datos-abiertos-152127?idiom=es. Accessed 24 June 2021
- Escudero X, Guarner J, Galindo-Fraga A, Escudero-Salamanca M, Alcocer-Gamba M, del Rio C. The SARS-CoV-2 (COVID-19) coronavirus pandemic: Current situation and implications for Mexico. Archivos de Cardiología de México. 2020;90(1):7–14. doi: 10.24875/acm.m20000064. [DOI] [PubMed] [Google Scholar]
- Gutiérrez, H., González-Ortiz, L., González-Sánchez, O., Montesinos, A., & Brizuela, N. (2020). Lentitud en los procesos de registro y su impacto en la subestimación y percepción de la magnitud de la pandemia por COVID-19 en México, Taller de datos, Nexos. https://tinyurl.com/z7sacnpc
- Hasell, J., Mathieu, E., Beltekian, D. et al. (2020). A cross-country database of COVID-19 testing. Sci Data,7, 345. Retrieved from: https://ourworldindata.org/coronavirus-testing. Accessed 24 June 2021 [DOI] [PMC free article] [PubMed]
- Kaplan, J., Frias, L., & McFall-Johnsen, M. (2020). Our ongoing list of how countries are reopening, and which ones remain under lockdown. Business Insider, consulted on 09/23/2020 https://www.businessinsider.com/countries-on-lockdown-coronavirus-italy-2020-3?r=MX&IR=T
- Kashnitsky, I., & Aburto, J. M. (2020). COVID-19 in unequally ageing European regions. World Development,136, 105170. 10.1016/j.worlddev.2020.105170 [DOI] [PMC free article] [PubMed]
- Our World in Data (2020). Coronavirus pandemic data explorer. Retrieved from https://ourworldindata.org/coronavirus-data-explorer?yScale=log&zoomToSelection=true&time=2020-0801..latest&country=BRA~MEX~USA®ion=World&deathsMetric=true&interval=smoothed&aligned=true&smoothing=7&pickerMetric=location&pickerSort=asc. Accessed 24 June 2021
- Romero, M. (2020). folio-deceso a Github data repository for measuring excess of mortality in Mexico City in the context of the COVID-19 pandemic. Accessed on 08/05/2020. Available at https://github.com/mariorz/folio-deceso. Accesed date June 24, 2021
- Romero, M. & Despeghel, L. (2020). ¿Qué nos dicen las actas de defunción de la CDMX? Actualización al 2 de agosto 2020, Taller de datos, Nexos, retrieved from https://datos.nexos.com.mx/?p=1616
- Secretaría de Salud, Subsecretaría de Prevención y Promoción de la Salud, SS-SPPS (2020a). Informe técnico diario 01/08/2020. Retrieved from https://www.gob.mx/cms/uploads/attachment/file/571170/Comunicado_Tecnico_Diario_COVID-19_2020.08.01.pdf. Accessed 24 June 2021
- Secretaría de Salud, Subsecretaría de Prevención y Promoción de la Salud, SS-SPPS (2020b). Conferencias diarias de prensa. Retrieved from https://coronavirus.gob.mx/category/fase-1/. Accessed 24 June 2021
- World Health Organization, WHO (2020). Timeline of WHO’s response to COVID-19. Last updated 9 September 2020. Retrieved from https://www.who.int/news-room/detail/29-06-2020-covidtimeline. Accessed 24 June 2021
Associated Data
This section collects any data citations, data availability statements, or supplementary materials included in this article.
Data Availability Statement
Data is available in https://www.gob.mx/salud/documentos/datos-abiertos-1521270, and https://datos.gob.mx/busca/dataset/proyecciones-de-la-poblacion-de-mexico-y-de-las-entidades-federativas-2016-2050 and the code is available upon request.


