Abstract
Plants seem to take up exogenous RNA that was artificially designed to target specific genes, followed by activation of the RNA interference (RNAi) machinery. It is, however, not known whether plants use RNAs themselves as signalling molecules in plant-to-plant communication, other than evidence that an exchange of small RNAs occurs between parasitic plants and their hosts. Exogenous RNAs from the environment, if taken up by some living organisms, can indeed induce RNAi. This phenomenon has been observed in nematodes and insects, and host Arabidopsis cells secrete exosome-like extracellular vesicles to deliver plant small RNAs into Botrytis cinerea. Here we show that micro-RNAs (miRNAs) produced by plants act as signalling molecules affecting gene expression in other, nearby plants. Exogenous miRNAs, such as miR156 and miR399, trigger RNAi via a mechanism requiring both AGO1 and RDR6. This emphasizes that the production of secondary small interfering RNAs is required. This evidence highlights the existence of a mechanism in which miRNAs represent signalling molecules that enable communication between plants.
Subject terms: Plant signalling, Plant physiology
This study shows that miRNAs produced by plants act as signalling molecules that affect gene expression in nearby plants. This RNAi induced by exogenous miRNAs enables communication between plants and requires the production of secondary siRNAs.
Main
Small RNAs (sRNAs) are 21- to 24-nucleotide non-coding molecules that affect a variety of developmental and physiological processes in plants1. There are two groups of sRNAs, based on their biogenesis and mode of action. Micro-RNAs (miRNAs) belong to the first group, which comprises sRNAs encoded by specific genes producing a single-stranded, self-complementary, non-coding RNA that forms a hairpin structure subsequently processed by Dicer-like proteins (DCL) to produce a 21- to 22-nucleotide mature miRNA. The second group includes small interfering RNAs (siRNAs), which result from DCL-dependent cleavage of a double-stranded RNA molecule synthesized by RNA-DEPENDENT RNA POLYMERASE6 (RDR6). Single-stranded sRNAs are loaded onto ARGONAUTE (AGO) proteins belonging to the RNA-induced silencing complex. miRNAs are predominantly loaded onto the AGO1 protein. The RNA-induced silencing complex exploits the sRNA in a sequence-homology dependent manner to recognize mRNA targets, which are cleaved and eventually degraded2.
Within a plant, sRNAs act locally, but can also move from one cell to another, presumably via the plasmodesmata, and are transported systemically over long distances via the vasculature3,4. Gene silencing triggered by sRNAs can eventually spread throughout an entire plant. How these sRNAs move within the plant is still unclear. miR399, which is produced in response to phosphate starvation, is present in the phloem sap of several plants and has been demonstrated to be a phloem-mobile microRNA5. In phosphate-starved plants, expression of miR399 is increased, leading to miR399 translocation to the root system where it affects expression of its target, namely the E2 conjugase PHO2 which modulates degradation of the phosphate transporter PHO1 (ref. 6). Therefore, miR399 translocation to the root system in phosphate-starved plants leads to activation of PHO1 and increased phosphate uptake.
Another well-studied miRNA proposed to be phloem-mobile is miR156 (ref. 7). miR156 regulates several developmental traits by repressing SQUAMOSA-PROMOTER BINDING PROTEIN-LIKE (SPL) transcription factors. Among the processes regulated by the miR156/SPL module it is worth citing juvenile-to-adult transition in Arabidopsis. Overexpressors of miR156 flower extremely late as a consequence of an extended juvenile phase8.
Interestingly, sRNAs are not only mobile signalling and regulatory molecules within the plant, but also move between plants and interacting organisms, including pathogens, to induce gene silencing. This phenomenon is known as cross-kingdom/organism RNA interference (RNAi)9. In response to infection with Verticillium dahliae, cotton plants display increased production of miR166 and miR159, and export both to the fungal hyphae to silence two Verticillium genes that are essential for fungal virulence10. Botrytis cinerea delivers its sRNAs into plant cells to silence host immunity genes11, and host Arabidopsis cells secrete exosome-like extracellular vesicles to deliver plant sRNAs into B. cinerea12. Exogenous RNAs may either be taken up by the fungal cells with which they come into contact with on the leaf surface or be taken up by plant cells first and then transported into fungal cells13. Interestingly, locally sprayed double-stranded RNAs (dsRNAs) also inhibit pathogen virulence at distal, non-treated leaves13,14. This suggests that these artificially synthesized dsRNAs spread systemically within plants after external application on the leaf surface.
sRNAs are also exchanged between plants. Dodders (Cuscuta spp.), an obligate parasitic plant, uses haustoria to obtain water and nutrients from its host plant. Cuscuta campestris haustoria accumulate high levels of many 22-nucleotide miRNAs targeting Arabidopsis thaliana messenger RNAs during parasitism, resulting in mRNA cleavage, secondary siRNA production and decreased mRNA accumulation15. These results show that miRNAs from dodders act as trans-species modulators of host-gene expression, suggesting that they influence the virulence of parasitic plants.
If exogenous RNAs from the environment are taken up by some living organisms, they can induce RNAi. This phenomenon, called ‘environmental RNAi’, has been observed in nematodes and insects16, but not in plants. However, topical application of laboratory-synthesized dsRNAs targeting insect developmental genes impairs insect growth17,18. These results indicate that gene expression within insect pests is suppressed through the uptake of either dsRNAs or sRNAs; however, it is unclear whether the RNA taken up by insects was inside the treated plant or present on its surface.
Some miRNAs can act systemically in the plant, indicating that they behave as mobile signalling molecules4. However, it is not known whether they are present in the environment, whether they are taken up by plants or whether this ultimately leads to post-transcriptional silencing of miRNA target genes in the receiving plant.
Here, we demonstrate that exogenous miRNAs can induce post-transcriptional gene silencing (PTGS), and that transfer of miRNA between neighbouring plants can influence gene expression. We utilized two miRNA modules, namely miR156/SPL and miR399/PHO2, because both have been reported to be cell mobile, regulate well-characterized plant processes and induce the synthesis of secondary siRNAs, potentially amplifying initial miRNA-dependent cleavage of the target mRNA19.
Results
Exogenous miRNAs trigger silencing of target genes
We explored the possibility that miRNAs can silence their target genes when applied exogenously to Arabidopsis seedlings grown in vitro. RNA was extracted from wild-type and miRNA-overexpressing plants (miR399 and miR156) and added to the liquid medium in which wild-type Arabidopsis seedlings were grown. The extracted RNA contains predominantly the guide strand of the miRNA, whereas the passenger strand, although present, is less abundant (Extended Data Fig. 1). After 24 h of incubation, expression of the respective targets of miR399 and miR156, PHO2 and SPL9, was analysed (Fig. 1a). The data showed repression of PHO2 and SPL9 in seedlings treated with exogenous RNA. Interestingly, RNA extracts enriched in either miR399 or miR156 had a stronger repressive effect on their mRNA targets compared with RNA extracts from the wild-type (Fig. 1a). These results suggest that exogenous miRNAs trigger RNAi in the receiving plant. To ensure that the observed effect could be assigned unequivocally to an RNAi mechanism, we produced transgenic plants expressing the reporter gene Firefly luciferase (Fluc) bearing the miR399 target sequence from PHO2 under control of the PHO2 promoter (named pPHO2:Fluc). In these plants, the level of luciferase (LUC) is expected to respond to phosphate starvation, given that the stability and translation of LUC is determined by the miR399 target sequence. This was demonstrated experimentally by treating seedlings with decreasing P-availability which, as expected, reduced LUC activity accordingly (Fig. 1b). We then treated the pPHO2:Fluc seedlings with an RNA extract enriched in miR399 and found that LUC activity was repressed when exogenous RNA was fed to the seedlings (Fig. 1c). These results indicated that the repression of PHO2 mRNA observed in Fig. 1a can be assigned to miR399, which interacts with the miR399 target sequence. We explored the repressive effects of miR399-enriched RNA extracts on roots and shoots of Arabidopsis seedlings. The results highlighted a stronger and faster response in roots, although the effect was also visible in shoots 48 h after the start of treatment (Fig. 1d).
Extended Data Fig. 1. Ratio miR399/miR399* in RNA extracts from wild-type plants (Col-0) and plants over-expressing miR399.
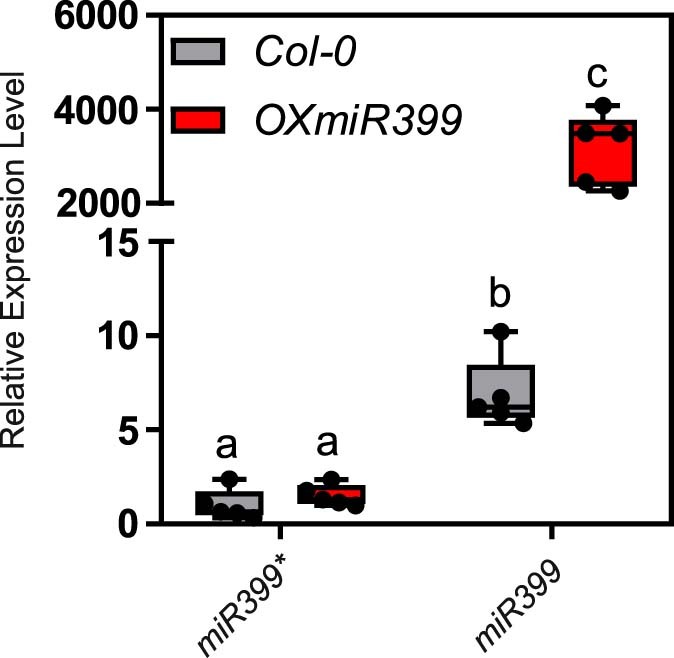
The level of miR399 and miR399* (passenger strand) was determined by stem-loop qPCR using specific primers. In the box-blots, the dots represent the single data points, whiskers denote the min/max values, the box defines the interquartile range, centre represents the median, box bounds represent the lower and upper quartiles (n = 5 biological replicates). Different letters (a,b,c) refer to differences in ANOVA tests (Tukey’s post‐hoc test, P < 0.05).
Fig. 1. Exogenous miRNAs influence the expression of their target genes in the receiving seedlings.
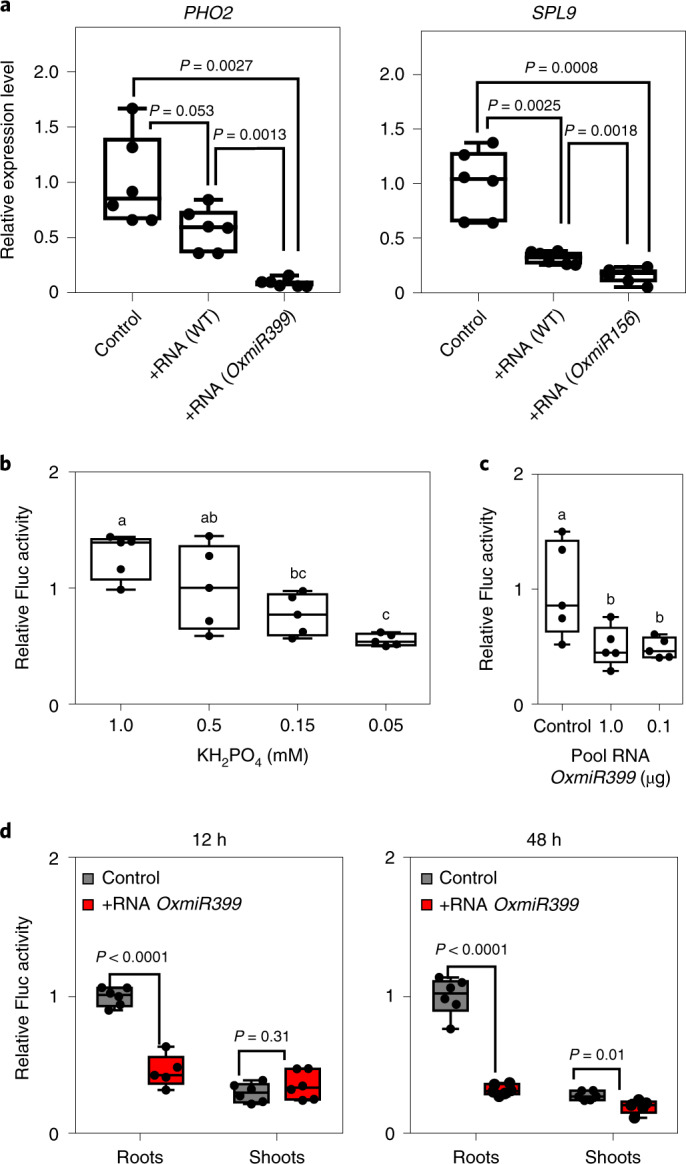
a, Effect of exogenous total RNA (1 μg, added to a total volume of 2 ml), extracted from wild-type (WT) plants or from plants overexpressing either miR399 or miR156, on the expression of PHO2 and SLP9 in Arabidopsis seedlings (8 days old). b, Response of pPHO2:Fluc seedlings (6 days old) to phosphate starvation. c, Response of pPHO2:Fluc seedlings (6 days old) to exogenous RNA from OxmiR399 plants (added to a total volume of 2 ml). d, Response to exogenous RNA (0.1 μg) from OxmiR399 plants (added to a total volume of 2 ml) in roots and shoots of pPHO2:Fluc seedlings (6 days old) grown in 2 ml of liquid medium. For all panels, the bottom and top of each box denote the first and third quartile, respectively. a, n = 6 biological replicates; b–d, n = 5 biological replicates. In the boxplots, dots represent single data points, whiskers denote the minimum/maximum values, the box defines the interquartile range, the centre represents the median, and box bounds represent the lower and upper quartiles. Welch’s t-test (two-sided) values are shown. Different letters (a,b,c) indicate differences in ANOVA tests (Tukey’s post‐hoc test, P < 0.05).
Exogenous miRNAs affect the phenotype of the receiving plant
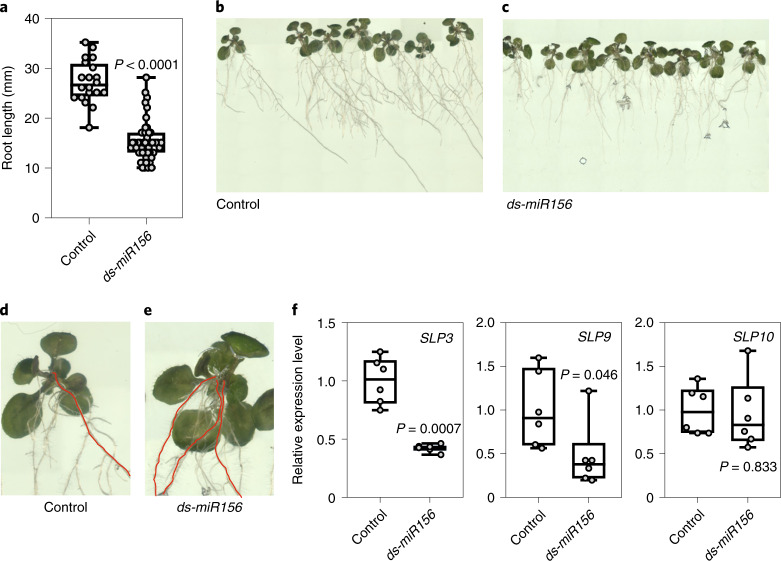
miR156 has an array of effects in plants, one of which is a clear influence on root architecture20,21. We tested whether germinating Arabidopsis seeds on a medium containing a chemically synthesized, pure miR156 (referred to as synthetic miR156) would result in a phenotype compatible with the role of this miRNA in root development. Development of the primary root was clearly inhibited by synthetic miR156 after 10 days of germination (Fig. 2a), in line with the reduced primary root growth observed in a transgenic line overexpressing miR156a21. Later, inhibition of the primary root elongation was retained, together with the development of adventitious roots (Fig. 2b,c,d,e). Remarkably, the miR156/SPL module has been shown to be responsible for the development of crown roots in rice22. The regulation of root architecture by the miR156/SPL module in Arabidopsis relies on the repression of three SPL genes involved in root development, namely SPL3, SPL9 and SPL10 (ref. 20). We analysed the expression levels of these three SPL genes in roots collected at the end of the experiment shown in Fig. 2b,c. SPL3 was strongly repressed by the presence of exogenous, synthetic ds-miR156, whereas repression of SPL9 was modest. SPL10 expression was unaffected by the treatment (Fig. 2f). Overall, the results indicate that exogenous ds-miR156 is able to modulate root architecture by adjusting the expression of SPL3.
Fig. 2. Exogenous ds-miR156 influences the root phenotype in Arabidopsis seedlings.
a, Primary root length in 10-day-old seedlings germinated on control medium (n = 20) or on a medium supplemented with 0.2 μM synthetic ds-miR156 (n = 48). b,c, Photographs of representative control (b) and ds-miR156-treated (c) vertical plates (15 days after sowing). d,e, Magnified seedlings from b (d) and c (e) showing (in red) the presence of adventitious roots. f, Transcript level of SPL3, SPL9 and SPL10 extracted from roots at the stage depicted in b and c. For all boxplots, the bottom and top of each box denote the first and third quartile, respectively (n = 6 biological replicates). In the boxplots, dots represent single data points, whiskers denote minimum/maximum values, the box defines the interquartile range, the centre represents the median and box bounds represent the lower and upper quartiles. Welch’s t-test (two-sided) values are shown.
Exogenous miRNAs are translocated by the xylematic route
We studied the efficacy of a chemically synthesized, pure miR399 (referred to as synthetic miR399) compared with a miR399-enriched RNA plant extract. The seedlings responded to the miR399-enriched RNA plant extract with repression being evident after 48–72 h (Fig. 3a). We used this time frame to compare the plant-derived extract (enriched in miR399) with two synthetic miRNAs, namely ds-miR399 and ds-miR319; the latter was used as a negative control. First, we checked that synthetic ds-miR399 triggers Fluc-repression in pPHO2:Fluc seedlings. In this experiment, we observed repression of Fluc by both the plant-derived RNA extract and synthetic ds-miR399, which was evident after 48 h. Synthetic ds-miR319 did not trigger repression of Fluc activity (Fig. 3b). These results indicated that a synthetic version of ds-miR399, with a sequence identical to the mature miR399 present in plants, is sufficient to trigger repression of Fluc acting on the PHO2-derived miR399 target sequence.
Fig. 3. Translocation and response to exogenous miRNAs.
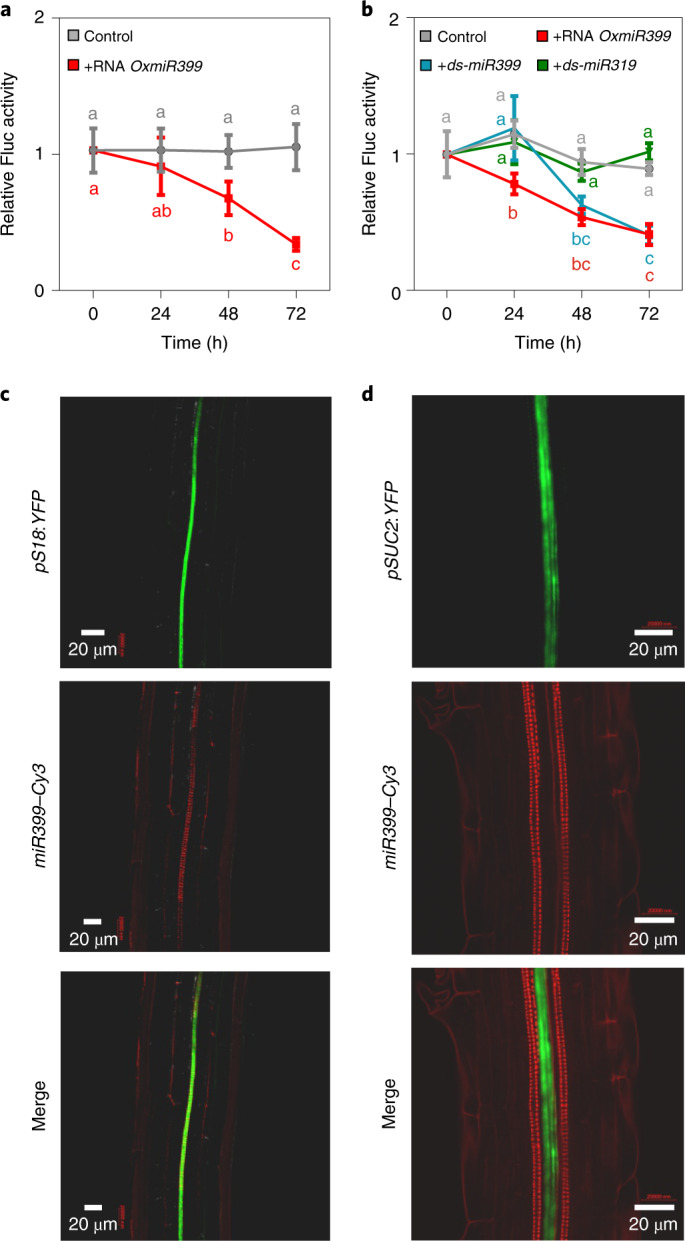
a, Time-course of the response of pPHO2:Fluc seedlings (6 days old) to exogenous RNA (0.1 μg) from OxmiR399 plants (added to a total volume of 2 ml). Data are mean ± s.d. (n = 5 biological replicates). b, Time-course of the response of pPHO2:Fluc seedlings (6 days old) to exogenous RNA (0.1 μg) from 35S:miR399 plants (added to a total volume of 2 ml) and to chemically synthesized ds-miR399 and ds-miR319 (0.2 nM). Data are mean ± s.d. (n = 5 biological replicates). c, Translocation of Cy3-labelled miR399 (miR399–Cy3) in Arabidopsis pS18:YFP (showing YFP-labelled xylem) seedlings (6 days old). Seedlings were incubated with miR399–Cy3 for 2 h and subsequently observed using a confocal microscope. d, Translocation of Cy3-labelled miR399 (miR399–Cy3) in Arabidopsis pSUC2:YFP (with YFP expressed in the phloem) seedlings (6 days old). Seedlings were incubated with miR399–Cy3 for 2 h and subsequently observed using a confocal microscope. Welch’s t-test (two-sided) values are shown in a and b. Different letters (a,b,c) indicate differences in ANOVA tests (Tukey’s post‐hoc test, P < 0.05). The experiments reported in c and d were repeated three times with consistent results.
Second, we checked the actual uptake of miRNAs in treated seedlings using synthetic ds-miR399 labelled with Cy3 as a fluorescent probe. To distinguish between the phloematic and xylematic routes of possible in planta translocation of exogenous miRNAs, we used pSUC2:YFP and pS18:YFP plants in which yellow fluorescent protein (YFP) labels the phloem and xylem, respectively23. Analysis of confocal microscopy images of seedlings treated with exogenous miR399–Cy3 revealed a clear overlap of Cy3 fluorescence with YFP in pS18:YFP plants (Fig. 3c) but not pSUC2:YFP (Fig. 3d), indicating that exogenous miR399 is preferentially translocated via the xylematic route.
Exogenous miR399 targets the PHO2 RNA sequence
We used protoplasts to investigate the mode of action of exogenous miRNAs. We isolated protoplasts from wild-type Arabidopsis plants and transiently transformed them with the construct pUBQ10:PHO2-UTR–Fluc, expressing a reporter mRNA containing the Fluc open reading frame fused to the 5′-untranslated region (UTR) of PHO2 bringing the miR399-target sites, plus a pUBQ10:Rluc vector as an internal control. Protoplasts were then incubated with an RNA extract from wild-type plants or plants enriched in miR399. The results, shown in Extended Data Fig. 2, highlight that miR399-enriched RNA reduced Fluc activity in pUBQ10:PHO2-UTR–Fluc with an effect that is stronger than that of RNA extract from a wild-type donor plant. It is not surprising that RNA from the wild-type plant could repress Fluc activity given that miR399 is quite well expressed in wild-type plants.
Extended Data Fig. 2. Dose response in protoplasts transformed with the pUBQ10:PHO2-UTR-Fluc.
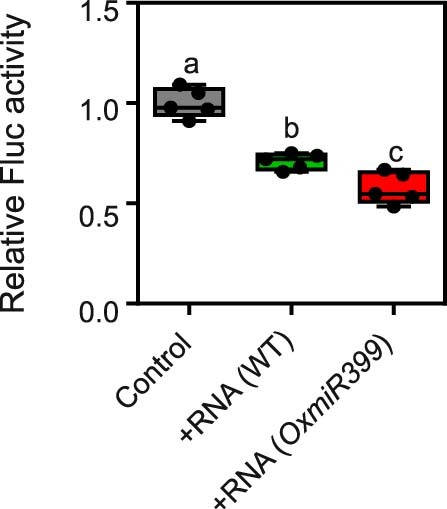
Protoplasts transformed with the pUBQ10:PHO2-UTR-Fluc were incubated with an RNA extract (0.1 μg) from wild-type plants or enriched in miR399. In the box-blots, the dots represent the single data points, whiskers denote the min/max values, the box defines the interquartile range, centre represents the median, box bounds represent the lower and upper quartiles (n = 5 biological replicates). Different letters (a,b,c) refer to differences in ANOVA tests (Tukey’s post‐hoc test, P < 0.05).
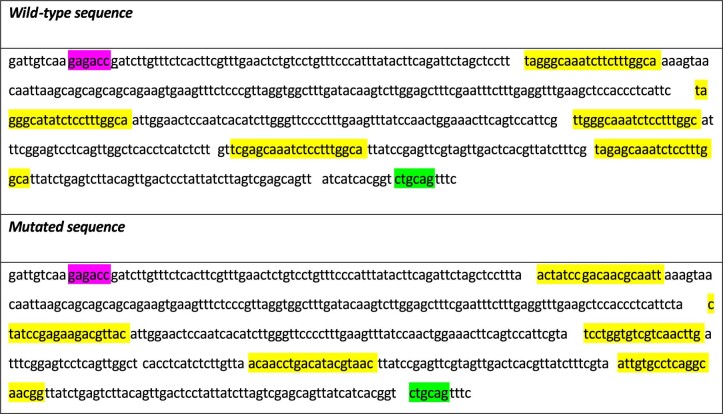
Although polyethylene glycol (PEG) treatment to permeate the protoplast enhanced the efficacy of the RNA treatment (Fig. 4a), repression of Fluc was still observed with a normal feeding procedure (Fig. 4b). The protoplast system enabled us to transiently transform protoplasts with different versions of the PHO2 target RNA sequence. We produced a version of the LUC reporter with the target RNA sequence showing a scrambled sequence that replaced the sequence recognized by miR399 (Extended Data Fig. 3) and compared the wild-type target sequence with the mutated one. When transformed into protoplasts obtained from plants of the 35S:miR399 overexpressor, the pUBQ10:PHO2-UTR–Fluc construct bearing the wild-type miR399 target RNA sequence drove repression of LUC, whereas the mutated version did not (Fig. 4c). Similarly, when wild-type protoplasts were transformed with the two LUC reporter sequences and fed exogenous miR399-enriched RNA, repression of LUC was observed only when the LUC sequence was associated with the wild-type PHO2 target sequence (Fig. 4d).
Fig. 4. Responses to exogenous RNA in protoplasts from pUBQ10:PHO2-UTR–Fluc leaves.
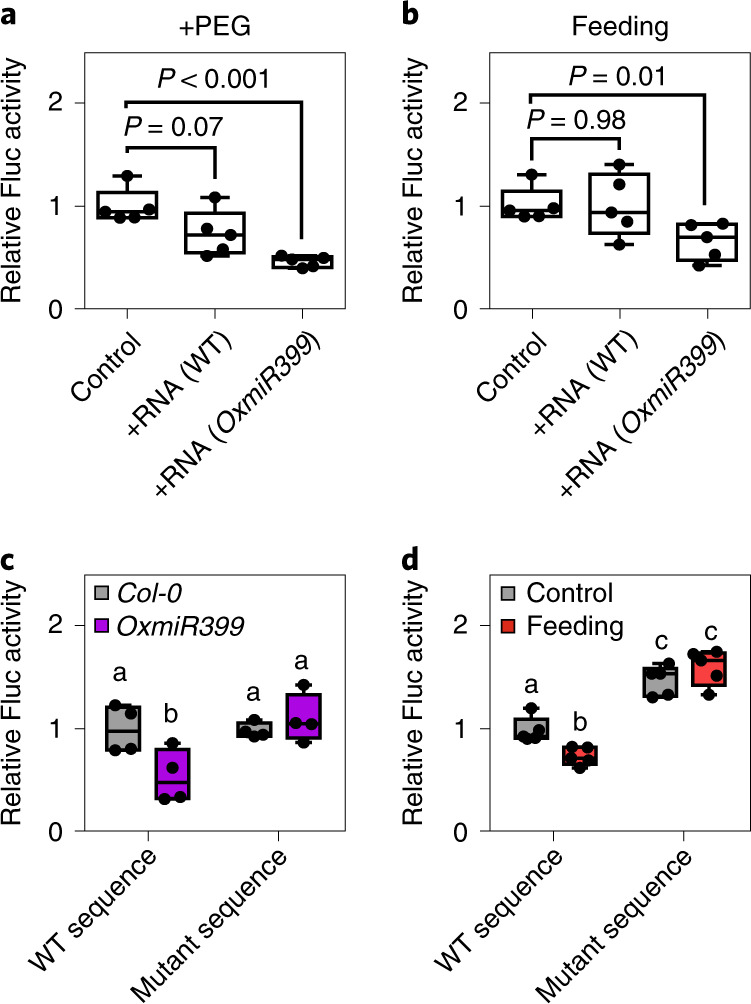
a, Effect of exogenous RNA (0.1 μg) from WT and OxmiR399 plants (added to a total volume of 2 ml) in pUBQ10:PHO2-UTR–Fluc protoplasts treated with PEG 4000 to facilitate entry of the miRNAs (n = 5 biological replicates). b, Feeding of exogenous RNA (0.1 μg) from WT and OxmiR399 plants to pUBQ10:PHO2-UTR–Fluc protoplasts (added to a total volume of 2 ml) (n = 5 biological replicates). c, Transformation of protoplasts from OxmiR399 and Col-0 plants with pUBQ10:PHO2-UTR–Fluc or pUBQ10:random-UTR–Fluc (n = 4 biological replicates). d, Feeding of exogenous RNA (0.1 μg, added to a total volume of 2 ml) from OxmiR399 plants to WT protoplasts transformed with pUBQ10:PHO2-UTR–Fluc or pUBQ10:random-UTR–Fluc (n = 5 biological replicates). In the boxplots, dots represent single data points, whiskers denote minimum/maxmum values, the box defines the interquartile range, the centre represents the median and box bounds represent the lower and upper quartiles. Welch’s t-test (two-sided) values are shown. Different letters (a,b,c) indicate differences in ANOVA tests (Tukey’s post‐hoc test, P < 0.05).
Extended Data Fig. 3. Wild-type and mutated sequences of 5’UTR of PHO2 (726 to 219).
Restriction sites of PstI and BsaI are highlighted in purple and green, respectively. Wild-type miR399-target sequences and the corresponding mutated versions are highlighted in yellow. The reported sequence is located between nucleotide 726 and nucleotide 219 upstream of the PHO2 Met start codon.
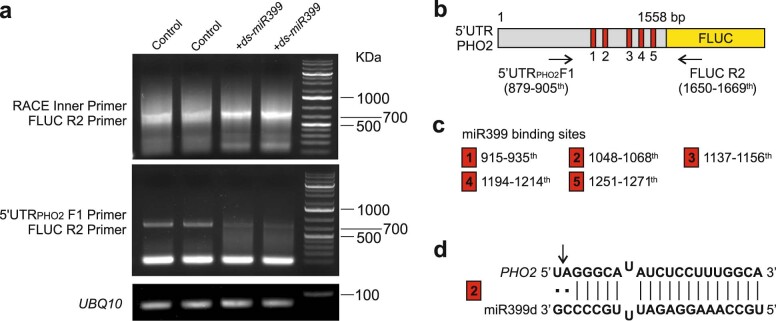
We performed semiquantitative 5′-rapid amplification of complementary DNA ends (5′-RACE) PCR with reverse transcription (RT–PCR) to detect 3′-cleavage products from PHO2 in seedlings treated with exogenous RNA. If no miR399-mediated cleavage occurs, PCR products using paired primers flanking the miR399-binding sites should be obtained. Otherwise, specific 3′-cleavage products should be obtained using the Generacer-specific primer and the primer from the Fluc sequences downstream of the miR399-binding sites. The results showed a higher intensity band corresponding to the cleaved PHO2 product in seedlings treated with exogenous RNA, whereas the intact PHO2 mRNA sequence was clearly more abundant in the untreated, control plants (Extended Data Fig. 4a). Furthermore, sequencing of the 3′-cleavage products from PHO2 revealed that cleavage of the PHO2 transcript by treatment with exogenous RNA occurred at precisely the second miR399-binding site (Extended Data Fig. 4b–d). This is in line with the findings of Allen et al.24, who identified miR399-binding sites 2 and 3 as the predominant sites of miR399-guided cleavage. These results indicate that the mechanism by which exogenous RNA triggers repression of specific mRNA targets of miRNAs occurs via canonical cleavage of the target sequence.
Extended Data Fig. 4. Detection of miR399-guided cleavage products of PHO2 by 5’RACE-PCR in pPHO2:Fluc seedlings incubated with ds-miR399.
a. Semi-quantitative 5′RACE-PCR to detect 3′ cleavage fragments generated through miR399-guided cleavage of PHO2 transcript. Starting from the left: no treated samples (control), samples incubated with ds-miR399 (0.2 nM), the DNA ladder with standard sizes labeled (KDa). UBQ10 was used as a loading control. b. Schematic representation of 5’UTR PHO2 sequence, the location of miR399-binding sites and positions of primers used in panel a. Arrows indicate primers orientation. c. Targeting sites of miR399. Numbers in red rectangles correspond to locations indicated in panel b. d. Alignment of miRNA399 and its second targeting site on PHO2. Dots and vertical lines correspond to uncomplimentary and complementary nucleotides, respectively. The arrow shows the cleavage site of miRNA399 in the PHO2 sequence, which was detected after sequencing of 5’RACE-PCR products. The experiment was repeated two times with consistent results.
Exogenous miRNA-triggered RNAi requires AGO1 and RDR6
In plants, RNAi mediated by miRNAs requires the AGO1 protein. We prepared protoplasts from wild-type (Col-0), ago1-27, rdr6-15 and rdr2-1 plants and transformed them with the pUBQ10:PHO2-UTR–Fluc. The activity of Fluc was higher in ago1-27 plants, as expected from the lack of repression of the PHO2 target sequence by the endogenous miR399 (Extended Data Fig. 5). When wild-type protoplasts were compared with protoplasts obtained from leaves of the ago1-27 mutant, repression of LUC after feeding with exogenous RNA was observed only in the wild-type, indicating that a functional AGO1 protein is required to trigger RNAi, thereby affecting the LUC transcript (Fig. 5a). miR399 is one of the miRNAs that induces transitivity via a mechanism requiring RDR6 (refs. 19,25). When protoplasts were prepared from rdr6-15 leaves, repression by exogenous RNA was abolished (Fig. 5a). When a RDR2 mutant was used (rdr2-1), repression of LUC occurred as in the wild-type (Fig. 5a). This was expected, given that RDR2 is an RNA-dependent direct polymerase involved in the biogenesis of endogenous 24-nucleotide siRNAs, and is thus involved in transcriptional gene silencing, but not in PTGS. The requirement for functional AGO1 and RDR6 proteins to trigger the silencing of genes bearing a miRNA target sequence was confirmed when the experiment was repeated using synthetic ds-miR399 (Fig. 5b) and synthetic ds-miR156 (Extended Data Fig. 6).
Extended Data Fig. 5. Fluc activity in protoplasts from wild-type (Col-0), ago1-27, rdr6-15, and rdr2-1 plants and transformed with the pUBQ10:PHO2-UTR-Fluc.
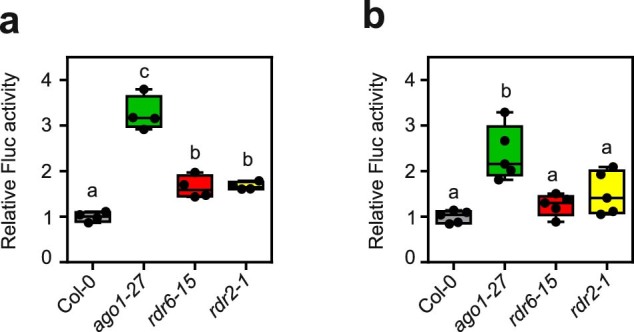
The activity of Fluc was higher in the ago1-27, as expected from the lack of repression of the PHO2 target sequence by the endogenous miR399. Panel a refers to the experiment reported in Fig. 5a, while panel b refers to the experiment reported in Fig. 5b. Both experiments were conducted without the addition of exogenous RNA. In the box-blots, the dots represent the single data points, whiskers denote the min/max values, the box defines the interquartile range, centre represents the median, box bounds represent the lower and upper quartiles. Different letters (a,b,c) refer to differences in ANOVA tests (Tukey’s post‐hoc test, P < 0.05). t (a: n = 4 biological replicates; b: n = 5 biological replicates).
Fig. 5. The exogenous miR399 signalling pathway requires both AGO1 and RDR6.
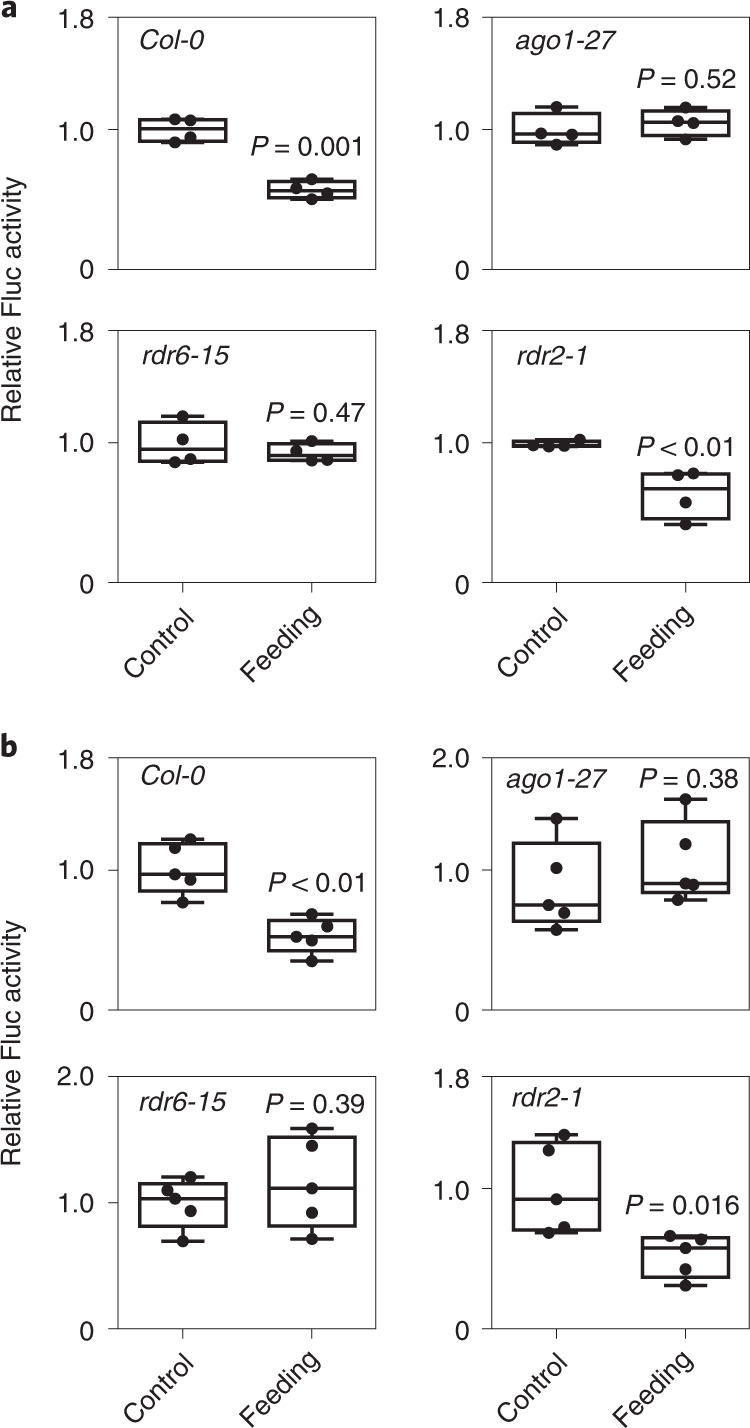
a, Feeding of exogenous RNA (0.1 μg, added to a total volume of 2 ml) from OxmiR399 plants to protoplasts from WT (Col-0), ago1-27, rdr6-15 and rdr2-1 plants transformed with pUBQ10:PHO2-UTR–Fluc (n = 4 biological replicates). b, Feeding of exogenous synthetic miR399 (0.2 nM) to protoplasts from WT (Col-0), ago1-27, rdr6-15 and rdr2-1 plants transformed with pUBQ10:PHO2-UTR–Fluc (n = 5 biological replicates). In the boxplots, dots represent single data points, whiskers denote minimum/maximum values, the box defines the interquartile range, the centre represents the median and box bounds represent the lower and upper quartiles. Welch’s t-test (two-sided) values are shown.
Extended Data Fig. 6. The exogenous miR156 signalling pathway requires both AGO1 and RDR6.
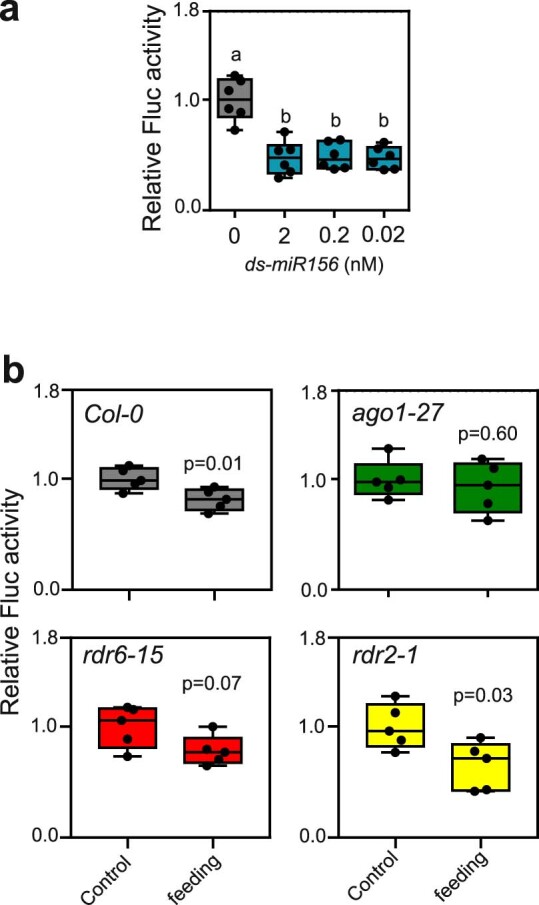
a. Feeding of exogenous synthetic miR156 to wild-type protoplasts transiently transformed with 35S:SPL9-Fluc, together with a 35S:Rluc plasmid for normalization. b. Feeding of exogenous synthetic miR156 (0.2 nM) to protoplasts from wild-type (Col-0), ago1-27, rdr6-15, and rdr2-1 plants transformed with the 35S:SPL9-Fluc, plus a 35S:Rluc vector as internal control. In the box-blots, the dots represent the single data points, whiskers denote the min/max values, the box defines the interquartile range, centre represents the median, box bounds represent the lower and upper quartiles. Different letters (a,b) refer to differences in ANOVA tests (Tukey’s post‐hoc test, P < 0.05). Welch’s t test (two sided) values are shown (a: n = 6 biological replicates; b: n = 5 biological replicates).
We then investigated whether the requirement for AGO1 and RDR6 to trigger RNAi after feeding exogenous RNA could be confirmed in planta. We crossed the pPHO2:Fluc reporter line with ago1-27 and rdr6-15 and used them to check whether exogenous RNA would repress expression of LUC in the resulting crosses. When seedlings of the pPHO2:Fluc reporter line were fed with a pool of RNA extracted from 35S:miR399 plants, repression of LUC activity was observed within 24–48 h after treatment (Fig. 6a,c). By contrast, pPHO2:Fluc crossed with ago1-27 was insensitive to exogenous RNA (Fig. 6b), which was even more evident with pPHO2:Fluc crossed with rdr6-15 (Fig. 6d).
Fig. 6. Exogenous RNA efficacy in seedlings of pPHO2:Fluc, rdr6-15×pPHO2:Fluc and ago1-27×pPHO2:Fluc.
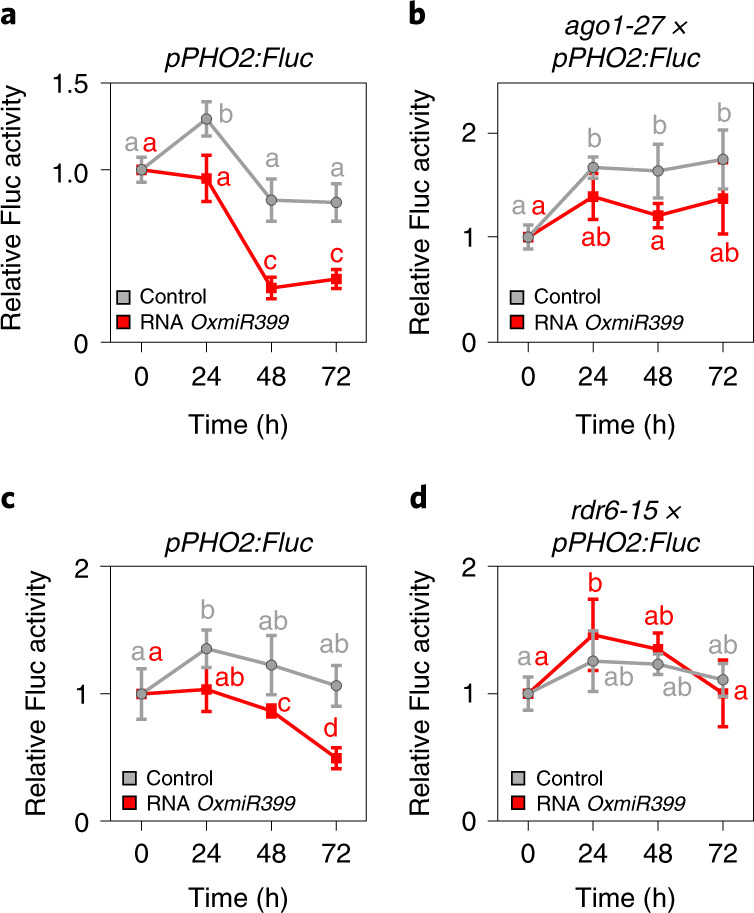
a, Seedlings of pPHO2:Fluc were fed with exogenous RNA extracted from OxmiR399 plants (0.1 μg, added to a total volume of 2 ml). Data are mean ± s.d. (n = 6 biological replicates). b, Seedlings of ago1-27×pPHO2:Fluc were fed with exogenous RNA extracted from OxmiR399 plants (0.1 μg, added to a total volume of 2 ml). Data are mean ± s.d. (n = 6 biological replicates). c, As in a, independent experiment as a control for d. Data are mean ± s.d. (n = 5 biological replicates). d, Seedlings of rdr6-15×pPHO2:Fluc were fed with exogenous RNA extracted from OxmiR399 plants (0.1 μg, added to a total volume of 2 ml). Data are mean ± s.d. (n = 5 biological replicates). Different letters (a,b,c,d) indicate differences in ANOVA tests (Tukey’s post‐hoc test, P < 0.05).
We explored the dicer activity requirement for the observed effects of exogenous RNA. DICER1 (DCL1) and HYPONASTIC LEAVES 1 (HYL1) are required to ensure accurate cleavage of mature miRNA from the pre-miRNA stem–loop26. Protoplasts from wild-type (Ler) and dcl1-9 plants transformed with pUBQ10:PHO2-UTR–Fluc display different levels of Fluc expression, with the PHO2 target sequence being less repressed when the endogenous miR399 is not produced properly due to defective DCL1 and HYL1 activity (Extended Data Fig. 7). Feeding protoplasts with synthetic ds-miR399 reduced Fluc activity, indicating repression of the PHO2 target sequence (Extended Data Fig. 7). This demonstrates that exogenous miR399 can complement the defective endogenous processing of miR399 caused by the absence of DCL1/HYL1.
Extended Data Fig. 7. The exogenous miR399 signalling pathway does not require DCL1 and HYL1.
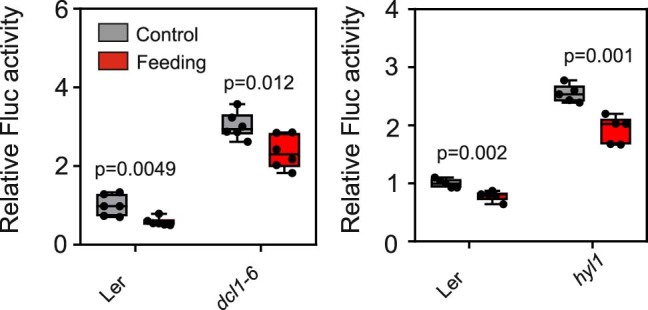
Feeding of exogenous synthetic miR399 to wild-type protoplasts transiently transformed with the pUBQ10:PHO2-UTR-Fluc together with a 35S:Rluc plasmid for normalization. The activity of Fluc was higher in the dcl1-9 and in hyl1, as expected from the lack of repression of the PHO2 target sequence by the endogenous miR399, which cannot be correctly processed in the absence of DCL1 and HYL1. Feeding the synthetic miR399 reduces the Fluc activity indicating successful repression of the PHO2 miR399-target sequence. In the box-blots, the dots represent the single data points, whiskers denote the min/max values, the box defines the interquartile range, centre represents the median, box bounds represent the lower and upper quartiles (n = 6 biological replicates). Welch’s t test (two sided) values are shown.
Secreted miRNAs influence gene expression in nearby plants
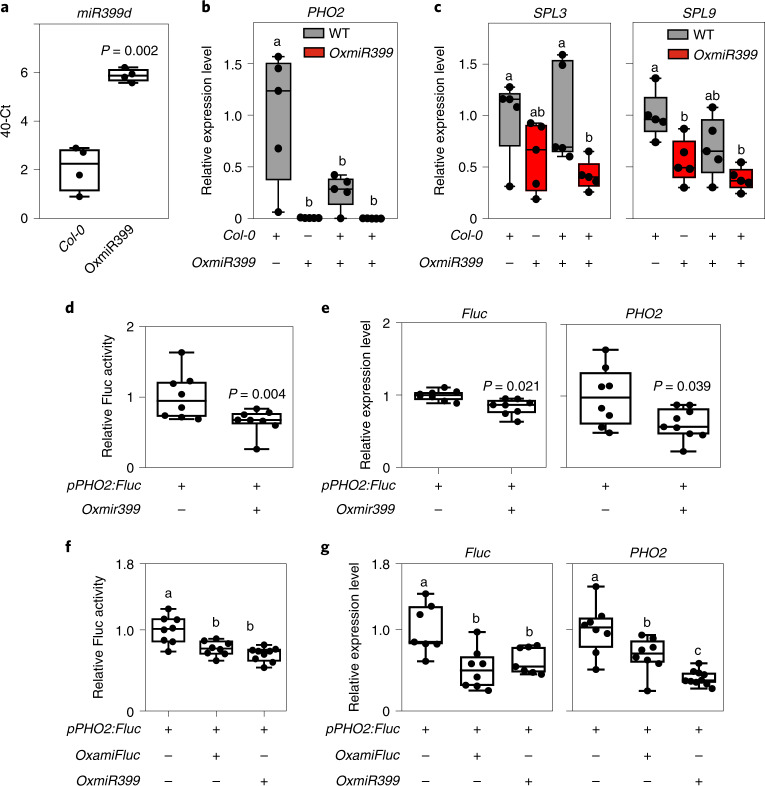
Experimental evidence showing that exogenous miRNAs can influence gene expression in a receiving plant suggests the existence of exogenous miRNA in the environment. We grew wild-type and 35S:miR399 plants (OxmiR399) using a hydroponic system to check for the presence of miRNAs in the hydroponic solution. The results showed that miR399d is detectable at a higher level in the hydroponic solution in which OxmiR399 plants were grown, and that wild-type plants secreted miR399 (Fig. 7a).
Fig. 7. Plants overexpressing miR399 influence the expression of PHO2 in WT plants sharing the same hydroponic medium.
a, Presence and quantity of miR399 in the external medium of WT and OxmiR399 plants (n = 4 biological replicates). The miRNA amount is expressed using the value resulting after subtracting the actual cycle threshold (Ct) value in PCR from the arbitrary value of 40 (40-Ct). b, Expression of PHO2 in WT plants, OxmiR399 plants, WT plants cocultivated with OxmiR399 plants in the same hydroponic tray and OxmiR399 plants cocultivated with WT plants in the same hydroponic tray (n = 5 biological replicates). c, Expression of SPL3 and SPL9 in WT plants, OxmiR399 plants, WT plants cocultivated with OxmiR399 plants in the same hydroponic tray and OxmiR399 plants cocultivated with WT plants in the same hydroponic tray (n = 5 biological replicates). d, Luciferase activity in pPHO2:Fluc plants cocultivated with OxmiR399 plants in the same hydroponic tray (n = 8 biological replicates). e, Fluc and PHO2 mRNA levels in pPHO2:Fluc plants cocultivated with OxmiR399 plants in the same hydroponic tray (n = 8 biological replicates). f, Luciferase activity in pPHO2:Fluc plants cocultivated with 35S:ami-Fluc and OxmiR399 plants in the same hydroponic tray (n = 8 biological replicates). g, Fluc and PHO2 mRNA levels in pPHO2:Fluc plants cocultivated with 35S:ami-Fluc and OxmiR399 plants in the same hydroponic tray (n = 8 biological replicates). In the boxplots, dots represent single data points, whiskers denote minimum/maximum values, the box defines the interquartile range, the centre represents the median and box bounds represent the lower and upper quartiles. Welch’s t-test (two-sided) values are shown. Different letters (a,b,c) indicate differences in ANOVA tests (Tukey’s post‐hoc test, P < 0.05).
To test whether the higher level of miR399 secreted by OxmiR399 plants could influence the expression of PHO2 in wild-type plants grown nearby, we cocultivated 35S:miR399 and wild-type plants using the same hydroponic solution. Expression of PHO2 was considerably lower in OxmiR399 plants, but interestingly, also in wild-type plants cocultivated with OxmiR399 plants (Fig. 7b). As a control, we analysed the expression of SPL genes, which are targets of miR156. Both SPL3 and SPL9 were expressed at a slightly lower level in OxmiR399 plants compared with wild-type, but no influence of OxmiR399 plants on the expression of SPL genes in wild-type plants was observed when both genotypes were grown in the same hydroponic tray (Fig. 7c).
We then cocultivated pPHO2:Fluc plants with OxmiR399 plants. The results showed decreased LUC activity in pPHO2:Fluc plants that were cocultivated with OxmiR399 plants (Fig. 7d). These results were corroborated by qPCR measurement of the mRNAs of Fluc and PHO2, both showing decreased expression levels in pPHO2:Fluc when cocultivated with OxmiR399 plants (Fig. 7e). The experiment was repeated including a tray in which the pPHO2:Fluc plants were also cocultivated with plants that produced an artificial miRNA targeting the Fluc mRNA instead of the miR399 target sequence in the PHO2-UTR. The results showed that cocultivation with either the 35S:ami-Fluc (OxamiFluc, producing an artificial miRNA targeting the LUC sequence) or OxmiR399 plants resulted in a substantial significant reduction in Fluc activity (Fig. 7f) as well as repression of Fluc and PHO2 transcripts (Fig. 7g). Repression of the Fluc transcript was expected because both miR399 and ami-Fluc target the PHO2-UTR–Fluc sequence in pPHO2:Fluc plants. Repression of PHO2 after cocultivation with OxmiR399 plants was similarly expected, whereas the slight repression of PHO2 after cocultivation with 35S:ami-Fluc plants suggests that secondary siRNAs are produced following cleavage of the PHO2-UTR–Fluc transcript by ami-Fluc. This indicated that the siRNA was able to recognize the miR399 target sequence in the native PHO2 transcript.
miR156a was detected in the hydroponic medium in which plants overexpressing this miRNA were grown (Fig. 8a). A cocultivation experiment was performed, using wild-type and 35S:miR156 plants grown alone or mixed in the same hydroponic tray. The expression level of miR156 itself was not influenced by cocultivation in either wild-type or 35S:miR156 plants (Fig. 8b). The expression of SPL3 and SPL9, which are both targets of miR156, was considerably lower in wild-type plants that were grown together with 35S:miR156 plants (Fig. 8c). Interestingly, flowering of wild-type plants was strongly delayed when cocultivated with 35S:miR156 plants (Fig. 8d), which themselves flower extremely late due to a prolonged juvenile phase. These results indicate that miRNAs are secreted in the medium and that nearby plants are able to take up exogenous miRNAs. Expression of its target gene is therefore inhibited.
Fig. 8. Plants overexpressing miR156 influence the expression of SPL genes in WT plants sharing the same hydroponic medium.
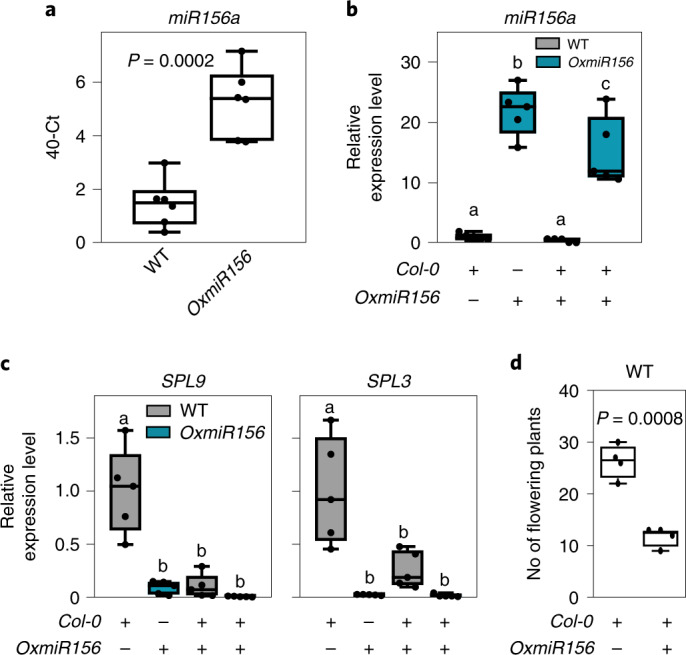
a, Presence and quantity of miR156 in the external medium of WT and OxmiR156 plants. b, miR156 expression level in WT plants, OxmiR156 plants, WT plants cocultivated with OxmiR156 plants in the same hydroponic tray and OxmiR156 plants cocultivated with WT plants in the same hydroponic tray. c, SPL9 and SPL3 expression level in WT plants, OxmiR156 plants, WT plants cocultivated with OxmiR156 plants in the same hydroponic tray and OxmiR156 plants cocultivated with WT plants in the same hydroponic tray. d, Flowering of WT plants is delayed when cocultivated with OxmiR156 plants. In the boxplots, dots represent single data points, whiskers denote minimum/maximum values, the box defines the interquartile range, the centre represents the median and box bounds represent the lower and upper quartiles. Welch’s t-test (two-sided) values are shown. Different letters (a,b,c) refer to differences in ANOVA tests (Tukey’s post‐hoc test, P < 0.05). a, n = 6 biological replicates; b,c, n = 5 biological replicates; d, n = 4 biological replicates, each represented by the mean value from a tray with 30 individual plants.
Discussion
Plants can communicate with not only internal signalling mechanisms that include hormones, metabolic signals and sRNAs, but also other nearby organisms by emitting volatile organic compounds, volatile hormones such as ethylene and jasmonates. Plants also share a common mycorrhizal network with these organisms. To date, the possibility that sRNAs such as miRNAs represent not only mobile signalling molecules in the plant, but also signals among distinct plants has not been investigated. Studies have shown that exogenous RNAs can affect the plant response to pathogens (insects, viruses, fungi)27–30. In these experiments, dsRNAs of different lengths, designed and synthesized to target specific genes, were shown to be effective via an RNAi mechanism. The outcomes of infection by fungi and viruses as well as insect attacks can be reduced by exogenous RNA treatments as simple as leaf RNA sprays, highlighting enormous potential in agriculture31. Communication between plants and fungi has also been described, in which sRNAs synthesized by plants and pathogenic fungi are exchanged bidirectionally30.
Our results show that miRNAs are signalling molecules that enable communication between plants. This is supported by the following evidence. First, miRNAs are found in the external growth medium of Arabidopsis plants (Figs. 7 and 8). Second, in plants with lower expression levels of a specific miRNA, expression of the miRNA’s target gene(s) is affected by nearby plants overexpressing that specific miRNA (Figs. 7 and 8). We have shown that exogenous RNA extracts enriched in a specific miRNA can influence the expression of target gene(s) in a receiving plant or protoplast (Figs. 1, 3 and 4). Third, we have demonstrated that both miRNA-enriched RNA extracts and individual chemically synthesized miRNAs influence their targets when fed exogenously (Figs. 4–6).
Exactly how plants take up exogenous miRNAs is still unknown. The nematode Caenorhabditis elegans takes up external dsRNAs16, a mechanism requiring the SYSTEMIC RNA INTERFERENCE DEFECTIVE PROTEIN 2 (SID-2) transmembrane protein32. Uptake of exogenous dsRNAs in C. elegans is followed by activation of an RNAi response, specifically affecting gene expression. In mammals, exosomes contain a wide range of RNAs including miRNAs33, and are likely involved in the cell-to-cell transport of miRNAs, a mechanism that is operative in plants and in cross-kingdom RNAi12.
Arabidopsis cells secrete exosome-like extracellular vesicles to deliver sRNAs to the fungal pathogen, B. cinerea12. These sRNA-containing vesicles are taken up by the fungal cells and induce silencing of fungal genes which is critical for pathogenicity12. We ruled out the possibility that exogenous RNA fed to Arabidopsis plants, seedlings or protoplast enters as part of exosomes. This is because exosomes are likely to be destroyed by RNA extraction procedures, and naked, mature synthetic miRNA duplexes were able to influence expression of the target gene. It thus appears that uptake of naked miRNA molecules is possible in plants cells. Whether this is facilitated by a carrier protein, as in C. elegans, is still not clear.
Once inside the plant, exogenous miRNAs can generate a non-cell autonomous silencing signal34. In fact, miRNAs represent mobile signalling molecules by travelling systemically in plants35. The movement of miRNAs in plants is either short range, mostly through plasmodesmata, or long range, predominantly via the phloematic route4,36. In our experiments, exogenously fed Cy3-labelled miR399 was found in the xylem (Fig. 3c,d). The xylematic route thus appears to be typical of exogenously fed RNAs, because exogenous RNA taken up through the petiole in Nicotiana was found to be strictly restricted to the xylem37. Endogenously produced miRNAs appear to follow a different route, given that an analysis of xylem and phloem exudate in Brassica napus revealed the presence of sRNAs in phloem sap, but not in the xylem38.
Systemic exogenous miRNA signalling is supported by evidence of repression of the miR156 and miR399 target genes in the leaves of plants that were cocultivated in the same hydroponic medium, thus indicating uptake from the root system and translocation, presumably via the xylem, to the aerial parts of the plant (Figs. 7 and 8). When exogenous RNAs were fed to intact young seedlings grown in a liquid medium, there was a much stronger response in the roots than the shoots (Fig. 1d). This suggests that the root system facilitates easier entry of miRNAs into the plant compared with the shoots. Interestingly, a miR156-dependent root phenotype20,21 is observed in plants fed with synthetic miR156 (Fig. 2), indicating that modulation of SPL genes by exogenous miR156 is strong enough to affect the phenotype of the receiving plant. Although SPL10 was not repressed by the exogenous miR156 treatment, both SPL9 and, strongly, SPL3 were repressed in the roots at the end of the experiment (Fig. 2f). Although SPL10, SPL9 and SPL3 were all assigned a function in defining the root architecture, single mutants for these SPL genes show enhanced secondary root production, indicating that they act non-redundantly20. The sole repression of SPL3 by the exogenous miR156 treatment is therefore sufficient to account for the observed phenotype. miRNA-targeted SPL genes are differentially expressed in Arabidopsis roots and this may account for the differential regulation by exogenous miR156 (ref. 20).
The spread of silencing due to the translocation of exogenous miRNAs is amplified by the production of secondary siRNAs that rely on the activity of RDR6. In fact, silencing was found to be largely abolished in the rdr6-15 mutant. AGO1 is required as well, indicating that exogenous miRNAs enter the canonical pathways of PTGS, with RDR6-dependent transitivity (Fig. 5).
Overall, our results showed that exogenous miRNAs exist outside the plant and have the potential to influence nearby plants by inducing PTGS in the receiving plant. Although this mechanism is probably distinct from the cross-kingdom exchange of sRNAs described between plants and pathogenic fungi, it highlights the existence of a common mechanism in which miRNAs represent signalling molecules that enable communication between plants. This may allow plants communities to respond to environmental conditions in a synchronized manner.
Methods
Plant material
Arabidopsis thaliana Columbia (Col-0) was used as the wild-type ecotype for all experiments unless differently stated. The Arabidopsis genotypes included the hypomorphic ARGONAUTE1 mutant ago1-27 (ref. 39), the rdr6-15 mutant40, the rdr2-1 mutant41, 35S:mir399d6 and 35S:mir156a8. The dcl1-9 and hyl1 mutants were obtained from the Nottingham Arabidopsis Stock Centre (NASC; N3828 and N564863). pSUC2:YFP and pS18:YFP seeds were obtained from NASC (N2106198 and N2106196, respectively).
The two miRNA overexpressing lines are referred to as OxmiR399 and OxmiR156 in the text and figures. Arabidopsis seeds were vernalized at 4 °C in the dark for 48 h. They were then germinated at 22 °C day/18 °C night, with a photoperiod of 12 h. For soil-grown plants, seeds were sown directly on a 3:1 peat/perlite mixture. Plants growing in sterile conditions were obtained as follows: seeds were surface-sterilized using sequential incubations in 70% (v/v) ethanol, 5% (v/v) hypochlorite solution and then washed repeatedly with sterile water. For seedling experiments, seeds were sown in six multiwell plates containing 2 ml of liquid MS medium (Murashige and Skoog half-strength medium, 0.5% w/v sucrose, pH 5.7) under continuous shaking. For plants grown hydroponically, seeds were sown in polystyrene trays containing 30 rock-wool wells (Grodan) floating in hydroponic solution42.
Treatment of seedlings with exogenous RNA
Arabidopsis wild-type and mutant seedlings were prepared as described above. Six-day-old seedlings were used for RNA feeding experiments. Before applying exogenous RNA, the media was removed and replaced by 2 ml of freshly prepared MS media. Total RNA, synthetic ds-miR399, synthetic ds-miR319 or synthetic ds-miR156 was added to the media as indicated in the figure legends. Seedlings (50 seedlings per well) were incubated with exogenous RNA completely submerged by the solution (with gentle shaking) as indicated in the figure legends.
Confocal microscopy
Synthetic miRNA was labelled with Cy3 using the Silencer siRNA labelling kit (Thermo Fisher Scientific) in accordance with the manufacturer’s instructions. Five-day-old Col-0 seedlings grown in vertical plates (MS half strength, 0.5% sucrose and 0.7% plant agar) were treated by applying 9.6 µl of the labelled miRNA (20 µM) along the roots. After 2 h incubation, confocal microscopy was performed. Samples were washed two or three times with distilled water to prevent labelled miRNA from attaching to the outer root surface. To verify that the fluorescence was emitted by the miRNA and not the free dye, a blank labelling reaction was performed (using water instead of miRNA), and plants were treated with this blank reaction. Treated roots were imaged using a Zeiss Airyscan 800 laser scanning confocal microscope. Cy3 miRNA was excited using a 561 nm laser and fluorescence was detected at 564–620 nm. pSUC2:YFP and pS18:YFP fluorescence was detected using a 488 nm laser and 492–550 nm emission wavelength. Sequential scanning was used to eliminate bleed-through.
Cocultivation experiments
Arabidopsis plants were grown in polystyrene trays containing 30 rock-wool wells (Grodan) floating in hydroponic solution42. Plastic boxes (56 × 29 × 38 cm) containing 1 l of hydroponic solution were used. Wild-type and 35S:miR399d plants were grown in separate trays/plastic boxes and also mixed in a shared tray/plastic box (cocultivation). Gene expression analysis was performed by harvesting 35-day-old plants. Five rosettes (five biological replicates) were used per treatment. In the experiment using 35S:mi156a and wild-type plants, 35S:miR156a plants were grown as described above for 35S:miR399d plants.
Constructs and transgenic line preparation
Arabidopsis miR399 triggers repression of PHO2 mRNA targeting five complementary sequences located in the 5′-UTR of the PHO2 transcript. We produced a plasmid named pUBQ10:PHO2-UTR–Fluc, which expresses a Fluc mRNA fused to 5′-UTR of PHO2 (Extended Data Fig. 8). The 5′-UTR of PHO2 was fused to the promoter of UBIQUITIN10 by overlapping PCR using Phusion High-Fidelity DNA Polymerase (Thermo Fisher Scientific), and then introduced into the pENTR/D‐topo vector (Thermo Fisher Scientific) to generate pENTR‐pUBQ10:5′UTRPHO2. The resulting entry vector was recombined into the destination vector pGWL7 using the LR reaction mix II (Thermo Fisher Scientific) to obtain the expression vector pUBQ10:PHO2-UTR–Fluc. A mutated version of plasmid pUBQ10:PHO2-UTR–Fluc was created by replacing part of the wild-type sequence of the 5′-UTR of PHO2 with a sequence lacking the miR399 target sequences (Extended Data Fig. 3). The mutated oligonucleotide was generated synthetically (GeneArt, Thermo Fisher Scientific) and inserted by ligation into pENTR‐pUBQ10:5′UTRPHO2. The entry vector was recombined into the destination vector pGWL7, as described above. Ath-miR156a targets the coding sequence of SPL9. The SPL9 coding sequence was cloned from cDNA using Phusion High-Fidelity DNA Polymerase (Thermo Fisher Scientific), subcloned in pENTR/D‐topo vector and then recombined into p2GWL7 by LR clonase (Thermo Fisher Scientific) to obtain the expression vector 35S:SPL9, which was used to produce the 35S:SPL9-Fluc transgenic line (Extended Data Fig. 8).
Extended Data Fig. 8. Schematic representation of the reporters.

a pUBQ10:PHO2-UTR-Fluc and b reporter 35S:SPL9-Fluc. Blue represents the 5’UTR, green the coding sequence, white the promoter, yellow the Fluc coding sequence. The red bars identify the miRNA target sites (five sites in the 5’UTR of PHO2, one site in the SPL9 cds).
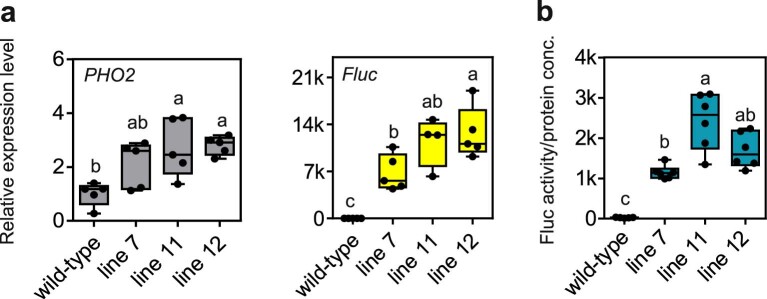
To produce transgenic plants bearing the pPHO2:Fluc construct, a 3.5-kb sequence upstream of the PHO2 start codon was PCR amplified from genomic DNA using Phusion High-Fidelity DNA Polymerase (Thermo Fisher Scientific) and cloned in the pENTR/D‐topo vector (Thermo Fisher Scientific). Subsequently, the PHO2 promoter was recombined into pBGWL7 by LR clonase (Thermo Fisher Scientific). The final vector was transformed into Arabidopsis Col-0 plants via Agrobacterium tumefaciens-mediated transformation, using the floral dip method. Transgenic seedlings were screened for glufosinate ammonium resistance. Independent lines were selected measuring the RNA expression level and the activity of luciferase as described above (Extended Data Fig. 9). The pPHO2:PHO2-UTR–Fluc reporter line was crossed with ago1-27 and rdr6-15 mutants.
Extended Data Fig. 9. Screening of transgenic pPHO2:399target-Fluc seedlings.
Screening of transgenic pPHO2:399target-Fluc seedlings for RNA expression level a and the activity of luciferase b. a: Data are mean of 6 biological replicates ± SD. b: The bottom and top of each box denote the first and third quartile, respectively (n = 6). In the box-blots, the dots represent the single data points, whiskers denote the min/max values, the box defines the interquartile range, centre represents the median, box bounds represent the lower and upper quartiles. Different letters (a,b,c) refer to differences in ANOVA tests (Tukey’s post‐hoc test, P < 0.05).
The ami-Fluc construct used in this study was designed as follows. The 21-nucleotide sequence of the mature miR319a was replaced in the pre-miR319a sequence by the 21-nucleotide sequence targeting the firefly luciferase transcript (TTAACGCCCAGCGTTTTCCCG). Artificial microRNA targeting the Firefly reporter gene was designed as described in Schwab et al.43. The region in the miRNA base pairing with the ami-Fluc 21-nucleotide sequence along the hairpin structure of the pre-miRNA with the sequence was edited to maintain perfect pairing (Supplementary Table 1)43. A gateway entry vector containing the above described ami-Fluc flanked by attL1 and attL2 sites was synthesized using GeneArt (Thermo Fisher Scientific). The entry vector was subsequently used in the LR reaction with the pB7WG2 destination vector44 to generate the final 35S:ami-Fluc construct. Agrobacterium GV3101 strain was used to deliver the T-DNA into the Arabidopsis genome via floral dip. Transgenic T1 seeds were stratified on MS1/2 agar media containing 25 µg ml−1 of Basta (glufosinate ammonium) for selection of transgenic seedlings. A full list of primers used in the cloning is reported in Supplementary Table 2. ami-Fluc expression was assessed by qPCR using the primers reported in Supplementary Table 3.
Protoplast isolation and transformation
Arabidopsis mesophyll protoplasts were isolated and transformed as described by Iacopino et al.45. Protoplasts were isolated from leaves of 3-week-old plants through incubation in enzymatic solution (1% w/v cellulase, 0.3% w/v macerozyme, 0.4 M mannitol, 20 mM KCl, 10 mM CaCl2, 20 mM MES, pH 5.7) for 3 h in the dark at 22 °C. Afterwards, protoplasts were filtered, washed twice with W5 solution (154 mM NaCl, 125 mM CaCl2, 5 mM KCl, 2 mM MES, pH 5.7) and subsequently centrifuged for 2 min at 100 × g before being resuspended in 0.4 M mannitol, 15 mM MgCl2, 4 mM MES (pH 5.7) until a final concentration of 5 × 10⁵ cells ml−1 was obtained. For the transformation, 4 µg of each plasmid was added to 100 µl of protoplast suspension and then mixed gently with an equal volume of a 40% PEG 4000 solution (0.2 M mannitol, 100 mM CaCl2). The mixture was incubated for 20 min at room temperature in the dark, and then 440 µl of W5 solution was added to stop the transformation. Protoplasts were centrifuged at 100 × g. for 2 min, resuspended in 1 ml of WI solution (50 mM mannitol, 4 mM MES pH 5.7, 20 mM KCl, 50 mM glucose) and transferred to six multiwell plates. For the exogenous RNA feeding experiments, 1 µl of total RNA (0.1 µg µl−1) isolated from 35S:miR399d plants or 1 µl of synthetic ds-miRNA (0.2 µM) was added to the WI solution. Protoplasts were incubated overnight at 22 °C in the dark. For luciferase activity quantification, protoplasts were pelleted by centrifugation at 4,000 × g for 1 min, and flash frozen in liquid nitrogen.
Luciferase activity quantification
Firefly (Photinus pyralis) and Renilla reniformis luciferase activities were quantified using the Dual-Luciferase Reporter Assay System (Promega) following the manufacturer’s instructions. For protoplast transient transformation, activity of firefly luciferase was normalized on Renilla luciferase activity. For transgenic plants, total proteins were extracted with Passive Lysis buffer (Promega). Firefly luciferase activity was normalized on protein concentration which was quantified using Bradford protein assay (Bio-Rad).
Total RNA extraction and real-time qPCR analysis
Total RNA was extracted from Arabidopsis seedlings using a phenol–chloroform extraction protocol46. RNA quality was assessed by electrophoresis using a 1% (w/v) agarose gel, followed by spectrophotometric quantification. cDNA was synthesized from 1 µg of total RNA using the Maxima First Strand cDNA Synthesis Kit for RT–qPCR, with dsDNase (Thermo Fisher Scientific). For real-time qPCR, 30 ng of cDNA were analysed using an ABI Prism 7300 sequence detection system (Applied Biosystems). PowerUp SYBR Green Master Mix (Thermo Fisher Scientific) was used to monitor dsDNA synthesis in accordance with the manufacturer’s instructions. Expression of UBIQUITIN10 (At4G05320) was used as the housekeeping gene for internal normalization. Relative RNA levels were calculated using GeNorm (http://medgen.ugent.be/~jvdesomp/genorm).
Mature miRNAs were quantified using the stem–loop RT–PCR technique47. A total of 2.75 µg of total RNA was subjected to DNase treatment using DNA RQ1 RNase-free DNase (Promega), and cDNA was synthesized using Superscript IV (Invitrogen) according to the manufacturer’s instructions. qPCR amplification was performed on 50 ng of cDNA, as described above. Supplementary Tables 3 and 4 give a list of the primers used for qPCR analysis.
Synthetic miRNAs, annealing of RNA oligonucleotides and labelling reaction
Ath-miR399d and Ath-miR156a sequences were obtained from the miRBase database (www.mirbase.org). Mature miRNA sequences and their complementary strands were chemically synthesized by Eurofins genomics (https://www.eurofinsgenomics.eu/). The nucleotide sequence (5′ to 3′) for the miRNAs used are reported in Supplementary Table 1. The 3′-end of the strands carried a methyl group, as did the endogenous miRNAs. The strands were resuspended in sigma water. A purification step was then performed using Illustra MicroSpin G-25 columns (GE Healthcare) to remove possible contaminants from the strands. The annealing reaction was performed by combining 50 µM solutions of mature miRNA and passenger strand with 5× annealing buffer (Thermo Fisher Scientific) for a final concentration of 20 µM. The mixture was incubated at 90 °C for 1 min, followed by a gradual decrease in temperature to 37 °C, held for 45 min. RNA oligonucleotides were labelled using the Silencer siRNA Labelling Kit with Cy 3 dye (Thermo Fisher Scientific) according to the manufacturer’s instructions. Labelling of dsRNA was confirmed by electrophoresis using 1% (w/v) agarose gel followed by visualization using a ChemiDoc XRS+ imaging system (Bio-Rad).
5′-RACE–PCR experiment
For the detection of 3′-cleavage products from miR399-targeted Fluc, 5′-RACE was performed using the FirstChoice RLM-RACE Kit (Invitrogen). Seedlings were grown in six multiwell plates containing 2 ml of liquid MS medium under continuous shaking. Six-day-old seedlings were used for RNA feeding experiments. Before applying exogenous RNA, the medium was removed and replaced by 2 ml of freshly prepared MS media. To detect the cleavage products of miR399-targeted Fluc transcript, synthetic ds-miR399 was added to the media to a final concentration of 0.2 nM ml−1. After 72 h of incubation with the RNA, seedlings were collected in liquid nitrogen and total RNA was extracted with a Spectrum Plant Total RNA Kit (Sigma). A total of 1 μg of total RNA was ligated directly with the 5′-RACE Adapter oligonucleotide without further processing of the RNA samples. Reverse transcription was carried out according to the manufacturer’s instructions. Semiquantitative PCR reactions were performed to quantify 3′-cleavage products and full-length transcripts. The PCR reactions were performed under regular conditions: 35 cycles of 94 °C for 30 s, 60 °C for 30 s and 72 °C for 1 min. The same amount of RNA was reverse transcribed with random decamers to amplify UBQ10 as an internal loading control. Oligonucleotide sequences for PCR amplification are listed in Supplementary Table 5. The 3′-cleavage products of PHO2 were subcloned into a pCR 2.1 vector (Thermo Fisher Scientific) and sequenced to detect the cleavage site of miR399d on the 5′-UTR of PHO2.
Statistical analyses
All data are from biological replicates. Data were analysed using one- and two-way analysis of variance (ANOVA) tests (Tukey’s post‐hoc test; different letters in the figures indicate differences for P < 0.05; individual P values are provided in the source data files), and different letters were assigned to values that differed significantly from each other. Pairwise comparison was performed by Welch’s t-test (actual P values are given in the figures). In the boxplots, dots represent single data points, whiskers denote minimum/maximum values, the box defines the interquartile range, the centre represents the median and box bounds represent the lower and upper quartiles. GraphPad v.8 was used to perform statistical analysis of the data.
Reporting Summary
Further information on the research design is available in the Nature Research Reporting Summary linked to this article.
Supplementary information
Supplementary Tables 1–5.
Acknowledgements
This work was financially supported by Valagro spa (Atessa, Italy) and by Sant’Anna School of Advanced Studies (Pisa, Italy) to P.P.
Extended data
Source data
Graph data and single P values.
Graph data.
Graph data and single P values.
Graph data and single P values.
Graph data.
Graph data and single P values.
Graph data and single P values.
Graph data and single P values.
Graph data and single P values.
Graph data and single P values.
Unprocessed gel images.
Graph data and single P values.
Graph data and single P values.
Graph data.
Graph data and single P values.
Author contributions
P.P. and A.P. conceived the project. P.P. and E.L. coordinated the project. F.B., M.J.L.-C., A.S., G.N., A.B.K. and B.S. performed experiments on plants and protoplasts. F.B. and S.I. produced the transgenic Fluc reporter lines. D.A.W. and G.F. performed the confocal microscopy experiments. F.B., M.J.L.-C. and E.L. performed data analysis and prepared the figures. B.S. performed the root phenotype experiment. A.B.K. prepared DNA constructs and protoplasts for transient expression experiments. P.P. and E.L. wrote the manuscript. All authors read and contributed to previous versions and approved the final version.
Data availability
There are no restrictions on data availability. All data are reported in the figures, in the supplementary material file and in source data files. The miRNA database utilized is miRbase: https://www.mirbase.org/. Source data are provided with this paper.
Competing interests
This work was financially supported in part by Valagro spa. A.S. and A.P. are employees of Valagro spa. P.P., E.L., A.S., G.N. and A.P are inventors in Patent EP3055415B1, owned by Valagro spa, that deals with some of the topics described in the manuscript. The remaining authors declare no competing interests.
Footnotes
Peer review information Nature Plants thanks Jianxin Ma, Neena Mitter and Mathew Lewsey for their contribution to the peer review of this work.
Publisher’s note Springer Nature remains neutral with regard to jurisdictional claims in published maps and institutional affiliations.
These authors contributed equally: Federico Betti, Maria Jose Ladera-Carmona.
Contributor Information
Elena Loreti, Email: loreti@ibba.cnr.it.
Pierdomenico Perata, Email: p.perata@santannapisa.it.
Extended data
is available for this paper at 10.1038/s41477-021-01005-w.
Supplementary information
The online version contains supplementary material available at 10.1038/s41477-021-01005-w.
References
- 1.Bologna NG, Voinnet O. The diversity, biogenesis, and activities of endogenous silencing small RNAs in Arabidopsis. Annu. Rev. Plant Biol. 2014;65:473–503. doi: 10.1146/annurev-arplant-050213-035728. [DOI] [PubMed] [Google Scholar]
- 2.Borges F, Martienssen RA. The expanding world of small RNAs in plants. Nat. Rev. Mol. Cell Biol. 2015;16:727–741. doi: 10.1038/nrm4085. [DOI] [PMC free article] [PubMed] [Google Scholar]
- 3.Molnar A, Melnyk C, Baulcombe DC. Silencing signals in plants: a long journey for small RNAs. Genome Biol. 2011;12:215. doi: 10.1186/gb-2010-11-12-219. [DOI] [PMC free article] [PubMed] [Google Scholar]
- 4.Li S, et al. Unidirectional movement of small RNAs from shoots to roots in interspecific heterografts. Nat. Plants. 2021;7:50–59. doi: 10.1038/s41477-020-00829-2. [DOI] [PubMed] [Google Scholar]
- 5.Pant BD, Buhtz A, Kehr J, Scheible WR. MicroRNA399 is a long-distance signal for the regulation of plant phosphate homeostasis. Plant J. 2008;53:731–738. doi: 10.1111/j.1365-313X.2007.03363.x. [DOI] [PMC free article] [PubMed] [Google Scholar]
- 6.Bari R, Pant BD, Stitt M, Scheible WR. PHO2, microRNA399, and PHR1 define a phosphate-signaling pathway in plants. Plant Physiol. 2006;141:988–999. doi: 10.1104/pp.106.079707. [DOI] [PMC free article] [PubMed] [Google Scholar]
- 7.Bhogale S, et al. MicroRNA156: a potential graft-transmissible microRNA that modulates plant architecture and tuberization in Solanum tuberosum ssp. andigena. Plant Physiol. 2014;164:1011–1027. doi: 10.1104/pp.113.230714. [DOI] [PMC free article] [PubMed] [Google Scholar]
- 8.Wu G, et al. The sequential action of miR156 and miR172 regulates developmental timing in Arabidopsis. Cell. 2009;138:750–759. doi: 10.1016/j.cell.2009.06.031. [DOI] [PMC free article] [PubMed] [Google Scholar]
- 9.Cai Q, He B, Kogel KH, Jin H. Cross-kingdom RNA trafficking and environmental RNAi — nature’s blueprint for modern crop protection strategies. Curr. Opin. Microbiol. 2018;46:58–64. doi: 10.1016/j.mib.2018.02.003. [DOI] [PMC free article] [PubMed] [Google Scholar]
- 10.Zhang T, et al. Cotton plants export microRNAs to inhibit virulence gene expression in a fungal pathogen. Nat. Plants. 2016;2:16153. doi: 10.1038/nplants.2016.153. [DOI] [PubMed] [Google Scholar]
- 11.Weiberg A, et al. Fungal small RNAs suppress plant immunity by hijacking host RNA interference pathways. Science. 2013;342:118–123. doi: 10.1126/science.1239705. [DOI] [PMC free article] [PubMed] [Google Scholar]
- 12.Cai Q, et al. Plants send small RNAs in extracellular vesicles to fungal pathogen to silence virulence genes. Science. 2018;360:1126–1129. doi: 10.1126/science.aar4142. [DOI] [PMC free article] [PubMed] [Google Scholar]
- 13.Koch A, et al. An RNAi-based control of Fusarium graminearum infections through spraying of long dsRNAs involves a plant passage and is controlled by the fungal silencing machinery. PLoS Pathog. 2016;12:e1005901. doi: 10.1371/journal.ppat.1005901. [DOI] [PMC free article] [PubMed] [Google Scholar]
- 14.Mitter N, et al. Clay nanosheets for topical delivery of RNAi for sustained protection against plant viruses. Nat. Plants. 2017;3:16207. doi: 10.1038/nplants.2016.207. [DOI] [PubMed] [Google Scholar]
- 15.Shahid S, et al. MicroRNAs from the parasitic plant Cuscuta campestris target host messenger RNAs. Nature. 2018;553:82–85. doi: 10.1038/nature25027. [DOI] [PubMed] [Google Scholar]
- 16.Whangbo JS, Hunter CP. Environmental RNA interference. Trends Genet. 2008;24:297–305. doi: 10.1016/j.tig.2008.03.007. [DOI] [PubMed] [Google Scholar]
- 17.Wang M, Thomas N, Jin H. Cross-kingdom RNA trafficking and environmental RNAi for powerful innovative pre- and post-harvest plant protection. Curr. Opin. Plant Biol. 2017;38:133–141. doi: 10.1016/j.pbi.2017.05.003. [DOI] [PMC free article] [PubMed] [Google Scholar]
- 18.Dubrovina AS, Kiselev KV. Exogenous RNAs for gene regulation and plant resistance. Int. J. Mol. Sci. 2019;20:2282. doi: 10.3390/ijms20092282. [DOI] [PMC free article] [PubMed] [Google Scholar]
- 19.Manavella PA, Koenig D, Weigel D. Plant secondary siRNA production determined by microRNA-duplex structure. Proc. Natl Acad. Sci. USA. 2012;109:2461–2466. doi: 10.1073/pnas.1200169109. [DOI] [PMC free article] [PubMed] [Google Scholar]
- 20.Yu N, Niu Q-W, Ng K-H, Chua N-H. The role of miR156/SPLs modules in Arabidopsis lateral root development. Plant J. 2015;83:673–685. doi: 10.1111/tpj.12919. [DOI] [PubMed] [Google Scholar]
- 21.Barrera-Rojas CH, et al. miR156-targeted SPL10 controls Arabidopsis root meristem activity and root-derived de novo shoot regeneration via cytokinin responses. J. Exp. Bot. 2020;71:934–950. doi: 10.1093/jxb/erz475. [DOI] [PubMed] [Google Scholar]
- 22.Shao Y, et al. OsSPL3, an SBP-domain protein, regulates crown root development in rice. Plant Cell. 2019;31:1257–1275. doi: 10.1105/tpc.19.00038. [DOI] [PMC free article] [PubMed] [Google Scholar]
- 23.Marquès-Bueno MM, et al. A versatile Multisite Gateway-compatible promoter and transgenic line collection for cell type-specific functional genomics in Arabidopsis. Plant J. 2016;85:320–333. doi: 10.1111/tpj.13099. [DOI] [PMC free article] [PubMed] [Google Scholar]
- 24.Allen E, Xie Z, Gustafson AM, Carrington JC. MicroRNA-directed phasing during trans-acting siRNA biogenesis in plants. Cell. 2005;121:207–221. doi: 10.1016/j.cell.2005.04.004. [DOI] [PubMed] [Google Scholar]
- 25.Cuperus JT, et al. Unique functionality of 22-nt miRNAs in triggering RDR6-dependent siRNA biogenesis from target transcripts in Arabidopsis. Nat. Struct. Mol. Biol. 2010;17:997–1003. doi: 10.1038/nsmb.1866. [DOI] [PMC free article] [PubMed] [Google Scholar]
- 26.Kurihara Y, Takashi Y, Watanabe Y. The interaction between DCL1 and HYL1 is important for efficient and precise processing of pri-miRNA in plant microRNA biogenesis. RNA. 2006;12:206–212. doi: 10.1261/rna.2146906. [DOI] [PMC free article] [PubMed] [Google Scholar]
- 27.Gordon KHJ, Waterhouse PM. RNAi for insect-proof plants. Nat. Biotechnol. 2007;25:1231–1232. doi: 10.1038/nbt1107-1231. [DOI] [PubMed] [Google Scholar]
- 28.Worrall EA, et al. Exogenous application of RNAi-inducing double-stranded RNA inhibits aphid-mediated transmission of a plant virus. Front. Plant Sci. 2019;10:265. doi: 10.3389/fpls.2019.00265. [DOI] [PMC free article] [PubMed] [Google Scholar]
- 29.Hua C, Zhao JH, Guo HS. Trans-kingdom RNA silencing in plant–fungal pathogen interactions. Mol. Plant. 2018;11:235–244. doi: 10.1016/j.molp.2017.12.001. [DOI] [PubMed] [Google Scholar]
- 30.Wang M, et al. Bidirectional cross-kingdom RNAi and fungal uptake of external RNAs confer plant protection. Nat. Plants. 2016;2:16151. doi: 10.1038/nplants.2016.151. [DOI] [PMC free article] [PubMed] [Google Scholar]
- 31.Dalakouras A, et al. Genetically modified organism-free RNA interference: exogenous application of RNA molecules in plants. Plant Physiol. 2020;182:38–50. doi: 10.1104/pp.19.00570. [DOI] [PMC free article] [PubMed] [Google Scholar]
- 32.Winston WM, Sutherlin M, Wright AJ, Feinberg EH, Hunter CP. Caenorhabditis elegans SID-2 is required for environmental RNA interference. Proc. Natl Acad. Sci. USA. 2007;104:10565–10570. doi: 10.1073/pnas.0611282104. [DOI] [PMC free article] [PubMed] [Google Scholar]
- 33.Schwarzenbach, H. & Gahan, P. B. MicroRNA shuttle from cell-to-cell by exosomes and its impact in cancer. Non-coding RNA5 (2019). [DOI] [PMC free article] [PubMed]
- 34.Voinnet O. Non-cell autonomous RNA silencing. FEBS Lett. 2005;579:5858–5871. doi: 10.1016/j.febslet.2005.09.039. [DOI] [PubMed] [Google Scholar]
- 35.Subramanian S. Little RNAs go a long way: long-distance signaling by microRNAs. Mol. Plant. 2019;12:18–20. doi: 10.1016/j.molp.2018.12.001. [DOI] [PubMed] [Google Scholar]
- 36.Pyott DE, Molnar A. Going mobile: non-cell-autonomous small RNAs shape the genetic landscape of plants. Plant Biotechnol. J. 2015;13:306–318. doi: 10.1111/pbi.12353. [DOI] [PubMed] [Google Scholar]
- 37.Dalakouras A, et al. Delivery of hairpin RNAs and small RNAs into woody and herbaceous plants by trunk injection and petiole absorption. Front. Plant Sci. 2018;9:1253. doi: 10.3389/fpls.2018.01253. [DOI] [PMC free article] [PubMed] [Google Scholar]
- 38.Buhtz A, Springer F, Chappell L, Baulcombe DC, Kehr J. Identification and characterization of small RNAs from the phloem of Brassica napus. Plant J. 2008;53:739–749. doi: 10.1111/j.1365-313X.2007.03368.x. [DOI] [PubMed] [Google Scholar]
- 39.Morel JB, et al. Fertile hypomorphic ARGONAUTE (ago1) mutants impaired in post-transcriptional gene silencing and virus resistance. Plant Cell. 2002;14:629–639. doi: 10.1105/tpc.010358. [DOI] [PMC free article] [PubMed] [Google Scholar]
- 40.Peragine A, Yoshikawa M, Wu G, Albrecht HL, Poethig RS. SGS3 and SGS2/SDE1/RDR6 are required for juvenile development and the production of trans-acting siRNAs in Arabidopsis. Genes Dev. 2004;18:2368–2379. doi: 10.1101/gad.1231804. [DOI] [PMC free article] [PubMed] [Google Scholar]
- 41.Xie Z, et al. Genetic and functional diversification of small RNA pathways in plants. PLoS Biol. 2004;2:e104. doi: 10.1371/journal.pbio.0020104. [DOI] [PMC free article] [PubMed] [Google Scholar]
- 42.Gibeaut DM, Hulett J, Cramer GR, Seemann JR. Maximal biomass of Arabidopsis thaliana using a simple, low-maintenance hydroponic method and favorable environmental conditions. Plant Physiol. 1997;115:317–319. doi: 10.1104/pp.115.2.317. [DOI] [PMC free article] [PubMed] [Google Scholar]
- 43.Schwab R, Ossowski S, Riester M, Warthmann N, Weigel D. Highly specific gene silencing by artificial microRNAs in Arabidopsis. Plant Cell. 2006;18:1121–1133. doi: 10.1105/tpc.105.039834. [DOI] [PMC free article] [PubMed] [Google Scholar]
- 44.Karimi M, Inzé D, Depicker A. GATEWAYTM vectors for Agrobacterium-mediated plant transformation. Trends Plant Sci. 2002;7:193–195. doi: 10.1016/S1360-1385(02)02251-3. [DOI] [PubMed] [Google Scholar]
- 45.Iacopino S, et al. A synthetic oxygen sensor for plants based on animal hypoxia signaling. Plant Physiol. 2019;179:986–1000. doi: 10.1104/pp.18.01003. [DOI] [PMC free article] [PubMed] [Google Scholar]
- 46.Perata P, Matsukura C, Vernieri P, Yamaguchi J. Sugar repression of a gibberellin-dependent signaling pathway in barley embryos. Plant Cell. 1997;9:2197–2208. doi: 10.2307/3870579. [DOI] [PMC free article] [PubMed] [Google Scholar]
- 47.Chen C, et al. Real-time quantification of microRNAs by stem-loop RT-PCR. Nucleic Acids Res. 2005;33:e179–e179. doi: 10.1093/nar/gni178. [DOI] [PMC free article] [PubMed] [Google Scholar]
Associated Data
This section collects any data citations, data availability statements, or supplementary materials included in this article.
Supplementary Materials
Supplementary Tables 1–5.
Data Availability Statement
There are no restrictions on data availability. All data are reported in the figures, in the supplementary material file and in source data files. The miRNA database utilized is miRbase: https://www.mirbase.org/. Source data are provided with this paper.


