

Abstract
Purpose:
To present age- and sex- specific percentiles for daily wrist-worn movement metrics in U.S. youth and adults. This metric represents a summary of all recorded movement, regardless of the purpose, context, or intensity.
Methods:
Wrist-worn accelerometer data from the combined 2011–2014 National Health and Nutrition Examination Survey (NHANES) cycles and the 2012 NHANES National Youth Fitness Survey (NNYFS) were used for this analysis. Monitor-Independent Movement Summary units (MIMS-units) from raw triaxial accelerometer data were used. We removed the partial first and last assessment days and days with ≥ 5% non-wear time. Participants with ≥ 1 valid day were included. Mean MIMS-units were calculated across all valid days. Percentile tables and smoothed curves of daily MIMS-units were calculated for each age and sex using Generalized Additive Models for Location Shape and Scale (GAMLSS).
Results:
The analytical sample included 14,705 participants ages ≥ 3 years. The MIMS-unit activity among youth was similar for both sexes while adult females generally had higher MIMS-unit activity than males. Median daily MIMS-units peaked at age 6 for both sexes (males: 20,613; females: 20,706). Lowest activity was observed for males and females 80+ years of age; 8,799 and 9,503, respectively.
Conclusion:
Population referenced MIMS-unit percentiles for U.S. youth and adults are a novel means of characterizing total activity volume. By using MIMS-units, we provide a standardized reference that can be applied across various wrist-worn accelerometer devices. Further work is needed to link these metrics to activity intensity categories and health outcomes.
Keywords: NHANES, NNYFS, Monitor-Independent Movement Summary units, MIMS-units, physical activity, surveillance, youth, adults
INTRODUCTION
Device-based measures (e.g., accelerometers) are increasingly being used to capture time spent in physical activity (PA) in free-living settings for a variety of populations (1, 2). Metrics derived from these devices are associated with health outcomes such as all-cause mortality (3, 4), certain types of cancers (5), obesity (6, 7), and cardiovascular disease (6, 7).
In 2003, the National Health and Nutrition Examination Survey (NHANES) was the first U.S. nationally representative sample where hip-mounted accelerometers (Actigraph AM-7164, Actigraph, Pensacola, FL) were deployed to measure movement (8). Following the 2003–2006 NHANES deployment, devices improved to expand memory, extend battery life, and provide water-resistance. A major limitation of hip-worn accelerometers, which are often worn only while awake, is participant compliance, which is lower than with wrist-worn devices that can be worn continuously (9, 10). In 2011–2014, NHANES and the NHANES National Youth Fitness Survey (NNYFS) deployed ActiGraph GT3X+ wrist-worn accelerometers to measure movement behaviors. Advantages to this placement include lower participant burden that leads to higher compliance, a more secure attachment of the device, and 24-hour data, which allow for compositional and sleep analyses.
Methods to quantify time spent in different activity intensities from wrist-worn devices are still being developed with most current efforts utilizing high-resolution acceleration data rather than propriety activity counts (11). However, intensity classification methods have not been developed across the full age spectrum, and current algorithms demonstrate low classification accuracy and vary across accelerometer model and placement (12). Methods to classify conditions such as device non-wear and sleep vs. wake are also evolving (13, 14). Because the selection of accelerometer brand and use of cut points can have a significant effect on estimates of time spent in various intensities of activity, it has been difficult to compare findings across studies and devices, (11) and new approaches are needed.
One approach to address such issues is to use Monitor-Independent Movement Summary units (MIMS-units) (15) and age- and sex- specific percentiles (16, 17). Together these elements allow comparisons across populations and between studies using different devices. MIMS-units are derived from the raw triaxial accelerometer signals and are aggregated into a single summary designed to maximize informative signals while also using filtering to minimize environmental and movement artifacts. A key strength of this approach is that it can be used to process accelerometer data from different devices to facilitate comparison of device-based measures of movement across studies. The development of population-referenced PA percentile curves using a device-agnostic metric will allow for better surveillance, monitoring, and health promotion as it enables standardized comparisons of PA across populations and subgroups regardless of the assessment device.
The purposes of this analysis are to: (1) demonstrate the application of an open-source transparent and replicable method to analyze wrist-worn accelerometer data; and (2) develop age- and sex-specific percentile curves for wrist-worn accelerometer data in a nationally representative sample of the U.S. population ages 3 and older.
METHODS
Participants
Data from the combined 2011–2014 NHANES cycles and 2012 NNYFS were used in this analysis. The NHANES uses a complex, multistage probability design to obtain a representative sample of the non-institutionalized U.S. population (18). In 2011–2014, NHANES oversampled Hispanics, non-Hispanic Blacks, non-Hispanic Asians, and non-Hispanic whites and other ethnicities at or below 130% of the poverty level or who were 80+ years of age. NNYFS was conducted simultaneously during the second year of the 2011–2012 NHANES cycle in response to the need to collect national data on fitness and physical activity levels in an independent sample of youth ages 3–15 years (19). For both surveys, participants completed an in-person home interview and a visit to a mobile examination center (MEC). Participant’s demographic, socioeconomic, and health-related information were obtained during the interview, with the examination consisting of laboratory tests and medical and physiological measurements for NHANES and anthropometric and fitness measures for NNYFS.
The survey protocols were approved by National Center for Health Statistics (NCHS) ethics review board. Informed consent was obtained from all participants or their parent/legal guardian if under 18 years of age. Participants aged 7–17 years provided additional signed assent/consent to participate in the examination portion of the NHANES or NNYFS (19, 20). A total of 18,596 participants from the combined surveys were assessed for eligibility of which 16,417 returned devices with at least one minute of accelerometer data (Figure 1). Participants were excluded if they wore the device on the dominant wrist or wrist placement was unknown (n = 135), and if they did not have at least one valid day. A valid day was defined as having 1440 minutes of accelerometer data (i.e., 24 hours) in which less than 5% of time was considered non-wear (i.e., < 72 min) and less than 17 hours were recorded as sleep-wear (n = 1,577), resulting in the final sample of 14,705 participants (Figure 1).
Figure 1:
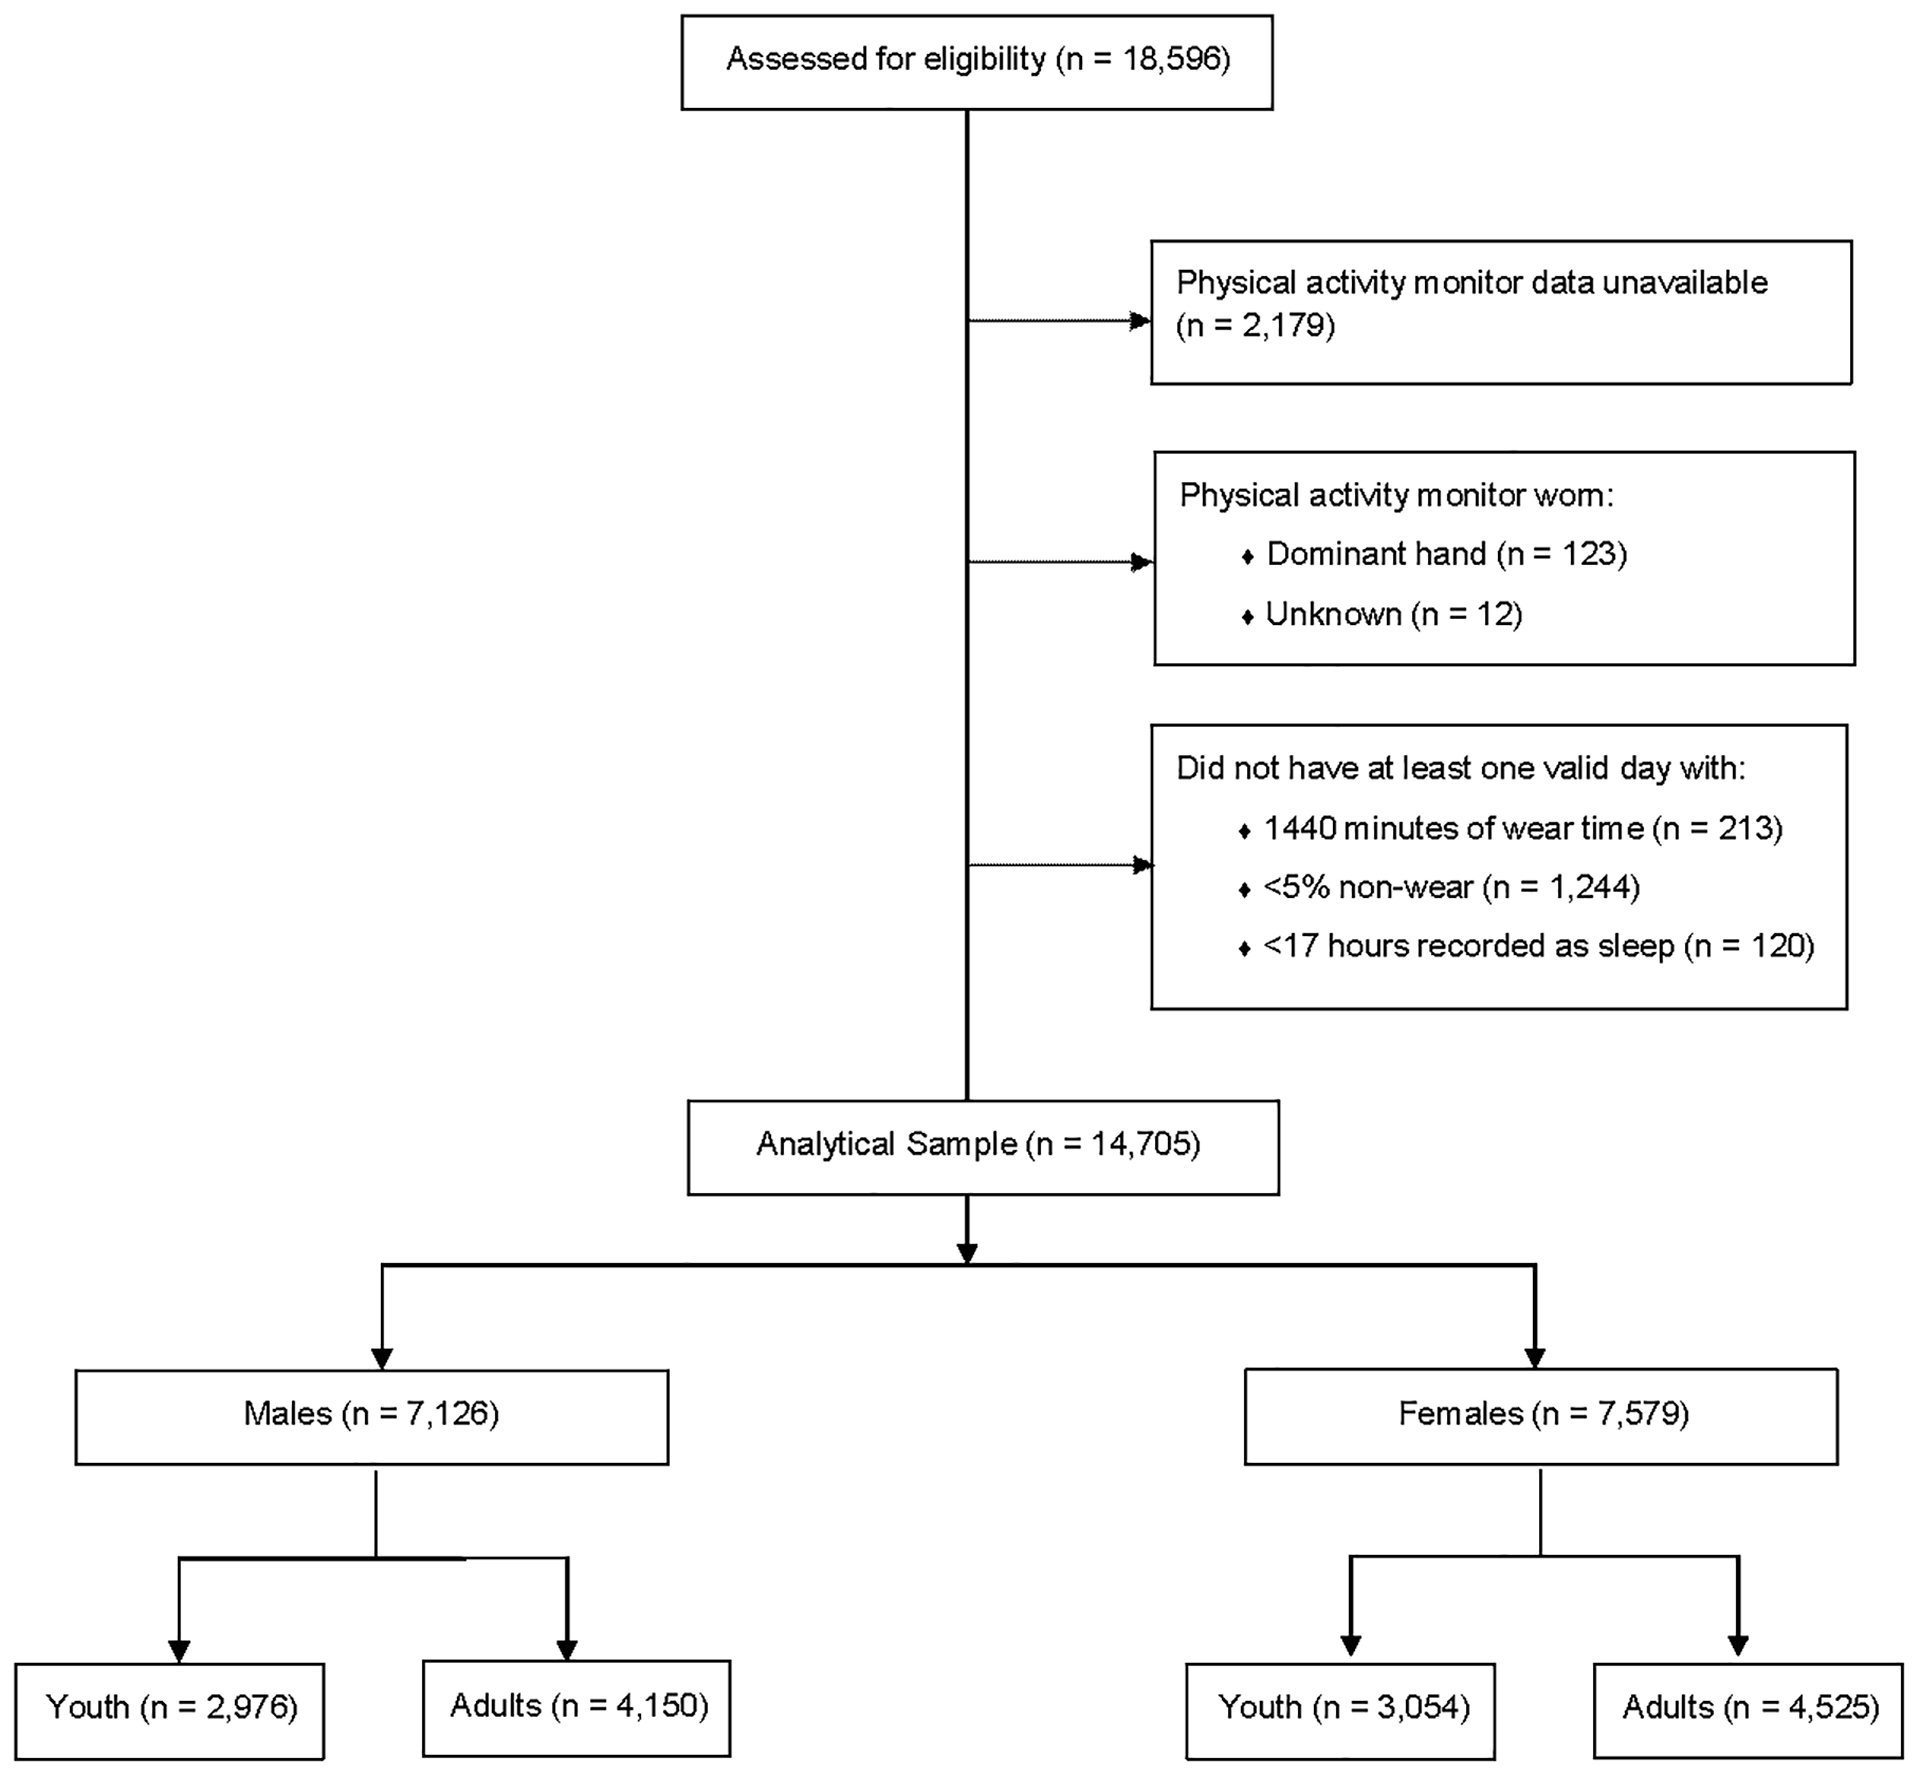
Analytical sample of combined 2011–2014 NHANES cycles and 2012 NNYFS accelerometer component
Physical Activity
All participants 3 years of age or older in 2012 NNYFS and NHANES 2012–2014 and 6 years of age or older in NHANES 2011 were eligible for the physical activity monitor (PAM) component and were asked to wear an ActiGraph GT3X+ (Actigraph, Pensacola, FL) accelerometer on their non-dominant wrist for 7 full and two partial days. To determine the non-dominant arm in children 3–5 years of age, the interviewer asked parents “Is your child left or right-handed?”. If the parent refused the question or did not know which was the dominant hand, the interviewer asked, “Which hand do they use more often when they are eating, drawing, and grabbing things?”. All other participants over age 6 were asked “Which hand do you usually write with?” to determine the non-dominant arm (20, 21). If the non-dominant hand could not be identified for participants of any age, then the default option was to place the monitor on the left wrist (n = 12, Figure 1).
Starting on the day of their MEC exam (1st day of wear), participants were asked to wear the PAM continuously for 7 full days (2nd-8th days of wear) and remove the device on the morning of the 9th calendar day for return via mail. The device was programmed to record acceleration at 80 Hz. The raw acceleration data were converted into MIMS-units using a 4-step process that comprised interpolation, extrapolation, bandpass filtering, and aggregation of data for each axis. Briefly, interpolation creates a consistent sampling rate for each signal. Extrapolation is used to filter out ‘maxed out’ areas of signals that can result in unusable data. Bandpass filtering is used to remove non-movement-related vibrations and the gravity vector; and aggregation sums the processed signals from each axis, resulting in MIMS-units that correspond to the total amount of movement activity (15). Expanded discussion of the MIMS-unit algorithm including validation and comparison to other raw accelerometer-derived metrics is detailed by John et al (15).
Daily wear time was determined through wake-wear, sleep-wear, and non-wear daily estimates simultaneously calculated by a machine learning algorithm (22) using a three-step process. First, signal features for each 1.5 minutes of data were extracted and a machine learning algorithm predicted whether each 30s of data was wake, sleep, or non-wear. Second, minimum durations of classified minutes (e.g., sleep wear period <10min) were filtered according to information in prior and subsequent periods. If the information in the prior and subsequent periods did not match the predicted category, then this category was reassigned to the predicted category in the adjacent period with the higher confidence value. Third, longer periods of classified minutes with orientation changes were considered and minutes re-classified from non-wear to sleep-wear and vice versa to reflect common periodic changes in body orientation during sleep. Partial days of wear (1st day and 9th day) were removed prior to analyses. Previous research indicates that for population-level analyses one day is sufficient to generate stable group-level estimates of activity (23), therefore participants with one or more valid days of monitor wear time were eligible to be included in this analysis. Total activity was represented by MIMS-units accumulated daily and was averaged across all valid days of wear.
Statistical Analysis
Data were accessed through and processed by the NCHS Research Data Center (RDC). This was necessary because of disclosure risk for participants ages 3–5 years, who were only included in one of the years of the NHANES 2011–2012 cycle prior to full implementation in NNYFS and NHANES 2013–2014, and the need for special sample weights and design variables for the combined sample from NNYFS and NHANES 2011–12. Access to these data requires approval of a proposal by the NCHS RDC (https://www.cdc.gov/rdc/index.htm). NHANES samples adults of all ages, but to prevent disclosure participants ages 80 and older are top-coded as age 80. For analyses only using the adult data there are no disclosure risks requiring RDC access; all adult accelerometer data are publicly available.
Sex- and age-specific means, medians, and frequencies were calculated using SAS v9.4 (SAS Institute, Inc.) and accounted for sample weighting and the complex sampling design using primary sampling units (PSU) to allow correct estimation of standard errors, in compliance with the NHANES and NNYFS analytical guidelines (24).
Sex- and age-specific percentile curves were constructed using the Generalized Additive Models for Location Scale and Shape (GAMLSS) method (25) as implemented in the gamlss R package (26). An extension of LMS method (27), GAMLSS models the MIMS-units at each age with a parametric distribution and allows characteristics of that distribution to change smoothly (nonparametrically) with age. For the parametric distribution we considered two very flexible distributions: the Box-Cox t (BCT) and the Box-Cox Power Exponential (BCPE). The location, scale, skewness, and kurtosis of each was modeled to vary smoothly with age using penalized B-splines (28), and the amount of smoothing chosen by maximum likelihood. The models incorporated survey weights that were normalized to sum up to the sample size for computational stability.
The BCT distribution was chosen for the figures we present based on Akaike information criterion and Schwarz’s Bayesian criterion (29), but BCPE gave very similar results. Goodness of fit was assessed by quantile-quantile (QQ) and worm plots (30). In order to further protect against model misspecification, we compared the quantile curves from GAMLSS to nonparametric curves produced through quantile regression using the R package quantreg (31), and results were similar. Final model parameters and percentiles corresponding to the 3rd, 5th, 10th, 25th, 50th, 75th, 90th, 95th, and 97th were generated. Significance testing was not conducted as a different set of analyses would be required. Complete R code for generation of percentiles is included in Supplemental Files 1 and 2 (see Files, Supplemental Digital Content 1, R code for youth percentile generation using GAMLSS; and Supplemental Digital Content 2, R code for adult percentile generation using GAMLSS).
RESULTS
The analytical sample included 79% of the eligible sample of 18,596 participants (Figure 1). Tables 1 and 2 present the mean activity levels and device compliance for youth and adults, respectively. In males and females, wear compliance was highest for participants aged 70–79 years, for whom 85.7% and 85.5% had at least one valid day, and compliance was lowest among those aged 3–5 years, with 68.1% and 73.2% having at least one valid day, respectively. The number of valid wear days varied across the sample, ranging from an average of 4.2 – 6.3 days.
Table 1:
Characteristics of the Analyzed Sample, Youth Ages 3–19 (n = 6,030) by Sex.
| Males | Females | |||||
|---|---|---|---|---|---|---|
| 3–5 | 6–11 | 12–19 | 3–5 | 6–11 | 12–19 | |
| N | 452 | 1338 | 1186 | 436 | 1380 | 1238 |
| Mean (SEM) | ||||||
| Age (years) | 4.0 (0.05) | 8.4 (0.06) | 14.9 (0.09) | 4.0 (0.06) | 8.6 (0.05) | 15.0 (0.09) |
| MIMS-units/d | 19480 (139.8) | 19396 (131.2) | 14419 (186.3) | 19440 (112.8) | 19480 (159.2) | 15052 (153.9) |
| Wake Wear (min/d) | 883.0 (3.3) | 912.8 (2.1) | 901.8 (3.7) | 871.3 (2.6) | 911.1 (1.3) | 897.2 (5.0) |
| Non-Wear (min/d) | 1.4 (0.3) | 0.9 (0.3) | 2.0 (0.4) | 0.9 (0.3) | 0.9 (0.1) | 1.6 (0.3) |
| Sleep Wear (min/d) | 515.2 (3.4) | 485.4 (2.1) | 477.5 (3.1) | 530.6 (2.7) | 490.2 (1.1) | 492.4 (4.9) |
| Unknown (min/d) | 40.3 (0.5) | 40.9 (0.5) | 58.7 (0.9) | 37.1 (0.5) | 37.8 (0.4) | 48.8 (0.7) |
| Valid days | 4.4 (0.2) | 4.2 (0.1) | 4.3 (0.1) | 4.7 (0.2) | 4.9 (0.1) | 5.0 (0.1) |
Abbreviations: d, day; MIMS, Monitor-Independent Movement Summary; min, minutes; SEM, Standard Error of Mean.
Unknown = valid minutes the MIMS algorithm was unable to categorize as wake, sleep, or non-wear.
Table 2:
Characteristics of the Analyzed Sample, Adults Ages 20+ (n = 8,675) by Sex.
| Males | Females | |||||||||||||
|---|---|---|---|---|---|---|---|---|---|---|---|---|---|---|
| 20–29 | 30–39 | 40–49 | 50–59 | 60–69 | 70–79 | 80+ | 20–29 | 30–39 | 40–49 | 50–59 | 60–69 | 70–79 | 80+ | |
| N | 680 | 702 | 688 | 679 | 721 | 426 | 254 | 691 | 754 | 805 | 779 | 764 | 454 | 278 |
| Mean (SEM) | ||||||||||||||
| Age (years) | 24.5 (0.19) | 34.3 (0.12) | 44.5 (0.16) | 54.6 (0.15) | 64.1 (0.13) | 73.9 (0.14) | 80.0 * (0.0) | 24.3 (0.19) | 34.5 (0.12) | 44.7 (0.11) | 54.3 (0.13) | 64.1 (0.14) | 73.7 (0.15) | 80.0 * (0.0) |
| MIMS-units/d | 14039 (185.4) | 14168 (134.4) | 13805 (184.3) | 12935 (181.9) | 11725 (152.5) | 10124 (179.7) | 8660 (182.3) | 14478 (124.4) | 15082 (166.6) | 14541 (163.9) | 14161 (209.5) | 13194 (170.3) | 11287 (162.0) | 9284 (238.2) |
| Wake Wear (min/d) | 910.0 (5.8) | 923.6 (4.6) | 919.3 (4.1) | 907.2 (6.5) | 869.6 (6.6) | 835.8 (6.1) | 797.3 (9.4) | 898.0 (4.4) | 923.0 (3.8) | 920.0 (4.0) | 915.5 (4.7) | 899.3 (5.1) | 863.8 (4.7) | 800.3 (10.0) |
| Non-Wear (min/d) | 2.4 (0.5) | 1.0 (0.2) | 1.2 (0.2) | 1.1 (0.2) | 0.9 (0.3) | 0.5 (0.2) | 0.5 (0.2) | 1.6 (0.2) | 1.6 (0.2) | 1.5 (0.2) | 1.0 (0.2) | 1.3 (0.2) | 0.5 (0.1) | 1.0 (0.3) |
| Sleep Wear (min/d) | 465.0 (5.1) | 452.4 (4.4) | 454.9 (3.5) | 465.6 (6.0) | 499.2 (6.5) | 529.4 (5.6) | 566.9 (8.7) | 488.3 (4.4) | 464.8 (3.5) | 465.8 (3.4) | 469.7 (4.3) | 482.3 (4.4) | 513.2 (3.9) | 571.9 (9.5) |
| Unknown (min/d) | 62.6 (0.9) | 63.1 (0.8) | 64.6 (1.0) | 66.1 (0.9) | 70.3 (1.1) | 74.3 (1.1) | 75.3 (1.5) | 52.2 (0.6) | 50.6 (0.7) | 52.6 (0.9) | 53.8 (1.1) | 57.1 (1.0) | 62.5 (1.5) | 66.8 (1.4) |
| Valid days | 4.7 (0.1) | 5.0 (0.1) | 5.2 (0.1) | 5.5 (0.1) | 5.7 (0.1) | 6.1 (0.1) | 6.3 (0.1) | 5.1 (0.1) | 5.2 (0.1) | 5.5 (0.1) | 5.8 (0.1) | 5.9 (0.1) | 5.9 (0.1) | 6.0 (0.1) |
Abbreviations: d, day; MIMS, Monitor-Independent Movement Summary; min, minutes; SEM, Standard Error of Mean
NOTE:
For 80 years and older, age top-coded at 80; Unknown = valid minutes the MIMS algorithm was unable to categorize as wake, sleep, or non-wear.
Tables 1 and 2 show that in general, females recorded higher mean levels of activity than males and activity declined with age. Average minutes of wake wear was similar for both sexes and varied with age, with lowest wake wear seen in adults aged 80+ years. For demographics and percentile values please see supplemental tables 1–5 (see Tables, Supplemental Digital Content 3, Appendix—Supplemental Tables).
Youth Activity Percentiles (3–19 years old)
Figures 2 and 3 display the age- and sex- specific average MIMS-unit/d activity percentiles for youth ages 3–19 years. The median daily MIMS-units for both sexes peaked at age 6 years (males: 20,613; females: 20,706) and were lowest at age 17 for males (13,250 MIMS-units/d) and age 18 for females (14,186 MIMS-units/d). Upon inspection, the difference in activity between the peak and lowest values was greater for males than females (7,363 vs. 6,250 MIMS-units/d). In general, at lower percentiles (<50th), females ages 6–19 years accumulated higher MIMS-unit values than males. At the highest percentile, males accumulated higher MIMS-unit values than females for all ages except at ages 3 and 15–17 years. Conversely, at the lowest percentile, females accumulated higher MIMS-unit activity values than males, except at ages 3–5 years. MIMS-unit activity values generally increased in both sexes from ages 3 to 6 years, and then declined from 6 to 17–18 years when they began to rise again, particularly for males at the higher percentiles.
Figure 2:
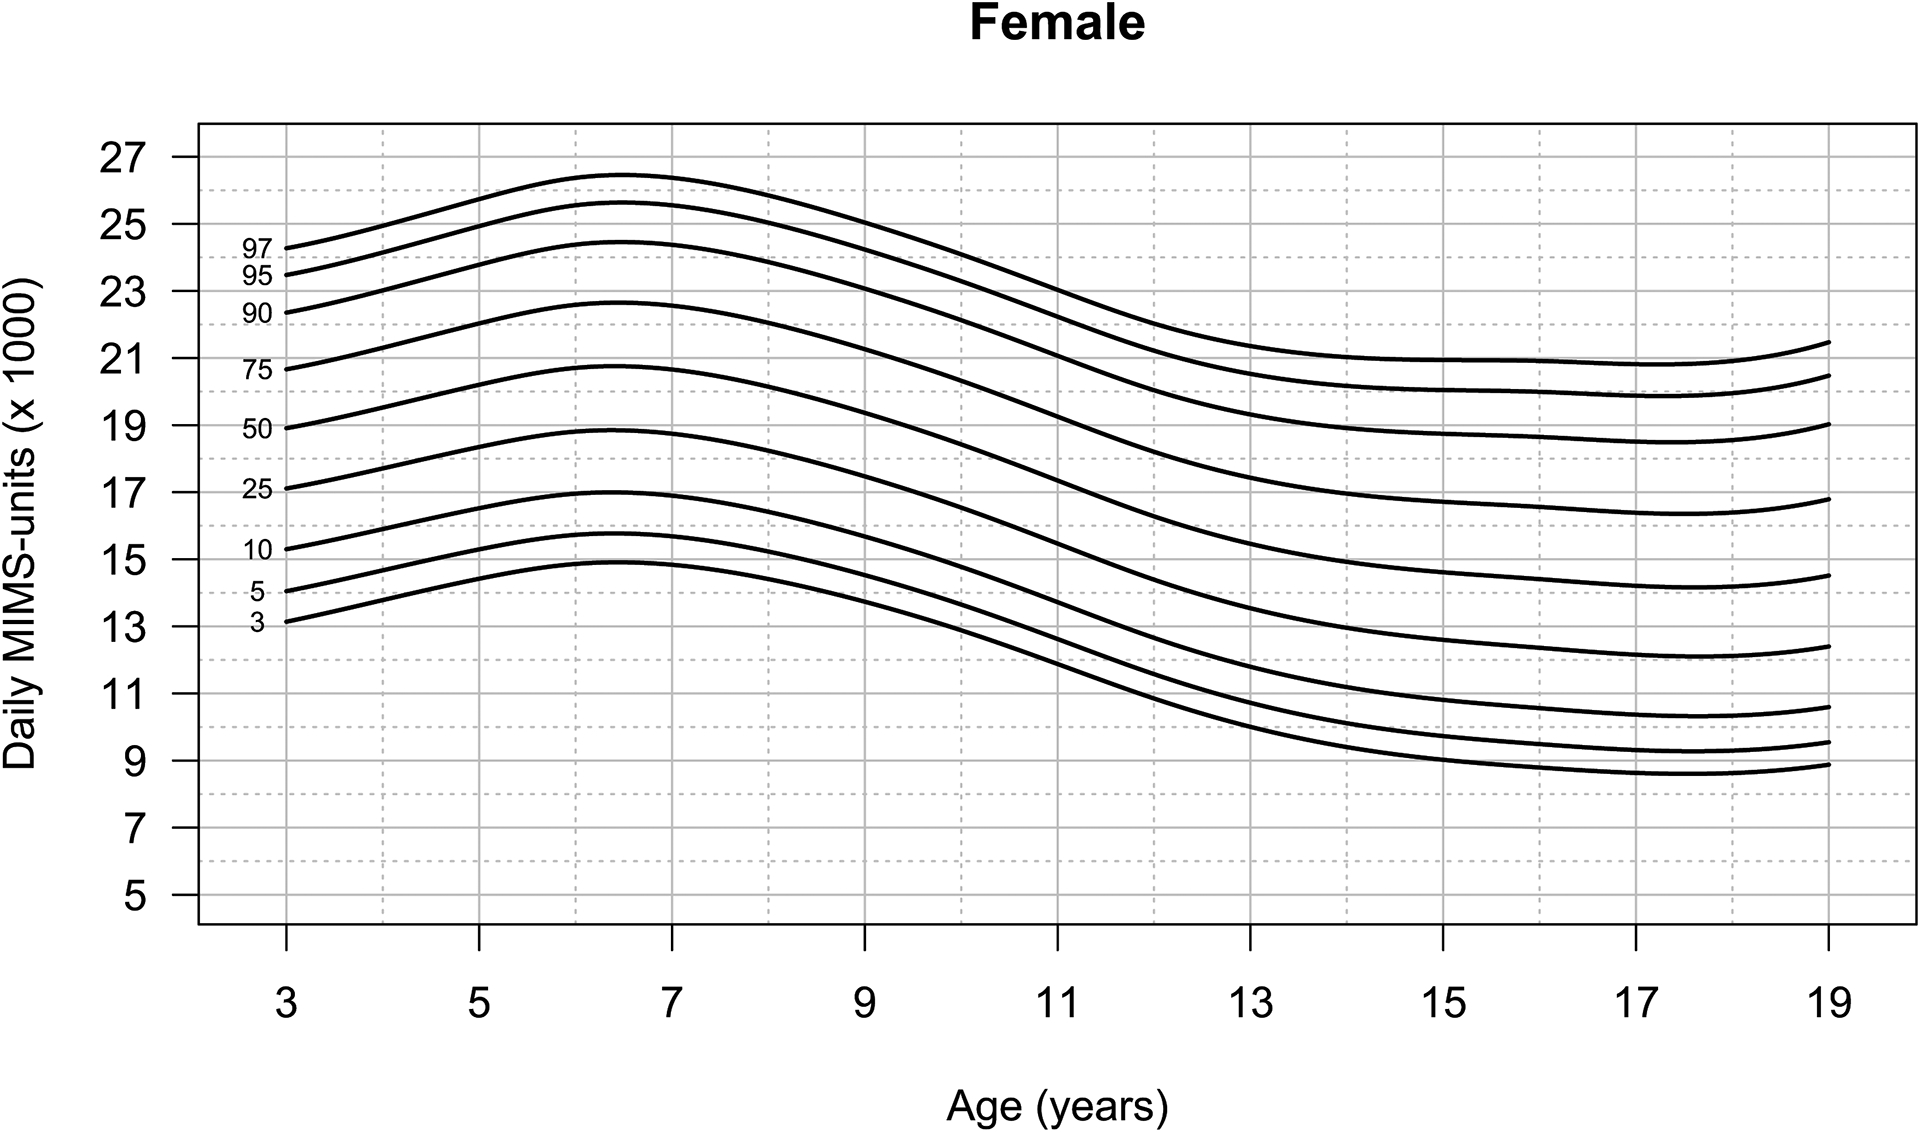
Percentiles of daily wrist-worn MIMS-unit activity for U.S. females, ages 3–19
Figure 3:
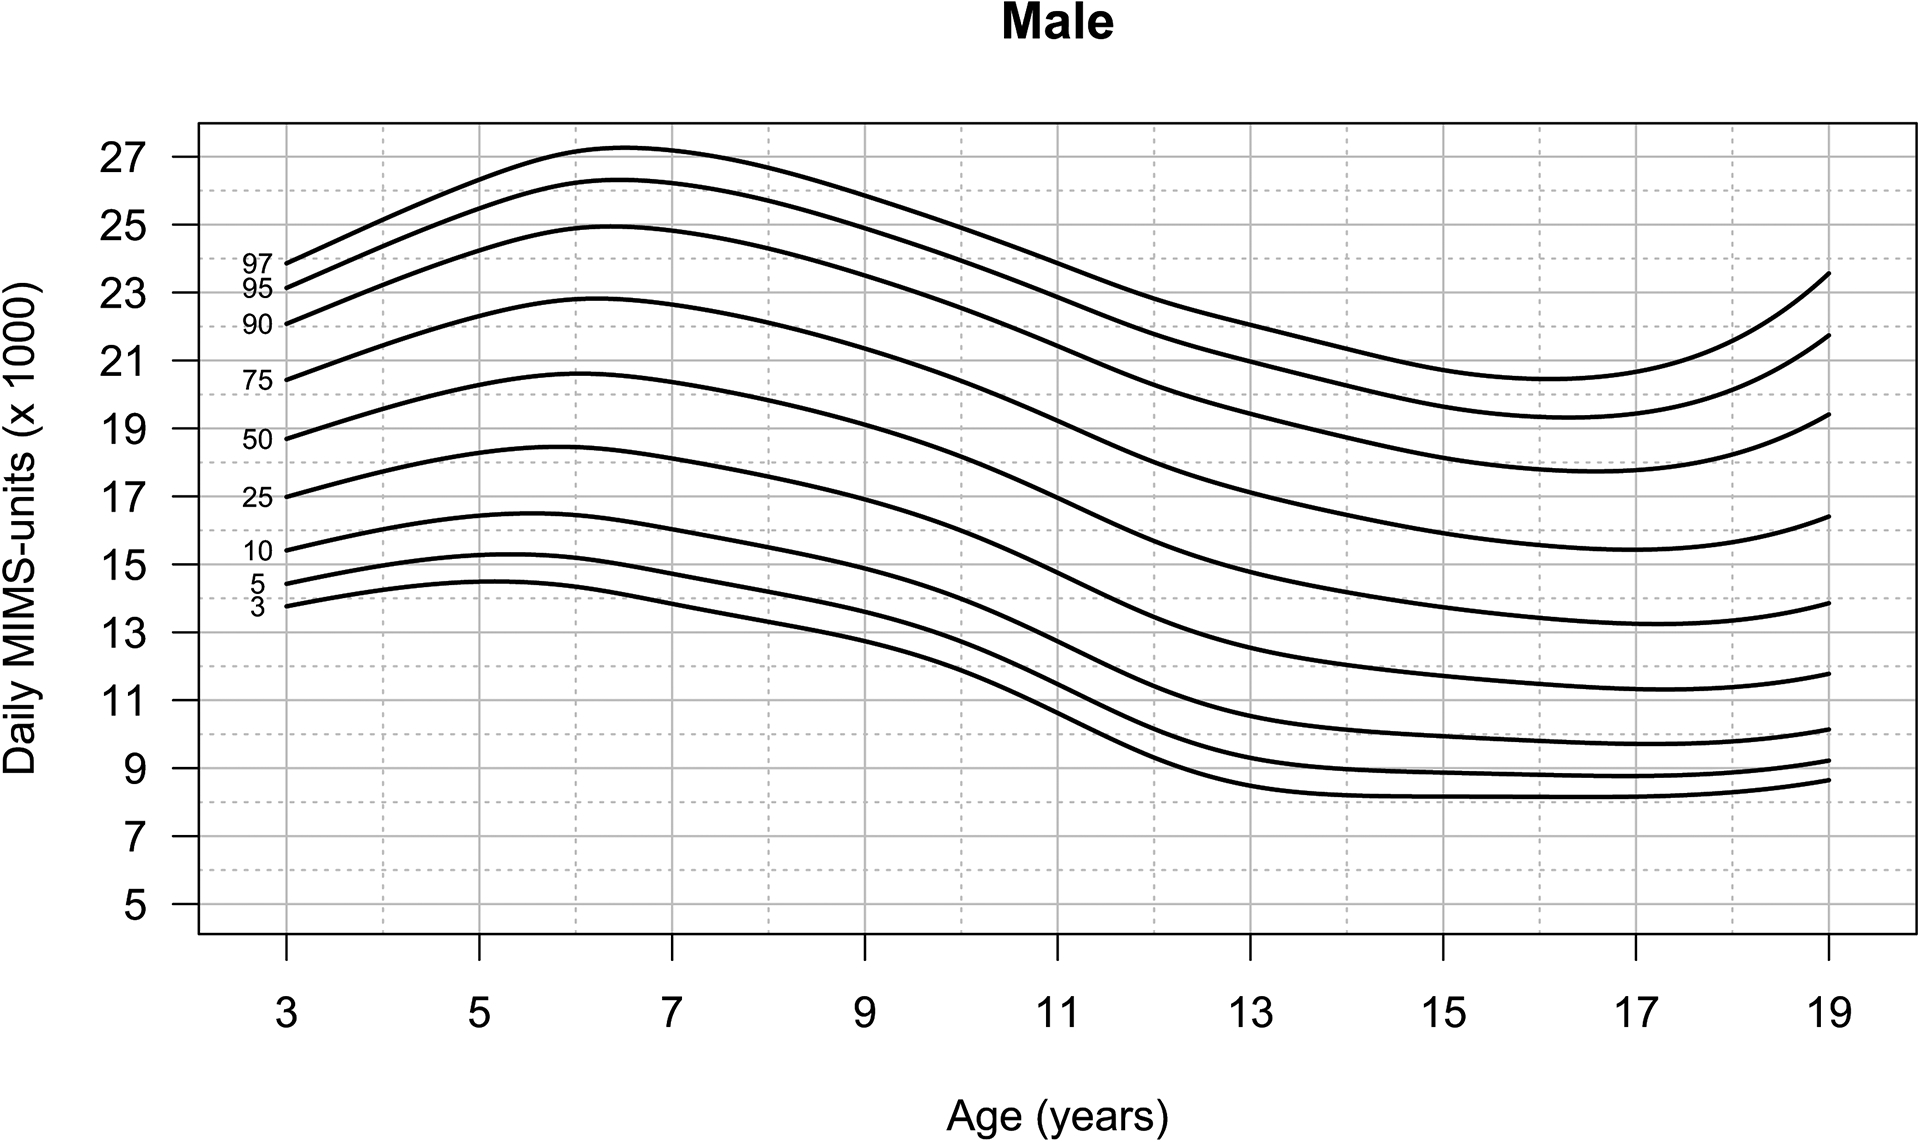
Percentiles of daily wrist-worn MIMS-unit activity for U.S. males, ages 3–19
Adult Activity Percentiles (20–80+ years old)
Age- and sex- specific percentiles for adults 20+ years of age are presented in Figures 4 and 5. Median activity levels peaked at age 20 (13,968 MIMS-units/d) for males and at age 36 (14,788 MIMS-units/d) for females (Figure 3). The percentile curves indicate activity levels were lowest at age 80+ for both sexes (males: 8,799, females: 9,503 MIMS-units/d). Adult MIMS-unit activity percentiles were higher in females than males regardless of age, except in individuals ages 79–80+ years in the 3rd and 5th percentiles, and ages 20 to 22-years in the 75th and 90th percentiles. At the higher percentiles, both males and females had an increase in MIMS-units from ages 20 to 37–38 years of age, followed by an age-related decline in activity.
Figure 4:
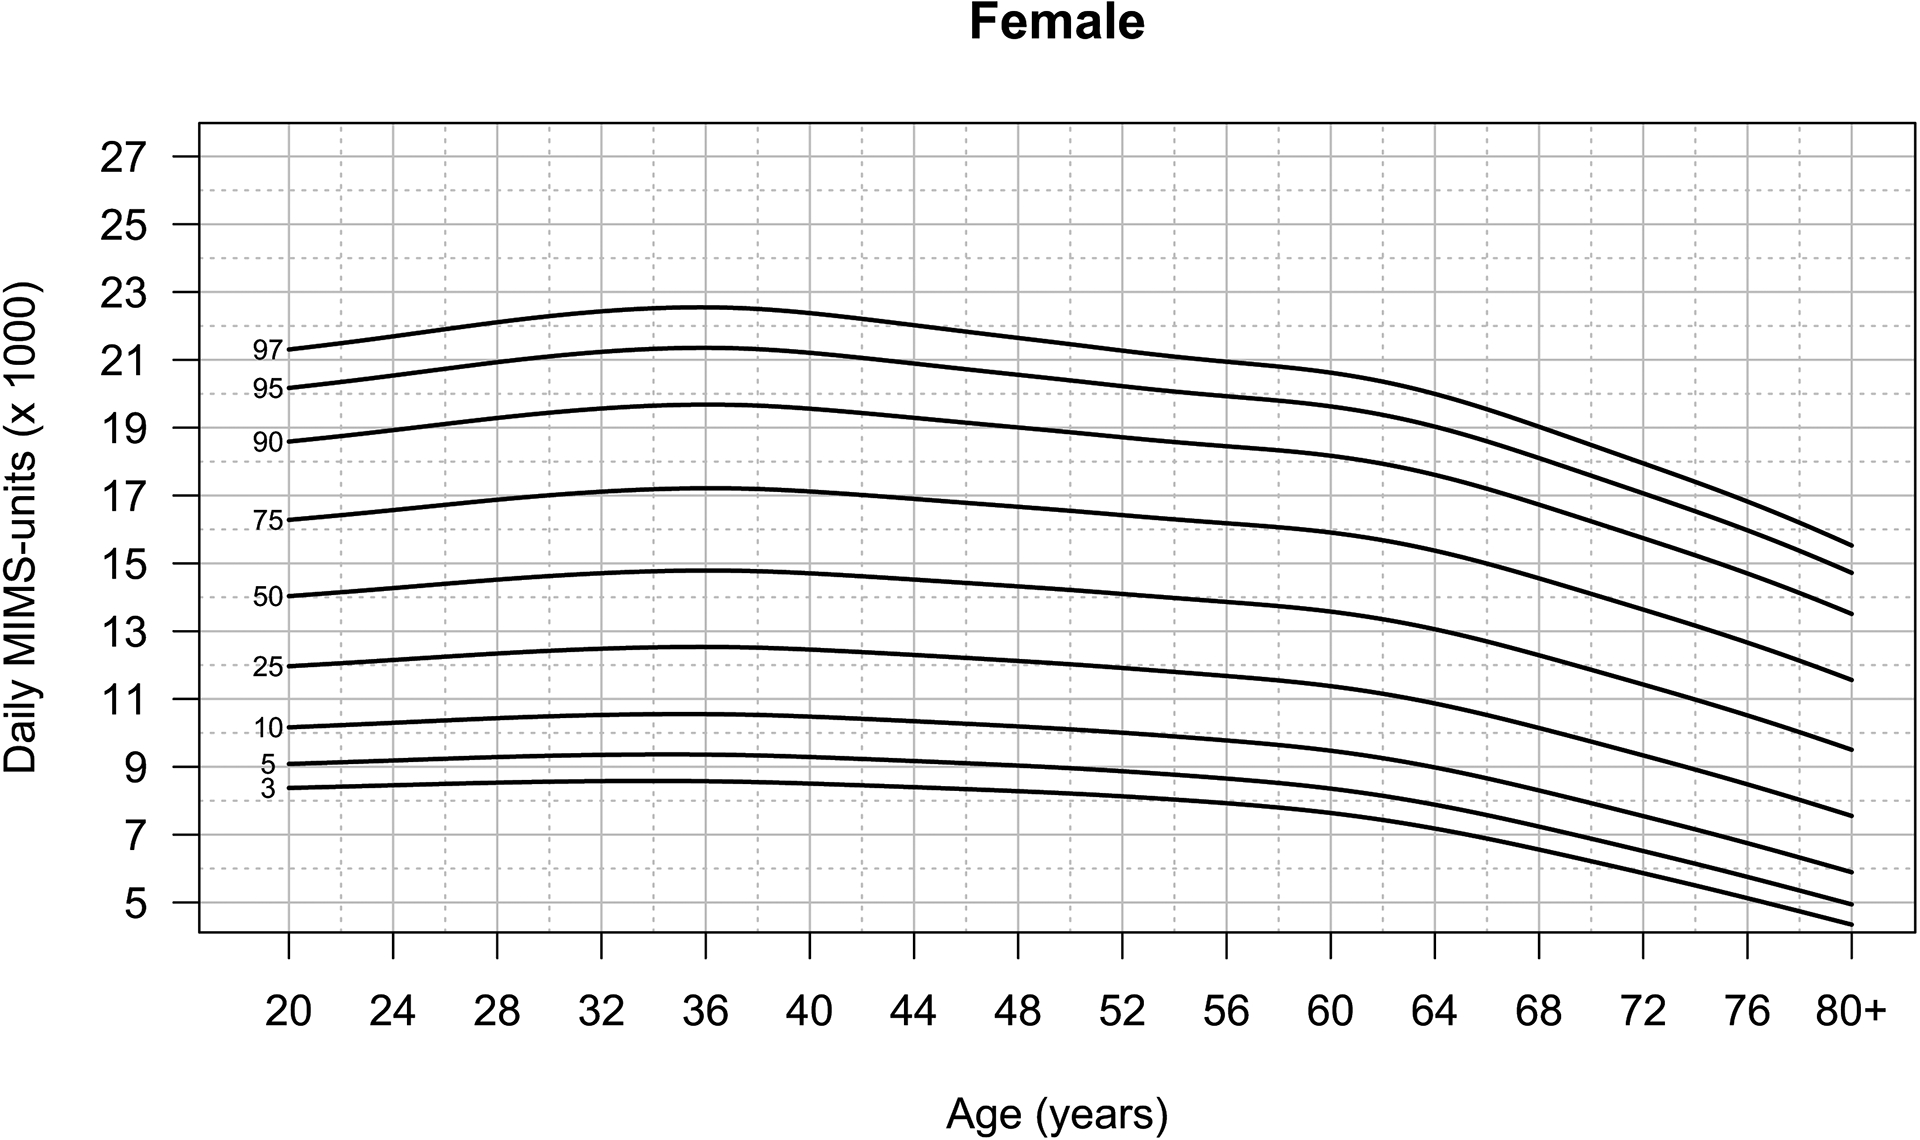
Percentiles of daily wrist-worn MIMS-unit activity for U.S. females, ages 20+
Figure 5:
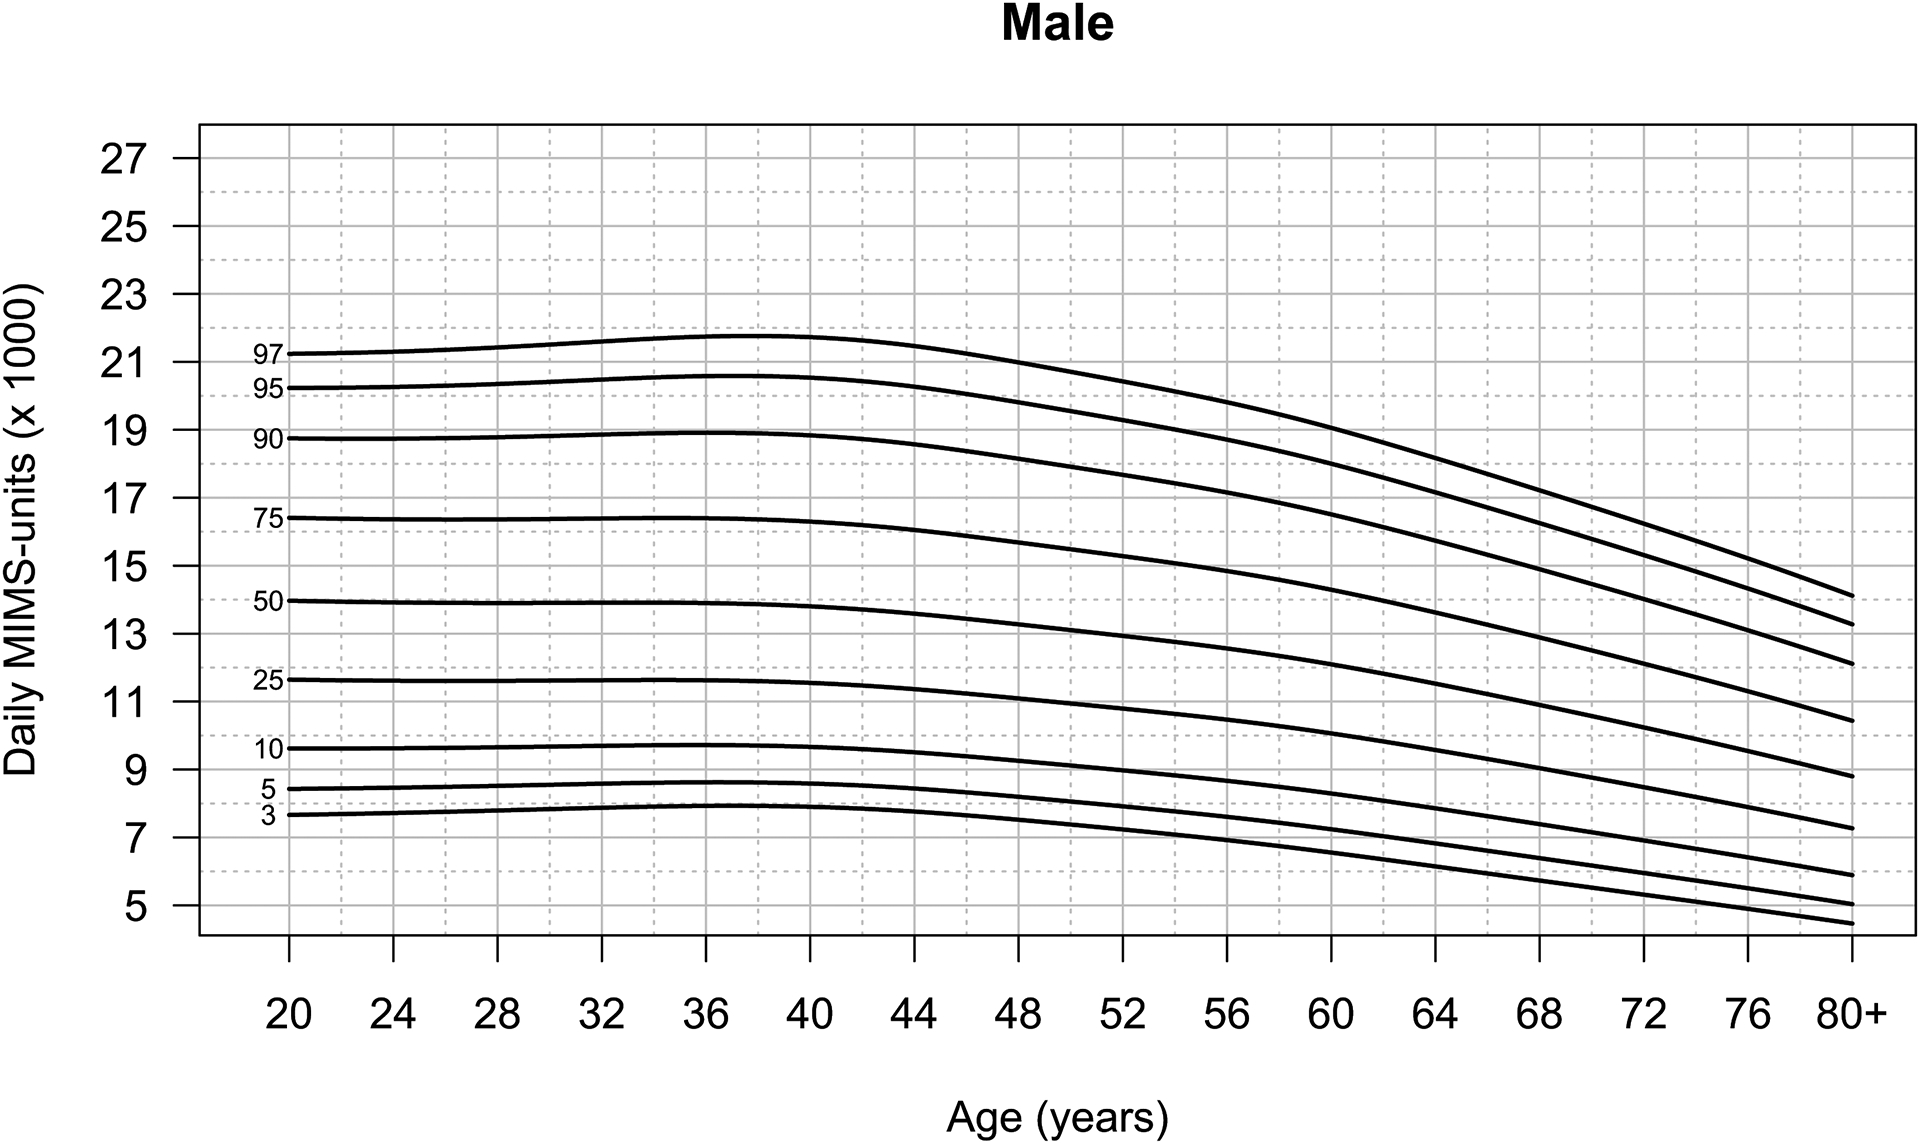
Percentiles of daily wrist-worn MIMS-unit activity for U.S. males, ages 20+
DISCUSSION
This study is the first to report population-reference data for wrist-worn accelerometer data in a nationally representative sample of U.S. youth and adults. Presenting reference data in MIMS-units provides researchers with a measure of total movement that can be applied across a variety of wrist-worn accelerometer devices. This study is particularly timely given the emerging popularity of deploying wrist-worn devices to assess activity behaviors and the growing consensus that a standardized measure is needed to compare findings across studies (2). A device-agnostic measure of activity volume such as MIMS-units may also be important for identifying disparities in activity that require intervention as well as assessing compliance with current physical activity guidelines that recognize the health benefits of light intensity physical activity and encourage moving more and sitting less.
The results of this study are consistent with previous research indicating activity estimates derived from wrist-worn devices are higher in females compared to males (32) and age-related declines are seen in youth and adults. One previous population-based study found that women had higher daily vector magnitude counts/minute than men from ages 25–65 years, whereafter women had non-statistically significantly higher activity levels (33). These findings are mirrored in a Brazilian birth cohort study (34) and by the UK Biobank study, which found that women had higher activity levels than men except at ages 45–54 years (32). One explanation for these sex differences in adults is that the placement of the accelerometer may better capture movements specific to the wrist and upper body such as household activities, which women engage in more frequently than men (35). The population-referenced percentiles of accelerometer-derived MIMS-unit activity in the present study are similar in shape to the total activity counts per day (TAC/d) percentiles produced using the 2003–2006 NHANES accelerometer data (16, 17). This finding is noteworthy given that the percentiles generated in these papers used data collected almost a decade apart and assessed activity using different Actigraph devices worn at different body locations (i.e., hip and wrist). The studies also implemented distinct measures of activity: TAC/d and MIMS-units.
There are a couple notable exceptions to the similarities drawn between the current wrist-based percentiles and prior curves generated using data from hip-mounted devices. First, the sex differences found in this study directly contrast with previous findings from hip-worn device studies indicating males have higher levels of activity than females across the life course (36–39). Specifically, our results indicate no sex difference in activity from 3 – 5 years with consistently higher activity in females starting at age six. However, wrist-worn accelerometers capture upper limb movement that is influenced by the ongoing development of visual-motor coordination in both males and females (40). Upper limb movement becomes faster and straighter with age (41), and may contribute to the sex-independent increases MIMS-units from 3–5 years old in both sexes across all percentiles. Second, the present analysis indicates an increase in activity at age18 years in males at the highest percentiles, which was not seen in the hip-mounted data. One study reported a slight increase in MVPA in males ages 16–17 years (36), suggesting there may be an increase in activity during the adolescent-young adult transition. We also note that there is more variability in estimates of the highest percentiles, and similar to linear regression, smoothing is more variable near the boundaries of the “x” values.
The creation of percentile curves from the nationally representative NHANES and NNYFS data has several advantages. Overall levels of activity can be expressed relative to others of the same age and sex in the U.S., thus allowing researchers to compare activity levels in their sample with a national reference. It’s important to note that prior data indicate that there are race/ethnic differences in physical activity levels (42). However, we chose to create percentile curves that included all race/ethnic groups as environmental, cultural and other factors may explain differences in activity levels (43–45). Prior research indicates that population-referenced activity percentiles are an effective tool for public health monitoring and surveillance to identify disparities in activity levels (46), supporting the presentation of percentiles including all race-ethnic groups combined. Another advantage is that percentiles show changes in activity with age, and may have clinical utility similar to the body mass index percentile curves for children (47). For example, a clinician could ask their patient to wear a wrist accelerometer for one week, and then show them where they fall on the curves for their age and sex. This may provide an opportunity to increase patient knowledge about their activity levels and prompt behavior change. Additionally, these are the first percentile reference curves that include young children. Understanding activity levels in comparison to national reference curves could offer the opportunity for early intervention to prevent chronic diseases such as obesity.
MIMS-units provide several advantages for the creation of percentile curves. One advantage is that they give an estimate of overall physical movement using a non-proprietary metric. As a standardized metric, use of MIMS-units can advance PA assessment by allowing comparisons across studies and wrist-worn accelerometer devices. Furthermore, the ability of the MIMS-unit algorithm to process accelerometer data across a large range of sampling rates (i.e., ≥ 20 Hz) and dynamic ranges (≥ 1 g) makes it well suited for use in surveillance. However, MIMS-units can only be computed from raw acceleration data and therefore metrics from some proprietary devices that do not allow access to raw data (e.g., Apple watches) cannot be standardized. The inclusion of MIMS-units in a nationally representative dataset is also a strength as it will enable researchers to compare their findings to a national reference. Researchers need to be aware that MIMS-units are not comparable to the Actigraph count metrics used in NHANES 2003–2006. Furthermore, intensity criteria thresholds for Actigraph or other proprietary count metrics cannot be applied to MIMS-units.
The NHANES accelerometer data include predicted classification of time at the minute-level as non-wear, wake-wear, and sleep-wear. We used both non-wear and sleep-wear estimates in our inclusion criteria. These classification estimates are valuable and have good face-validity based on their distributions in the data, but they must be treated with caution. The algorithms were developed and tested on small data sets that did not capture the full breadth of the population included in NHANES (22). Misclassification between non-wear and sleep was also a concern, which led to our exclusion of participants with sleep duration of more than 17 hours per day, based on a natural break in the distribution.
An additional strength of this study was the high level of compliance obtained with wrist-wear. Data were available from 79% of participants, who averaged 4.2 – 6.3 days of wear and an average wear time of over 18.5 hours/day. In NHANES 2003–2006, compliance was lower, with only 68% of participants having 4 days of 10+ hour wear and mean wear time of 13.7–14.5 hours/day, which varied greatly by age (8).
Study limitations include the lack of comparability to waist-worn accelerometer data, and to populations outside of the U.S. However, the development of percentile curves using MIMS-units may encourage developers to create ways to extract raw data that can be used by health care practitioners and individuals to better understand their activity levels in relation to the national population. It is yet unknown how well MIMS-units will predict energy expenditure and to date there are no verified thresholds to allow the measures to be converted to time spent in different activity intensity categories that have been shown to be important for health outcomes. However, these analyses provide a first step towards the use of a standardized metric to describe activity behaviors in a nationally representative population.
In conclusion, this paper describes the development of national percentile distribution reference curves for activity in the U.S. population based on a standardized, device-agnostic, and non-proprietary metric. These reference data allow researchers to assess activity levels in their sample using wrist-worn accelerometer devices. Future work is needed to determine how MIMS-units and movement along the percentile curves relate to time spent in activity intensities and health outcomes.
Supplementary Material
Supplemental Digital Content 1: R code for youth percentile generation using GAMLSS
Supplemental Digital Content 2: R code for adult percentile generation using GAMLSS
Supplemental Digital Content 3: Appendix—Supplemental Tables
Table S1: Demographic Characteristics of the Analyzed Sample
Table S2: Percentiles for MIMS-unit Activity in U.S. Male Youth Ages 3–19 (n = 2,976).
Table S3: Percentiles for MIMS-unit Activity in U.S. Female Youth Ages 3–19 (n = 3,054).
Table S4: Percentiles for MIMS-unit Activity in U.S. Adult Males Ages 20+ (n = 4,150).
Table S5: Percentiles for MIMS-unit Activity in U.S. Adult Females Ages 20+ (n = 4,525).
Acknowledgements
This study was not supported by external funding. We are grateful for the participants of NHANES and NNYFS and the support of programmers and other colleagues at NCHS, who facilitated the inclusion of the protected data for these analyses.
Footnotes
Conflicts of Interest
The authors declare no conflict of interests, including financial interests or affiliations. The National Institutes of Health reviewed and approved this article before submission. The results of this study are presented clearly, honestly, and without fabrication, falsification, or inappropriate data manipulation. The results of the present study do not constitute endorsement by the American College of Sports Medicine.
REFERENCES
- 1.Bassett DR, Troiano RP, McClain JJ, Wolff DL. Accelerometer-based physical activity: total volume per day and standardized measures. Med Sci Sports Exerc. 2015;47(4):833–8. [DOI] [PubMed] [Google Scholar]
- 2.Troiano RP, McClain JJ, Brychta RJ, Chen KY. Evolution of accelerometer methods for physical activity research. Br J Sports Med. 2014;48(13):1019–23. [DOI] [PMC free article] [PubMed] [Google Scholar]
- 3.Saint-Maurice PF, Troiano RP, Bassett DR, et al. Association of daily step count and step intensity with mortality among US adults. JAMA. 2020;323(12):1151–60. [DOI] [PMC free article] [PubMed] [Google Scholar]
- 4.Saint-Maurice PF, Troiano RP, Berrigan D, Kraus WE, Matthews CE. Volume of light versus moderate-to-vigorous physical activity: similar benefits for all-cause mortality? J Am Heart Assoc. 2018;7(7):e008815. [DOI] [PMC free article] [PubMed] [Google Scholar]
- 5.Thraen-Borowski KM, Gennuso KP, Cadmus-Bertram L. Accelerometer-derived physical activity and sedentary time by cancer type in the United States. PloS one. 2017;12(8):e0182554. [DOI] [PMC free article] [PubMed] [Google Scholar]
- 6.Wolff-Hughes DL, Fitzhugh EC, Bassett DR, Churilla JR. Total activity counts and bouted minutes of moderate-to-vigorous physical activity: relationships with cardiometabolic biomarkers using 2003–2006 NHANES. J Phys Act Health. 2015;12(5):694–700. [DOI] [PubMed] [Google Scholar]
- 7.Belcher BR, Moser RP, Dodd KW, Atienza A, Ballard-Barbash R, Berrigan D. Self-reported versus accelerometer-measured physical activity and biomarkers among NHANES youth. J Phys Act Health 2015;12(5):708. [DOI] [PubMed] [Google Scholar]
- 8.Troiano RP, Berrigan D, Dodd KW, Masse LC, Tilert T, McDowell M. Physical activity in the United States measured by accelerometer. Med Sci Sports Exerc. 2008;40(1):181–8. [DOI] [PubMed] [Google Scholar]
- 9.McLellan G, Arthur R, Buchan DS. Wear compliance, sedentary behaviour and activity in free-living children from hip-and wrist-mounted ActiGraph GT3X+ accelerometers. J Sports Sci. 2018;36(21):2424–30. [DOI] [PubMed] [Google Scholar]
- 10.Huberty J, Ehlers DK, Kurka J, Ainsworth B, Buman M. Feasibility of three wearable sensors for 24 hour monitoring in middle-aged women. BMC Women’s Health. 2015;15(1):55. [DOI] [PMC free article] [PubMed] [Google Scholar]
- 11.Rowlands AV. Moving forward with accelerometer-assessed physical activity: two strategies to ensure meaningful, interpretable, and comparable measures. Pediatr Exerc Sci. 2018;30(4):450. [DOI] [PubMed] [Google Scholar]
- 12.Rowlands AV, Mirkes EM, Yates T et al. Accelerometer-assessed physical activity in epidemiology: are monitors equivalent? Med Sci Sports Exerc. 2018;50(2):257–65. [DOI] [PubMed] [Google Scholar]
- 13.Fekedulegn D, Andrew ME, Shi M, Violanti JM, Knox S, Innes KE. Actigraphy-based assessment of sleep parameters. Ann Work Expo Health. 2020;64(4):350–67. [DOI] [PMC free article] [PubMed] [Google Scholar]
- 14.Migueles JH, Cadenas-Sanchez C, Ekelund U et al. Accelerometer data collection and processing criteria to assess physical activity and other outcomes: a systematic review and practical considerations. Sports Med. 2017;47(9):1821–45. [DOI] [PMC free article] [PubMed] [Google Scholar]
- 15.John D, Tang Q, Albinali F, Intille S. An open-source monitor-independent movement summary for accelerometer data processing. J Measurement of Phys Behav. 2019;2(4):268–81. [DOI] [PMC free article] [PubMed] [Google Scholar]
- 16.Wolff DL, Fitzhugh EC, Bassett DR, Churilla JR. Waist-worn actigraphy: population-referenced percentiles for total activity counts in US adults. J Phys Act Health. 2015;12(4):447–53. [DOI] [PubMed] [Google Scholar]
- 17.Wolff-Hughes DL, Bassett DR, Fitzhugh EC. Population-Referenced Percentiles for Waist-Worn Accelerometer-Derived Total Activity Counts in US Youth: 2003–2006 NHANES. PloS one. 2014;9(12):e115915. [DOI] [PMC free article] [PubMed] [Google Scholar]
- 18.Johnson CL, Dohrmann SM, Burt VL, Mohadjer LK. National Health and Nutrition Examination Survey: Sample Design, 2011–2014. Vital Health Stat 2. 2014;(162):1–33. [PubMed] [Google Scholar]
- 19.Borrud L, Chiappa MM, Burt VL et al. National Health and Nutrition Examination Survey: National Youth Fitness Survey Plan, Operations, and Analysis, 2012. Vital Health Stat 2. 2014;(163):1–24. [PubMed] [Google Scholar]
- 20.National Center for Health Statistics. National Health and Nutrition Examination Survey (NHANES) Physical Activity Monitor (PAM) Procedures Manual. Hyattsville (MD): Centers for Disease Control and Prevention; [cited 2021 February 1]. Available from: https://www.cdc.gov/nchs/data/nhanes/nhanes_11_12/Physical_Activity_Monitor_Manual.pdf. [Google Scholar]
- 21.National Center for Health Statistics. National Health and Nutrition Examination Survey, National Youth Fitness Survey (NYFS), Physical Activity Monitor (PAM) Procedures Manual. Hyattsville, MD: Centers for Disease Control and Prevention; [cited 2021 February 1]. Available from:. https://www.cdc.gov/nchs/data/nnyfs/Physical_Activity_Monitor.pdf. [Google Scholar]
- 22.National Center for Health Statistics. National Health and Nutrition Examination Survey: 2011–2012 Data Documentation, Codebook, and Frequencies Physical Activity Monitor - Day (PAXDAY_G). Centers for Disease Control and Prevention; [cited 2021 February 1]. Available from: https://wwwn.cdc.gov/Nchs/Nhanes/2011-2012/PAXDAY_G.htm. [Google Scholar]
- 23.Wolff-Hughes DL, McClain JJ, Dodd KW, Berrigan D, Troiano RP. Number of accelerometer monitoring days needed for stable group-level estimates of activity. Physiol Meas. 2016;37(9):1447–55. [DOI] [PubMed] [Google Scholar]
- 24.Chen TC, Parker JD, Clark J, Shin HC, Rammon JR, Burt VL. National Health and Nutrition Examination Survey: Estimation Procedures, 2011–2014. Vital Health Stat 2. 2018;(177):1–26. [PubMed] [Google Scholar]
- 25.Rigby RA, Stasinopoulos DM. Generalized additive models for location, scale and shape. J R Stat Soc Ser C Appl Stat. 2005;54(3):507–54. [Google Scholar]
- 26.Stasinopoulos DM, Rigby RA. Generalized additive models for location scale and shape (GAMLSS) in R. J Stat Software. 2007;23(7):1–46. [Google Scholar]
- 27.Cole TJ, Green PJ. Smoothing reference centile curves: the LMS method and penalized likelihood. Stat Med. 1992;11(10):1305–19. [DOI] [PubMed] [Google Scholar]
- 28.Eilers PHC, Marx BD. Flexible smoothing with B-splines and penalties. Stat Sci. 1996;11(2):89–121. [Google Scholar]
- 29.Cole TJ, Stanojevic S, Stocks J, Coates AL, Hankinson JL, Wade AM. Age- and size-related reference ranges: a case study of spirometry through childhood and adulthood. Stat Med. 2009;28(5):880–98. [DOI] [PMC free article] [PubMed] [Google Scholar]
- 30.Pan H, Cole TJ. A comparison of goodness of fit tests for age-related reference ranges. Stat Med. 2004;23(11):1749–65. [DOI] [PubMed] [Google Scholar]
- 31.Koenker R, Portnoy S, Ng PT, Zeileis A, Grosjean P, Ripley BD. Package ‘quantreg’: Quantile Regression. [cited 2021 March 1]. Available from: https://cran.r-project.org/web/packages/quantreg/quantreg.pdf.
- 32.Doherty A, Jackson D, Hammerla N et al. Large scale population assessment of physical activity using wrist worn accelerometers: The UK Biobank Study. PloS one. 2017;12(2):e0169649. [DOI] [PMC free article] [PubMed] [Google Scholar]
- 33.Wennman H, Pietilä A, Rissanen H et al. Gender, age and socioeconomic variation in 24-hour physical activity by wrist-worn accelerometers: the FinHealth 2017 Survey. Sci Rep. 2019;9(1):6534. [DOI] [PMC free article] [PubMed] [Google Scholar]
- 34.da Silva IC, van Hees VT, Ramires VV et al. Physical activity levels in three Brazilian birth cohorts as assessed with raw triaxial wrist accelerometry. Int J Epidemiol. 2014;43(6):1959–68. [DOI] [PMC free article] [PubMed] [Google Scholar]
- 35.Picavet HS, Wendel-vos GC, Vreeken HL, Schuit AJ, Verschuren WM. How stable are physical activity habits among adults? The Doetinchem Cohort Study. Med Sci Sports Exerc. 2011;43(1):74–9. [DOI] [PubMed] [Google Scholar]
- 36.Steene-Johannessen J, Hansen BH, Dalene KE et al. Variations in accelerometry measured physical activity and sedentary time across Europe – harmonized analyses of 47,497 children and adolescents. Int J Behav Nutr Phy. 2020;17(1):38. [DOI] [PMC free article] [PubMed] [Google Scholar]
- 37.Cooper AR, Goodman A, Page AS et al. Objectively measured physical activity and sedentary time in youth: the International children’s accelerometry database (ICAD). Int J Behav Nutr Phys Act. 2015;12(1):113. [DOI] [PMC free article] [PubMed] [Google Scholar]
- 38.Konstabel K, Veidebaum T, Verbestel V et al. Objectively measured physical activity in European children: the IDEFICS study. Int J Obesity. 2014;38(2):S135–S43. [DOI] [PubMed] [Google Scholar]
- 39.Pfeiffer KA, Dowda M, McIver KL, Pate RR. Factors related to objectively measured physical activity in preschool children. Pediatr Exerc Sci. 2009;21(2):196–208. [DOI] [PMC free article] [PubMed] [Google Scholar]
- 40.Hay L Accuracy of children on an open-loop pointing task. Percept Mot Skills. 1978;47(3 Pt 2):1079–82. [DOI] [PubMed] [Google Scholar]
- 41.Simon-Martinez C, dos Santos GL, Jaspers E et al. Age-related changes in upper limb motion during typical development. PloS One. 2018;13(6):e0198524. [DOI] [PMC free article] [PubMed] [Google Scholar]
- 42.Belcher BR, Berrigan D, Dodd KW, Emken BA, Chou CP, Spruijt-Metz D. Physical activity in US youth: effect of race/ethnicity, age, gender, and weight status. Med Sci Sports Exerc. 2010;42(12):2211–21. [DOI] [PMC free article] [PubMed] [Google Scholar]
- 43.Bauman AE, Reis RS, Sallis JF, Wells JC, Loos RJF, Martin BW. Correlates of physical activity: why are some people physically active and others not? The Lancet. 2012;380(9838):258–71. [DOI] [PubMed] [Google Scholar]
- 44.Gordon-Larsen P, Nelson MC, Page P, Popkin BM. Inequality in the built environment underlies key health disparities in physical activity and obesity. J Pediatr. 2006;117(2):417–24. [DOI] [PubMed] [Google Scholar]
- 45.Hawes AM, Smith GS, McGinty E et al. Disentangling race, poverty, and place in disparities in physical activity. Int. J. Environ. Res. Public Health 2019;16(7):1193. [DOI] [PMC free article] [PubMed] [Google Scholar]
- 46.Wolff-Hughes DL, Troiano RP, Boyer WR, Fitzhugh EC, McClain JJ. Use of population-referenced total activity counts percentiles to assess and classify physical activity of population groups. Prev Med. 2016;87:35–40. [DOI] [PMC free article] [PubMed] [Google Scholar]
- 47.Kuczmarski RJ, Ogden CL, Guo SS et al. 2000 CDC growth charts for the United States: methods and development. Vital Health Stat 11. 2002;(246):1–190. [PubMed] [Google Scholar]
Associated Data
This section collects any data citations, data availability statements, or supplementary materials included in this article.
Supplementary Materials
Supplemental Digital Content 1: R code for youth percentile generation using GAMLSS
Supplemental Digital Content 2: R code for adult percentile generation using GAMLSS
Supplemental Digital Content 3: Appendix—Supplemental Tables
Table S1: Demographic Characteristics of the Analyzed Sample
Table S2: Percentiles for MIMS-unit Activity in U.S. Male Youth Ages 3–19 (n = 2,976).
Table S3: Percentiles for MIMS-unit Activity in U.S. Female Youth Ages 3–19 (n = 3,054).
Table S4: Percentiles for MIMS-unit Activity in U.S. Adult Males Ages 20+ (n = 4,150).
Table S5: Percentiles for MIMS-unit Activity in U.S. Adult Females Ages 20+ (n = 4,525).