

Abstract
Mitomycin C, (MC), an antitumor drug, is a DNA alkylating agent currently used in the clinics. Inert in its native form, MC is reduced to reactive mitosenes which undergo nucleophilic attack by guanine or adenine bases in DNA to form monoadducts as well as interstrand crosslinks (ICLs). Although ICLs are considered the most cytotoxic lesions, the role of each individual adduct in the drug’s cytotoxicity is still not fully understood. Synthetic routes have been developed to access modified oligonucleotides containing dG MC-monoadducts and dG-MC-dG ICL at a single position of their base sequences to investigate the biological effects of these adducts. However, until now, oligonucleotides containing monoadducts formed by MC at the adenine base had not been available, thus preventing the examination of the role played by these lesions in the toxicity of MC. Here, we present a route to access these substrates. Structural proof of the adducted oligonucleotides were provided by enzymatic digestion to nucleosides and high resolution mass spectral analysis. Additionally, parent oligonucleotides containing a dG monoadduct and a dG-MC-dG ICL were also produced. The stability and physical properties of all substrates were compared via CD spectroscopy and UV melting temperature studies. Finally, virtual models were created to explore the conformational space and structural features of these MC-DNA complexes.
Keywords: Deoxyadenosine adduct, Site-specific alkylation, Mitomycin C, Interstrand crosslink, Conformational studies
Graphical Abstract

A route to access modified oligonucleotides containing trans dA monoadducts produced from the reaction between mitomycin C and DNA is presented. Parent oligonucleotides containing a trans dG monoadduct and a trans dG-MC-dG ICL were also produced. The stability and spectral properties of all substrates were compared and virtual models were created to explore the conformational space and structural features of these MC-DNA complexes.
Introduction
Mitomycin C (MC) is an anti-cancer antibiotic whose mode of action is attributed to its ability to alkylate DNA. Although MC is inert in its native form, it is reduced enzymatically in vivo to reactive mitosenes.[1–4] These species undergo nucleophilic attack by the guanine[5–7] or adenine[8–10] bases in DNA to form monoadducts as well as interstrand crosslinks (ICLs) (Figure. 1: Adducts 1a, 1b, 2a, 2b are generated at N2 of dG; ICLs 3a and 3b are formed between opposing dG; adducts 4a and 4b are found at N6 of dA; adducts 5 and 6 result from the alkylation of DNA at dG by 2,7-diaminomitose (2,7-DAM), the major metabolite of MC). ICLs are considered the most cytotoxic lesions because, if not repaired, they prevent cell replication and may lead to mitotic catastrophe. [11] However, the role of each individual adduct in the drug’s cytotoxicity is still not fully understood.
Figure 1.
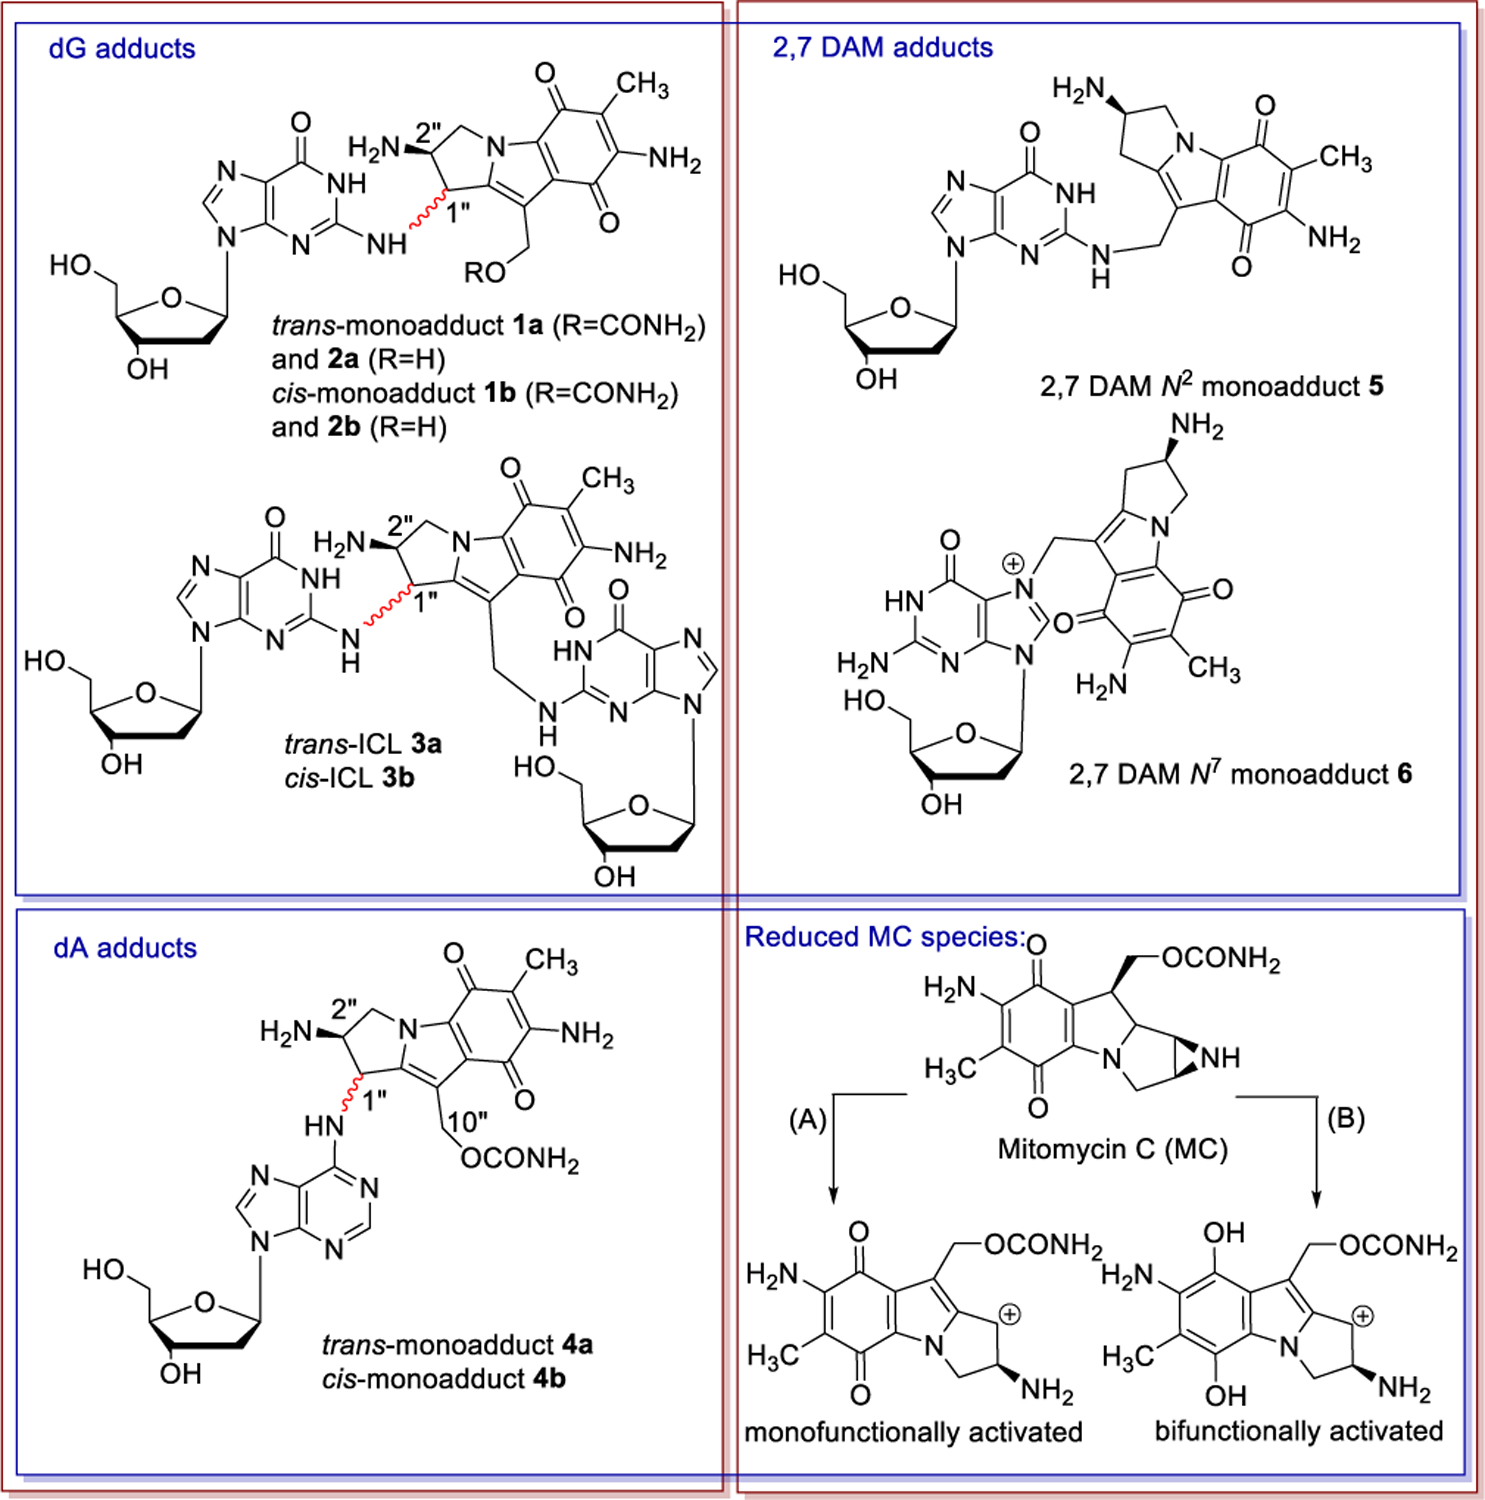
Monoadducts and ICLs generated by Mitomycin C in its reaction with DNA. (A): Monofunctional pathway (B): Bifunctional pathway.
Access to synthetic oligodeoxyribonucleotides bearing DNA adducts of alkylating agents is crucial to understand the biological processes governing these drugs’ activities. Such compounds provide substrates to study DNA damage signalling, sensing or repair mechanisms. [12–18] In the case of MC, synthetic routes have been developed to access modified oligonucleotides containing dG monoadducts 1a[19], 2b[20–22], 5[23] and 6[24] as well as ICLs 3a[25] and 3b[22] at a single position of their base sequences (Figure. 1). Typically, the syntheses involve the reaction between a chemically reduced mitomycin and a duplex oligonucleotide. The desired adduct can be obtained by carefully choosing the starting oligonucleotide substrate (i.e. the local sequence context) and the reductive activation pathway (monofunctional or bifunctional, scheme 1). In some cases, high resolution structures of such adducts have been elucidated; providing valuable information regarding the structure-activity relationship of these adducts.
Scheme 1.
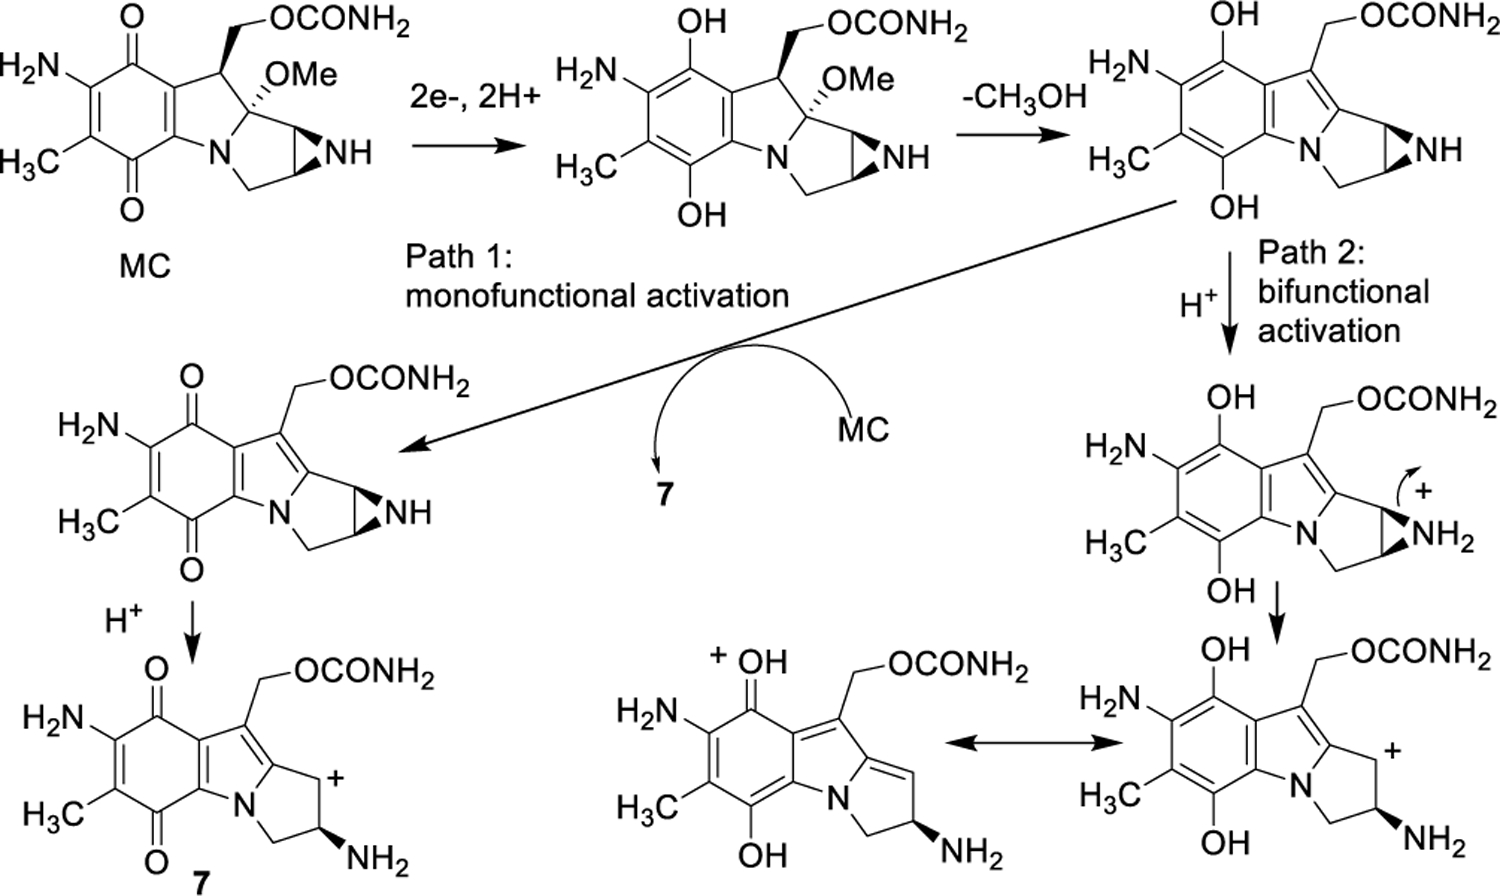
Reductive activation pathways of Mitomycin C.
For instance, a high-resolution NMR solution structure of the dG-N7-2,7-DAM adduct (6, Figure 1) in duplex DNA indicated that the drug moiety is not intercalated and lies in the major groove of a relatively unperturbed B-DNA structure.[24] In contrast, the MC moiety of the dG-N2-MC adduct (1a, Figure 1) lies tightly in the slightly widened minor groove of duplex B-DNA, with extensive noncovalent contacts between the mitosene and the minor groove of the DNA duplex.[26] These structural differences are consistent with translesion synthesis studies which showed efficient replication past 6 (Figure 1), whereas 1a (Figure 1) is a strong block of DNA synthesis.[27,28] A plausible rationale is that DNA adducts localized in the solvent-exposed major groove (as in the case of 6) are better tolerated than adducts located in the minor groove (such as 1a) which interact with the polymerase surface.[29]
However, information on the relationship between the structure of oligonucleotides containing dA monoadducts and their biological activity is lacking because access to these species had not been previously possible; although dA adducts 4a and 4b (Figure 1) have been synthesized and fully characterized at the nucleoside level.[8,9]
Our long-term objective is to synthesize oligonucleotides bearing MC monoadducts and ICLs to elucidate the role of the adducts’ structure and position within DNA in the drug biological activity. In particular, we want to understand if and how the stereochemical configuration at C1” of the adducts influences the cellular processing of these lesions: if C1” is (R), then adducts are trans (1a, 2a, 3a, and 4a, Figure 1) and if C1” is (S) then adducts are cis (1b, 2b, 3b and 4b, Figure 1). Consistent with this objective, we routinely synthesize ICLs and monoadducts produced by Mitomycin C. During the course of these endeavors, we noticed, that, under certain circumstances, oligonucleotides containing dA monoadduct 4a at a single site were formed in high yield. We describe, here, for the first time, the synthesis of such oligonucleotides on a scale which allowed their characterization. Structural proof of the oligonucleotides was obtained by enzymatic digestion to nucleosides and high-resolution mass spectra analyses. CD spectroscopy and UV melting temperature studies were performed and the properties of oligonucleotides containing trans 4a, trans 1a and trans ICL 3a were compared. Virtual models of the duplexes were created to explore the conformational space and the structural features of these substrates.
Results and Discussion
Synthesis of dA and dG alkylated oligonucleotides
Research on the alkylation of DNA by MC has shown that trans dG DNA adducts (1a) can be efficiently synthesized in double stranded DNA at CpG steps when 1) “monofunctional” activation conditions are used[30] and 2) the complementary strand contains a m5CpG step (the presence of a 5-methylcytosine at CpG steps increases the yield of alkylation on the opposite guanine).[31–33] Under these conditions, the prevalent reduced form of MC is the aziridinomitosene 7 (Scheme 1).30,34 This is achieved when the drug is reduced using sequential additions of sub-stoichiometric amounts of sodium dithionite or slow enzymatic reduction of MC. This typically results in high yield of dG monoalkyation on the desired (non m5C containing) oligonucleotide. Using the 25 mer 5’-TCCTCCTAATACGAATAATCCTCCT (8) and the methylated 5’-TTATT5meCGTATTA (9), we applied this methodology to access the dG monoalkylated 25 mer (10) (Figure 2).
Figure 2.
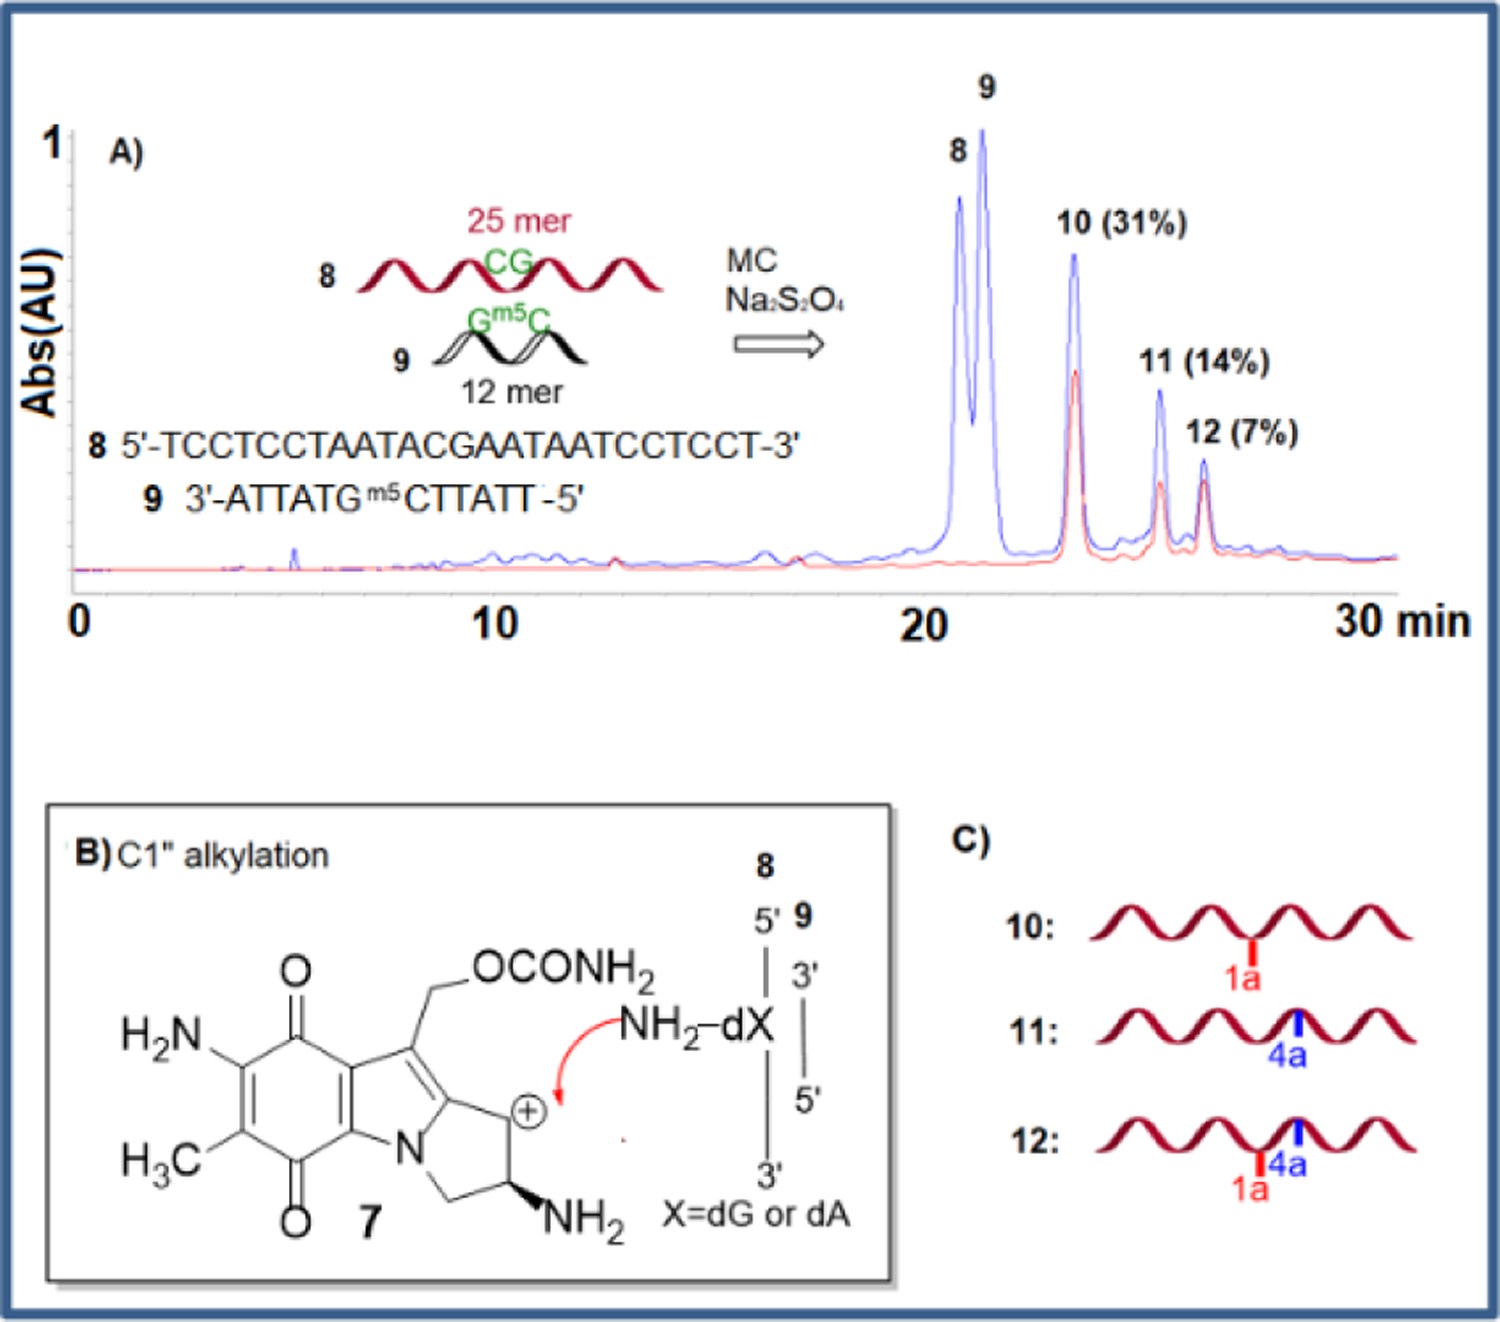
A) HPLC Chromatogram of the products from the reaction between MC and duplex (8).(9) under monofunctional activation. Blue line: Absorption at 260 nm, red line: Absorption at 320 nm. B) Alkylation mechanism. C) Oligonucleotides produced.
Unexpectedly, HPLC analysis of the reaction mixture revealed that in addition to 10, two other alkylated oligonucleotides were produced (11 and 12, Figure 2). Isolation of these oligonucleotides followed by enzymatic digestions to nucleosides and co-elution with authentic standards synthesized in our laboratory[8,9,35] was then performed to identify the alkylated nucleoside(s) present in the digests (Figure 3). These experiments confirmed the formation of dG monoadduct 1a in 10. Surprisingly, the enzymatic digests also showed the presence of dA monoadduct 4a in 11 and the formation of both 1a and 4a in 12. The site of dA alkylation in 11 and 12 and the structure of all oligonucleotides was further confirmed by mass and UV/CD spectroscopy -see below-.
Figure 3.
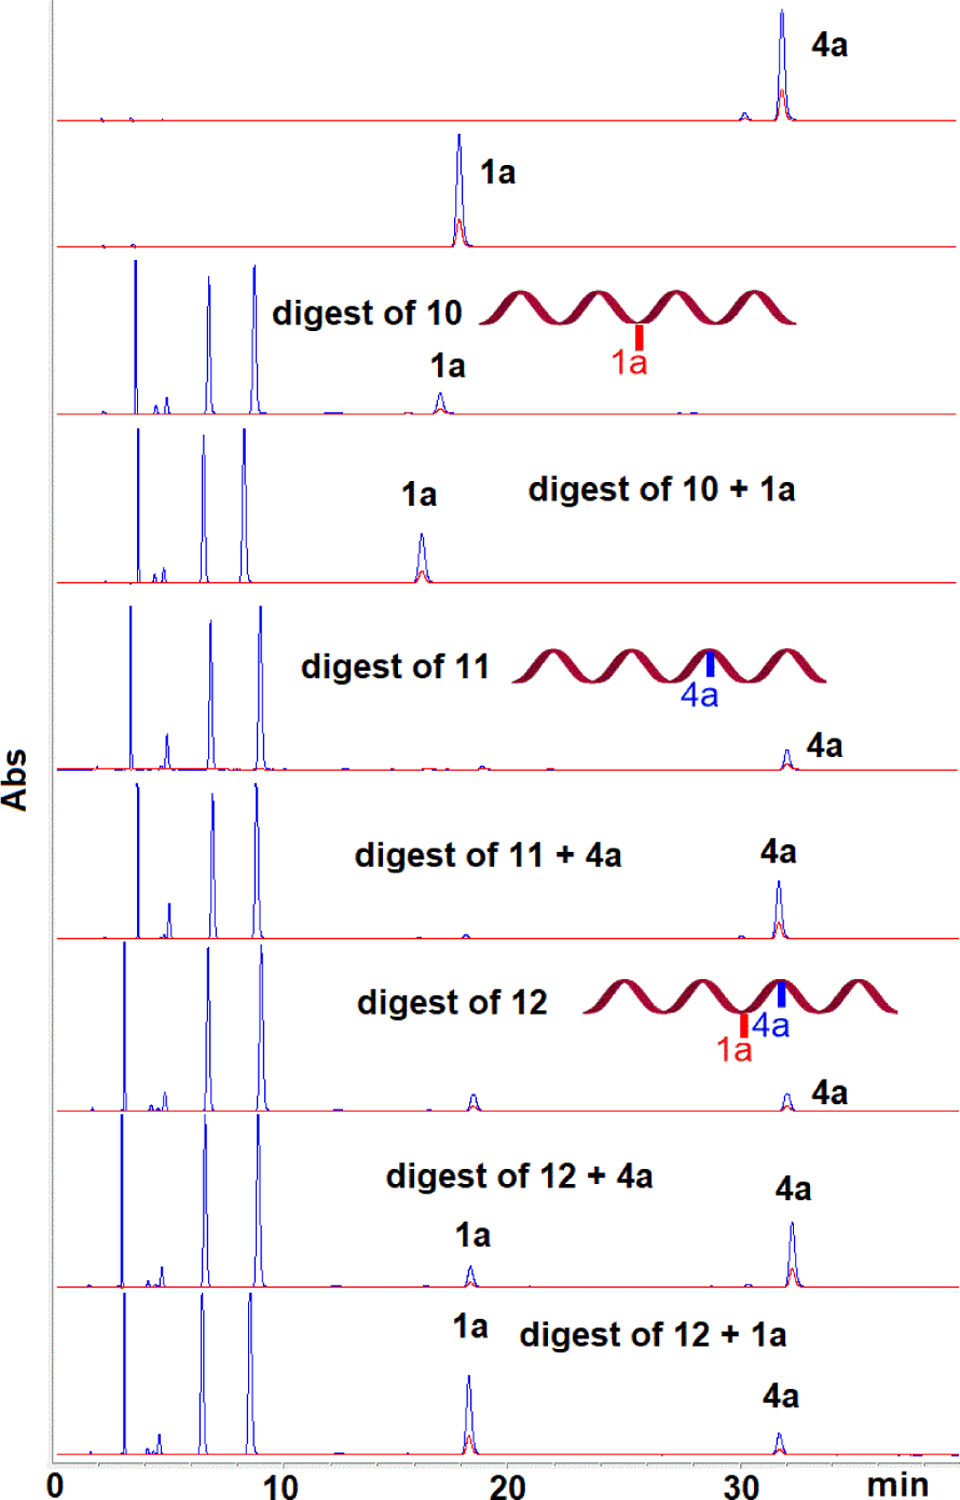
HPLC chromatograms of enzymatic digests from oligonucleotides 10, 11 and 12. Co-injection with authentic standards 1a and 4a.
Synthesis of trans cross-linked oligonucleotide 13
The trans-ICL 3a was also synthesized in order to compare its properties with that of oligonucleotides 10, 11 and 12. Oligonucleotide 10 was annealed with a self-complementary 25 mer and the duplex was treated with sodium dithionite to trigger the second arm alkylation and yield trans-crosslinked 13 (Figure 4).
Figure 4.
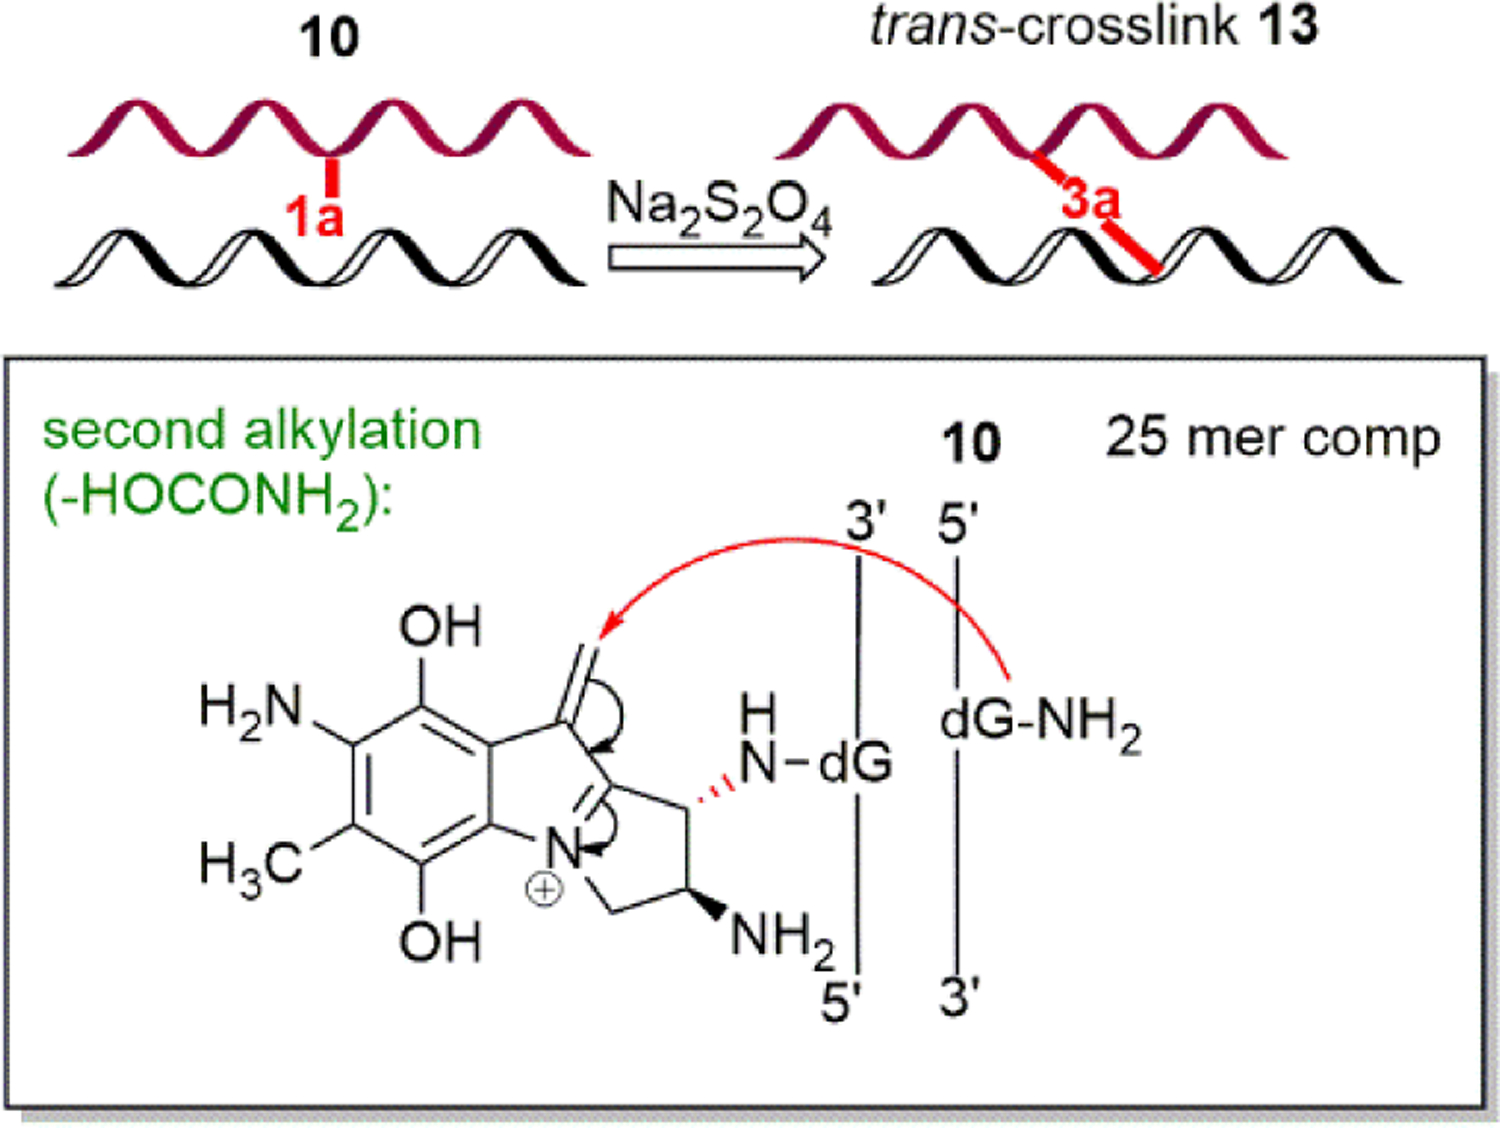
Synthesis of trans crosslink 13.
Structural determination by mass spectrometry
Oligonucleotide 10:
The site of alkylation for adduct 1a in 10 is unambiguous since only one dG is present in the starting 25 mer oligonucleotide. Further confirmation of its structure was provided by its Nano-ESI-MS spectrum which showed a mass of 7,798 Da corresponding to the mass of the starting 25 mer oligonucleotide-1H (7,495 Da) containing a mitosene fragment (303 Da) (Figure S1).
Oligonucleotide 11.
Nano-ESI-MS spectrum of 11 showed a mass of 7,798 Da corresponding to the mass of the starting oligonucleotide 8-1H (7,495 Da) containing a mitosene fragment (303 Da) (Figure S2). There are seven possible dA alkylation sites in oligonucleotide 8 (Figure 5: A1 to A7 in 8). Our previous work suggested that “internal” dA do not react with mitomycins in duplex DNA.[8] This indicates that the probable site for dA alkylation is A7 (Figure 5). The dA alkylation site was further confirmed by MS/MS fragmentation in collision activated mode (Figure 5 and Figure S3). Identification of the observed fragments was based on accurate mass-measurements (4 ppm or better). The fragmentation pattern of 11 showed the formation of expected wn and [an-B] ions which did not contain any mitosene moiety (Figure 5 and Figure S3). The nomenclature for fragment ions follows that reported by McLuckey et al.[36] In addition, a mass corresponding to the fragment [a20-B]* (* indicates the presence of a mitosene) was detected confirming the position of alkylation on A7 (Figure 5 and Figure S4). Finally, y1, y4, d-H2O1, d-H2O3, d-H2O22, d-H2O24 and d-H2O25 ions were also detected (Figure S3).
Figure 5.
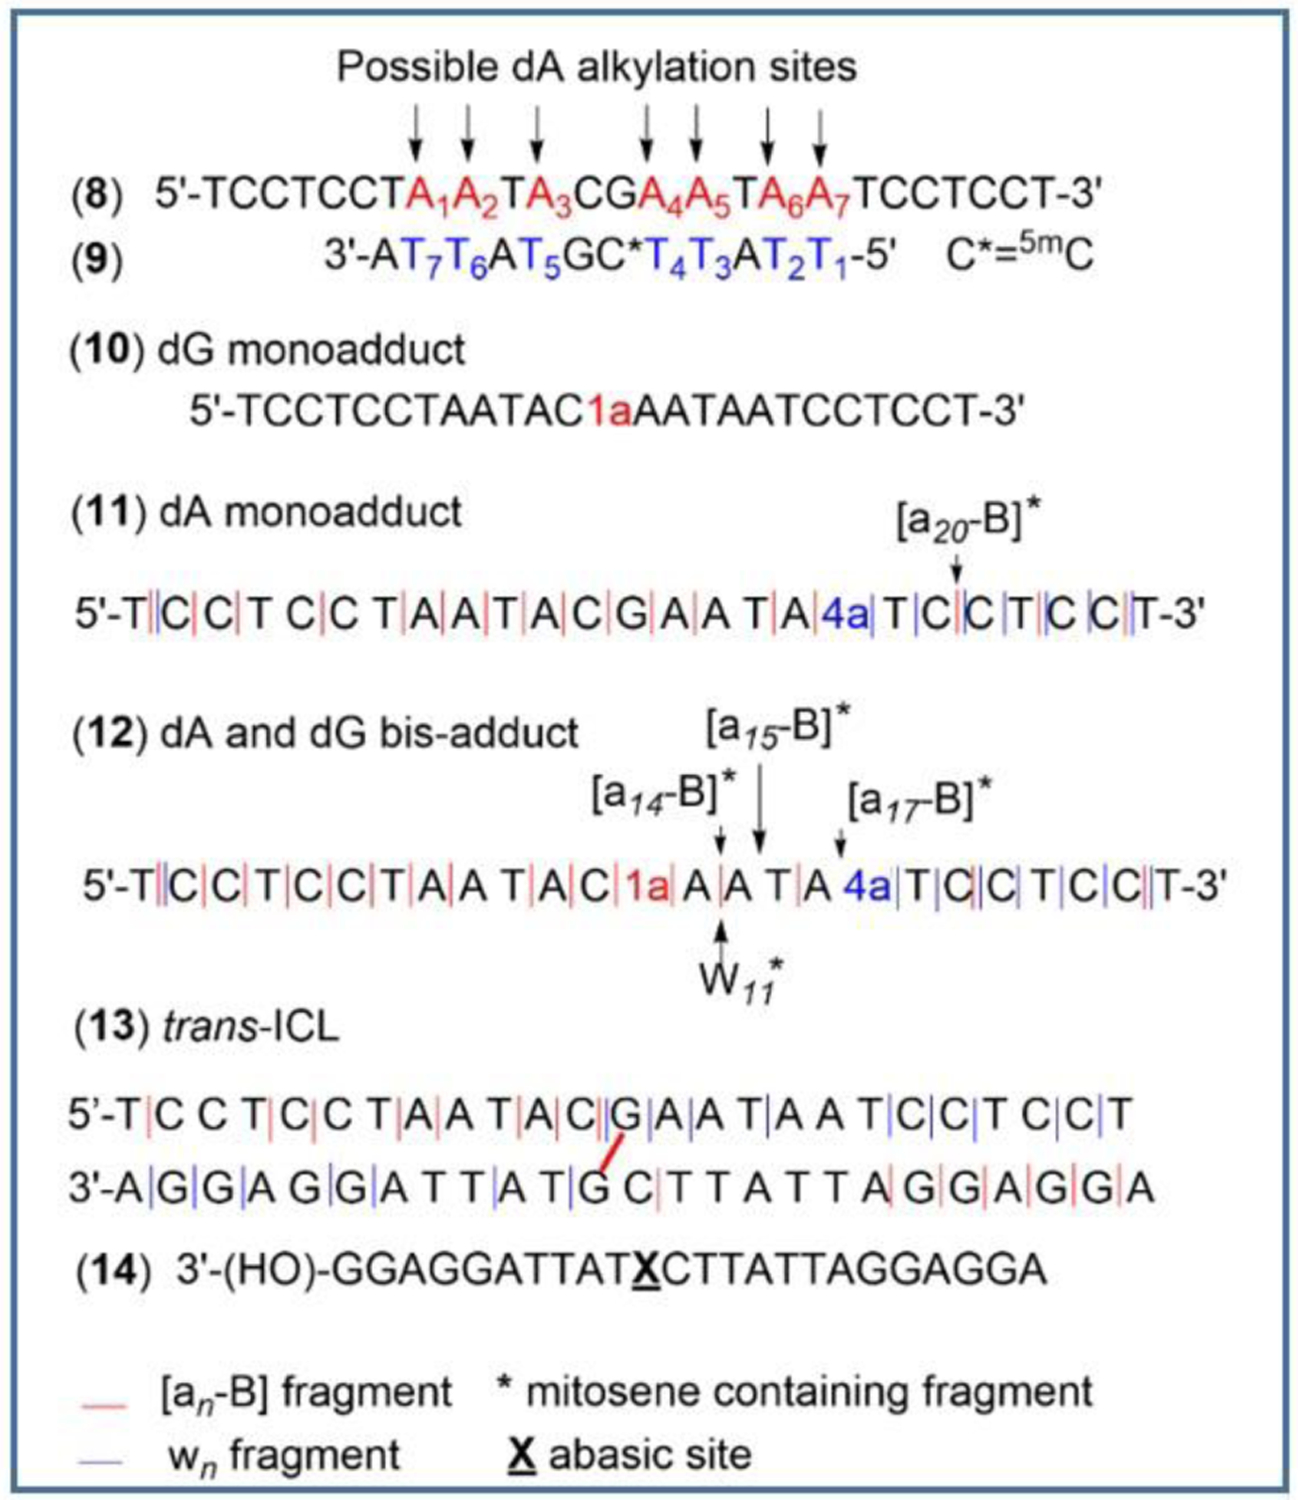
Fragmentation pattern and mitosene containing fragments detected by MS/MS fragmentation in collision activated mode. (11) : [an-B] with n=1,2,3,5,8–14,16,17, 20,22,24 and wn with n=1–7,24. (12) : [an-B] with n=1–8, 10–14,16,17,20, 24 and wn with n=1–7,24. (13) : top strand [an-B] with n=1,4,5,7,8, 10–12 and wn with n=1,3,4–6, 8,10–12; bottom strand: [an-B] with n=1–6, 12 and wn with n=1–3,5,6,9,11.
Oligonucleotide 12.
Nano-ESI-MS spectrum of 12 showed a mass of 8,100 Da corresponding to the mass of the starting 8-2H (7,494 Da) containing two mitosene fragments (2*303=606 Da) (Figure S5). MS/MS fragmentation pattern of 12 showed the expected wn and [an-B] ions which did not contain any mitosene moiety (Figure 5 and Figure S6). Ions containing a mitosene moiety were also found: [a14-B]*, [a15-B]*, [a17-B]* and W11* (Figure S7) confirming the location of the two mitosene fragments. A guanine-mitosene fragment was also detected (m/z calcd for C19H19N9O5 [M+H]+: 454.1582; found: 454.1561; Figure S7). Other ions observed include y1, d-H2O1, d-H2O2, d-H2O3 and d-H2O24 (Figure S6).
Trans-crosslinked 13.
Nano-ESI-MS spectrum of the crosslinked duplex showed a mass of 15,562 Da corresponding to the mass of the duplex (15,321 Da) containing a mitosene crosslinking fragment (241 Da) (Figure S8). The structure of 13 was further established by MS/MS fragmentation (Figure 5, Figure S9). The fragmentation pattern of the trans-ICL also showed the formation of expected wn, [an-B] ions which did not contain any mitosene moiety (Figure 5 and Figure S9). In addition, a high-resolution spectrum for an ion with a mass corresponding to a mitosene crosslinking fragment (guanine-mitosene-guanine; m/z calcd for C23H22N13O4 [M+H]+: 544.1918; found: 544.1896) was detected as well as an ion corresponding to oligonucleotide 14, which contains an abasic site where the alkylated guanine should be located (Figure 5 and Figure S10). These fragments unequivocally confirmed the position and the nature of the crosslinking moiety. Other ions detected include d-H2O1 (top and bottom strand) and d-H2O4 (bottom strand) (Figure S9).
Conditions and rationale for dA alkylation
To determine the conditions for the formation of 4a, we repeated the alkylation reaction described on Figure 2 with different duplexes by annealing oligonucleotide 8 with various complementary strands. In addition to the initial oligonucleotide (9), oligonucleotide (8) was also annealed with: 5’-TTATTCGTATTA (15); 5’-ATTATT5meCGTATTA (16) and 5’-ATTATT5meCGTATT (17) (Table 1). Oligonucleotide 15 has the same sequence as 9 but the cytosine at the CpG step is not methylated; 16 (a 13 mer with a 5-methylcytosine at CpG) has an extra dA in the 5’ direction compared to 9, resulting in all dA bases on the 25 mer (8) being “internal”; finally, the duplex formed between 8 and 17 (a 12 mer with a 5-methylcytosine at CpG) has all dA on 8 “internal” except A1 at the 5’ position (A1 on 8, Figure 5). The alkylated oligonucleotides resulting from the reactions were characterized by enzymatic digestion and co-injection with authentic standards 1a and 4a (Figure 3, S11 and S12). Reactions were repeated at least three times independently and gave consistent results.
Table 1.
Alkylated oligonucleotides detected under monofunctional conditions in various duplexes. C*= 5medC .
| Duplex DNA | 10 | 11 | 12 | 18 |
|---|---|---|---|---|
| (8).(9) | 31% (± 6%) | 14% (± 2%) | 7% (± 2%) | nd |
| (8).(15) | nd | nd | nd | nd |
| (8).(16) | 31 % (± 2%) | nd | nd | 18% (± 2%) |
| (8).(17) | 46 % (± 1%) | nd | nd | nd |
5’-TCCTCCTAATACGAATAATCCTCC
5’-TTATTC*GTATTA
:5’TCCTCCTAATAC1aAATAATCCTCC
5’-TTATTCGTATTA
:5’TCCTCCTAATACGAATA4aTCCTCC
5’-ATTATTC*GTATTA
:5’TCCTCCTAATAC1aAATA4aTCCTCC
5’-ATTATTGC*TATT
: 5’-ATTATTC*1aTATTA
Alkylation at CpG (and formation of 1a) occurred only when a 5-methyl cytosine was present at that sequence in the duplex (table 1).This is a consequence of the well documented enhanced reactivity of 7 at CpG when a 5-methyl cytosine is present on the opposite strand.[31–33] When complementary oligonucleotide 16 was used, alkylation at CpG occurred on both the 25 and 13 mer to yield 10 and the 13 mer dG monoadduct 18 (entry 3, table 1). Use of 17 as the complementary strand resulted in exclusive alkylation of 8 at dG (entry 4, table 1), thus yielding the highest amount of 10 for that reaction. Surprisingly, dA alkylation (formation of 4a) was only observed when the initial complementary 12 mer 5’- TTATT5meCGTTA (9) was used (table 1, entry 1).
Why did we observe dA alkylation only on the 25 mer strand and only in the duplex formed between (8) and (9) but not in the duplexes formed between (8) and (16) or (8) and (17)? Firstly, one should note that both (8).(9) and (8).(17) have a “terminal” dA moiety on the 25 mer strand (in these examples, dA is considered terminal when it is located at the edge of the overhang i.e. A7 for (8).(9) and A1 for (8).(17), Figure 5). This “terminal” dA is in the 3’ direction of the 25 mer for (8).(9) and in the 5’ direction of the 25 mer for (8).(17). All other dAs are internal. This suggests that only the “terminal” dA located in the 3’ direction of the longer strand is reactive in this particular model. The reason may be kinetics, i.e. A7 reacts faster because it is more accessible. An alternate reason could be that alkylated A7 induces duplex stabilization through hydrogen bonds or π-π interactions between the reduced MC moiety and adjacent bases or bases located on the opposite strand. Such stabilization by aromatic hydrocarbon groups tethered to terminal dAs of duplex oligonucleotides has been reported.[37]
However, the reason why dA alkylation required a methylated cytosine in the opposing strand remains unclear (compare entry 1, table 1 with entry 2, table 1). Transmission of the electron-donating effect of the 5-methyl substituent of the cytosine to guanine through H-bonding of the m5C.G base pair has been shown to be responsible for the greater nucleophilic reactivity of the 2-amino group of guanine.[33] Yet, dA alkylation by 7 is unlikely to result from the enhanced nucleophilicity of this 2-amino group. Rather, we suggest that other effects induced by the presence of m5C may be responsible. These effects include, but are not limited to, changes of DNA structural parameters and mechanical properties.[38,39] These changes may result in A7 being structurally more available for alkylation by 7 when a m5C is present in the duplex.
UV-Vis and Circular Dichroism (CD) Spectroscopy
UV-Vis spectra of the crosslinked and monoalkylated duplexes (Figure 7) show a peak at around 260 nm (present also in the native duplex at the same wavelength) and a shoulder absorbance at higher wavelength (320 nm) due to the presence of the mitosene chromophore.
Figure 7.
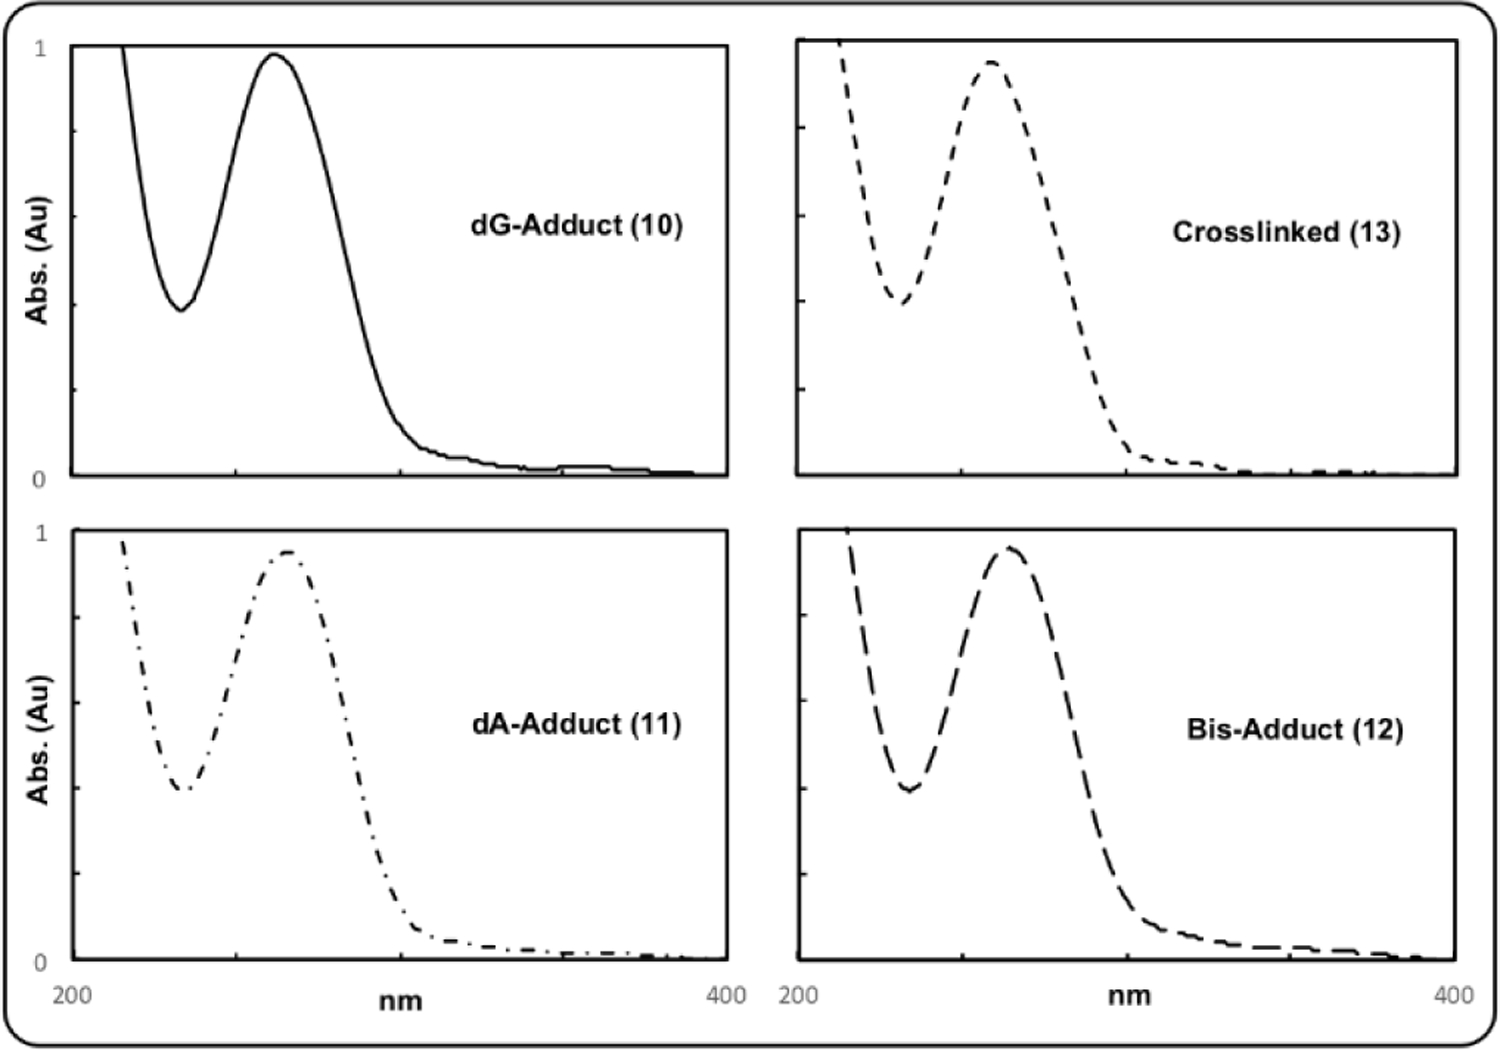
UV-Vis spectra of 10, 11, 12 and trans-ICL 13.
Interactions between the different chromophores in duplex 10, 11, 12, 13 and control duplex result in the CD spectra presented in Figure 8. These interactions depend on the secondary structure of the DNA which may vary based on changes in the average rotation per base pair, changes in the relative position of the bases for a given average rotation, and changes in the position of the bases relative to the sugar phosphate groups and the mitosene moiety. The CD spectra of duplex 10, 11, 12 and 13 constitute a family of B-DNA forms with common global features.[40] All of them are characterized by a positive long wavelength band or bands at about 260–280 nm, a negative band around 245 nm and a positive one at around 220 nm. The position and amplitudes of the CD bands differ slightly because of various conformational properties due to differences in adduct formation sites. Notably the band at about 260–280 nm is slightly blue shifted for the dG and dA-monoalkylated duplex (10 and 11) and the crosslinked duplex (trans-ICL 13) compared to the native duplex, in contrast to the bis-alkylated duplex (12) whose spectrum displays a slightly red shifted band. The dG-adduct 10 and the cross-linked DNA 13 show shoulder peaks at around 262 nm. This may indicate the possibility of a two-state heterogeneous conformation.[41,42] Finally, as was previously observed, the spectrum of the trans-crosslinked duplex shows an additional weak negative band in the 280–320 nm region, due to a negative Cotton effect. This band is typical of cross-linked chromophores and is red field shifted compared to cis-ICL.[22, 43–45]
Figure 8.
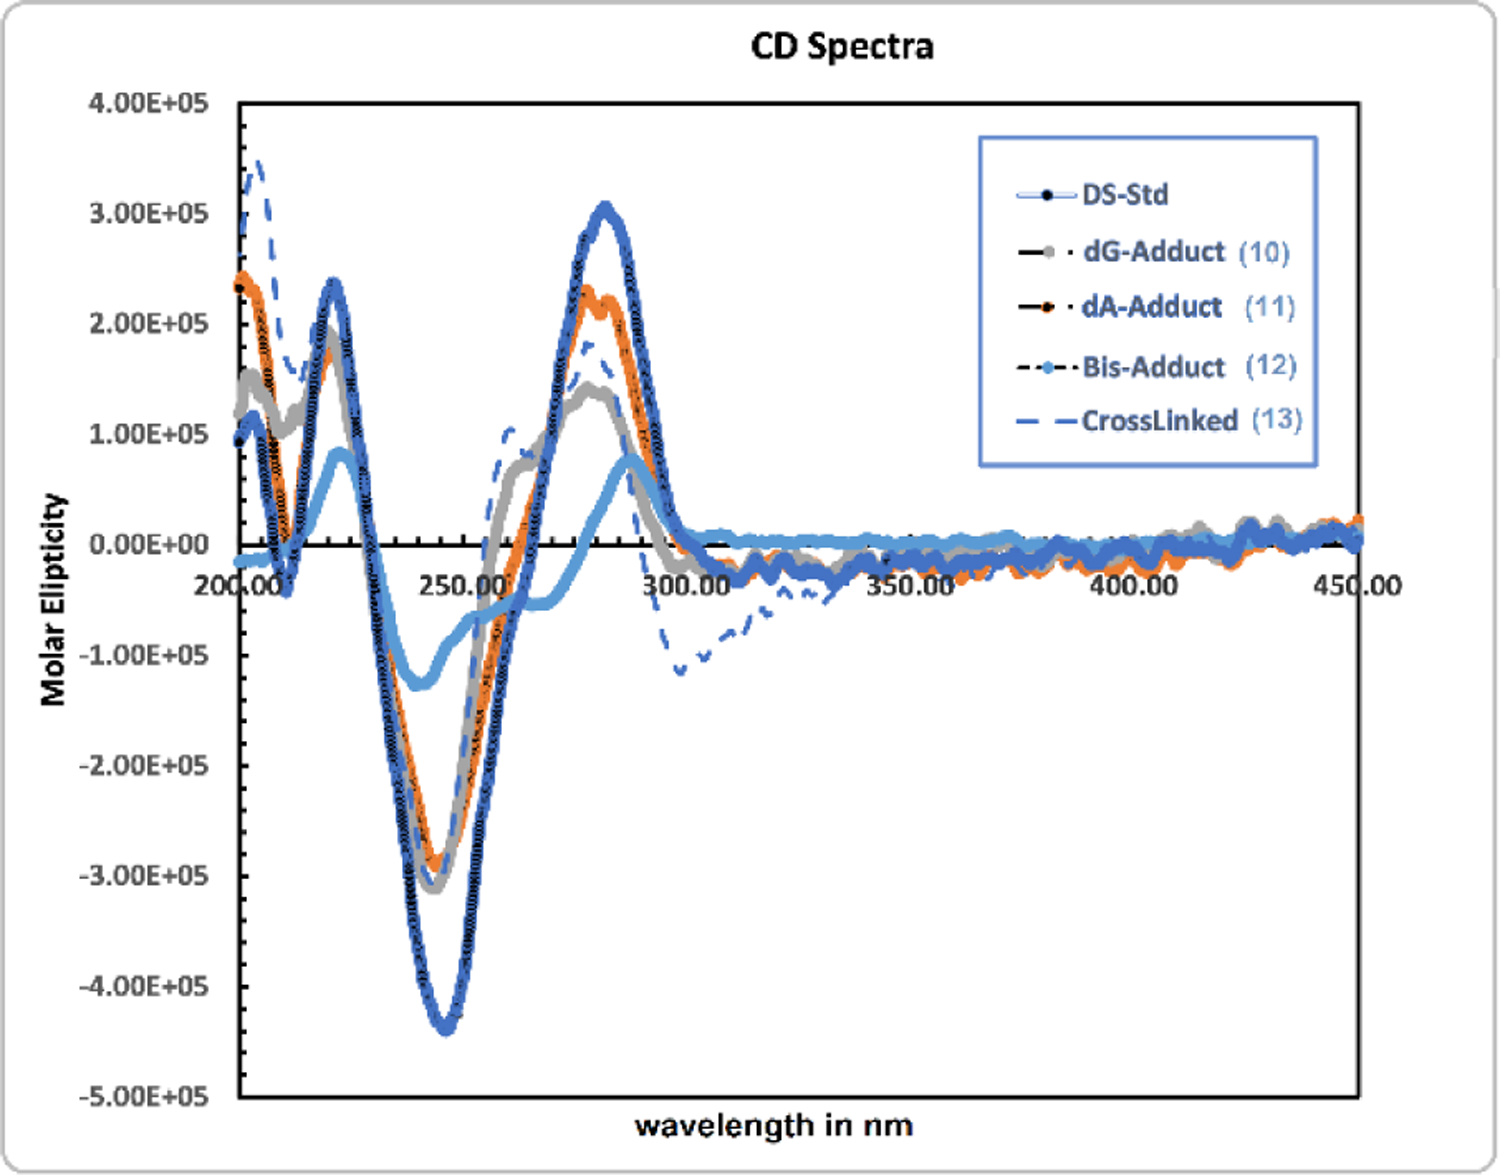
CD spectra of double stranded 10 (dG-Adduct; A260: 0.43 OD), double stranded 11 (dA-adduct; A260: 0.45 OD), double stranded 12 (dA and dG Bis-Adduct; A260: 0.80 OD), 13 (crosslinked; A260: 0.46 OD) and control duplex (DS-std; A260: 0.51 OD).
Thermal Denaturation Studies
Thermal denaturation studies of the trans-crosslinked duplex (13, Tm=75.5°C), the control native DNA (Tm=55.3°C), the dG-monoadduct (10, Tm=53.1°C), the dA monoadduct (11, Tm=46.7°C) and the bis-adduct (12, Tm=46.0°C) were performed (Figure 9). The Tm of duplexes 11 and 12, which contain a mitosene covalently bound at dA, is about 9 °C lower than that of the control duplex (46.7 °C and 46°C versus 55.3°C). This suggests that the mitosene linked to a dA fragment exerts a destabilizing effect. This may be due to unfavorable stacking of the mitosene moiety with the neighboring base pairs. The structure of 11 and 12 and the position of the mitosene within the duplex are further described in the virtual model study below.
Figure 9.
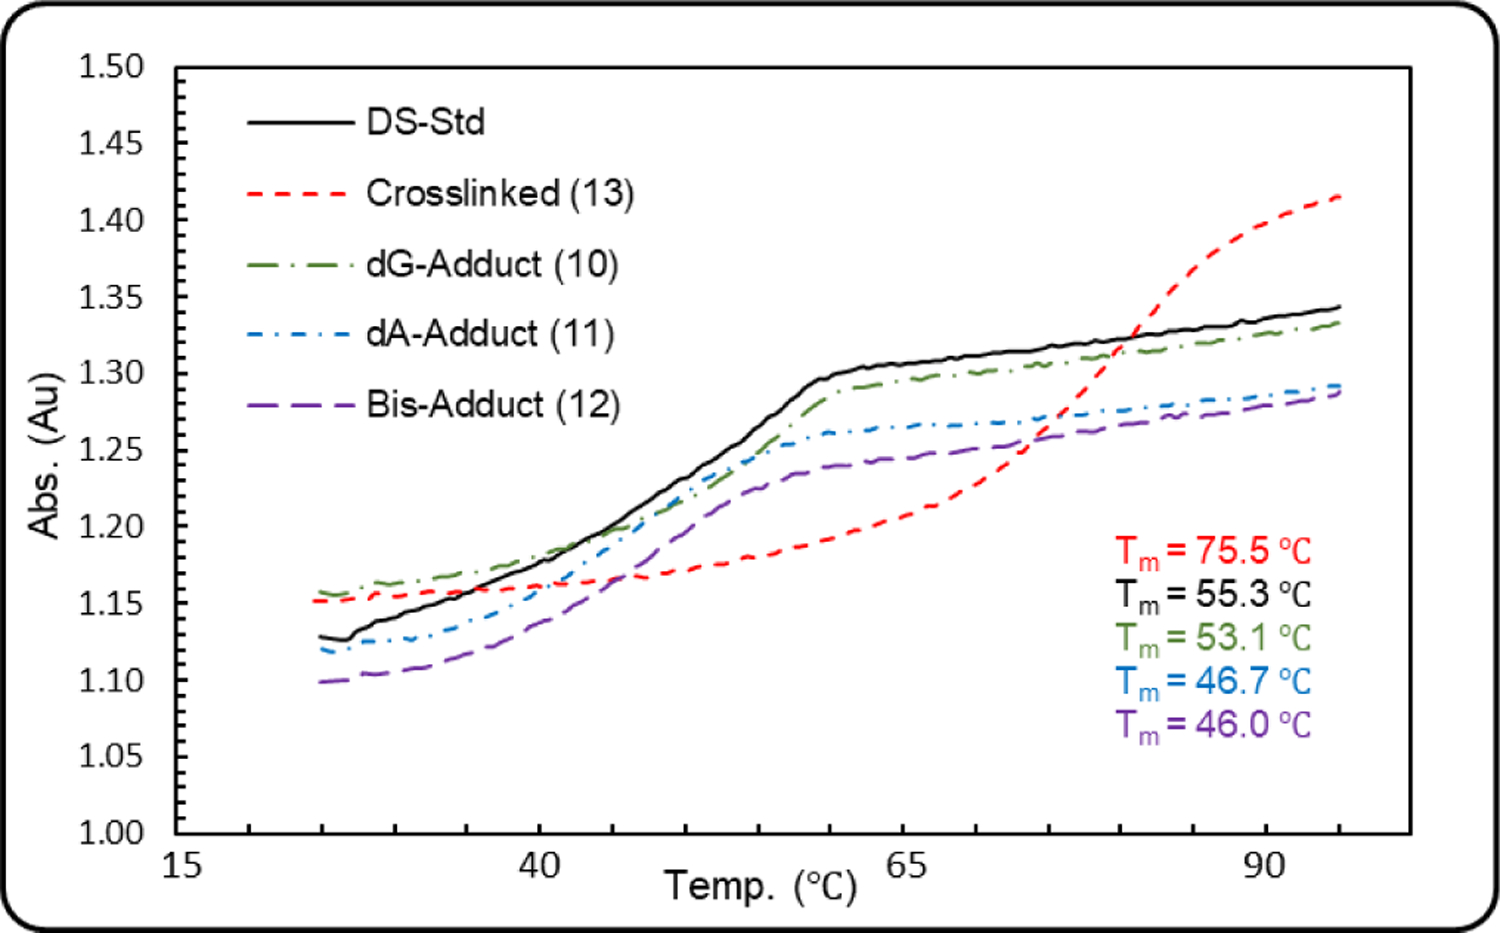
Melting curves for the trans-ICL (13, red), the control duplex (DS-std, black), the dG monoadduct (10, green), the dA monoadduct (11, blue) and the dA and dG-bisadduct (12, purple).
On the other hand, the Tm of trans-crosslinked duplex 13 is 20°C higher than that of the control duplex (75.5 °C versus 55.3°C). This is a result of the covalent linkage between the two strands which probably increases stacking interactions and/or hydrogen bonds between base pairs. Surprisingly, a shoulder in the melting curve of the stereoisomeric cis-ICL was previously observed but is absent in the case of the trans-ICL presented here.[22]
Conformational Survey of the Native, dG monoadduct (10), dA monoadduct (11), Bis-adduct (12) and Crosslinked 25-mer (13) DNA duplexes
Conformations obtained from 500ns MD trajectory of each model systems corroborate with empirically obtained melting curves (Figure 9) as well as provide some qualitative insight for the differences in CD signatures (Figure 8). The MD has resulted in an ensemble of conformations that have been grouped into four conformational clusters, totalling 500 conformations. As can be seen from Figure S13, the four clusters of the native unmodified duplex DNA exhibit slightly curved backbones, yet, all representations retain standard base pairing and hydrogen bonding.
In the case of the dG monoadduct (10), the mitosene is positioned either in the minor groove (cluster 1 and 3, Figure S14) or more centrally between the two strands (cluster 2 and 4, Figure S15). The only disrupted standard base pairing is between the adducted guanine and the opposite cytosine, with the cytosine being displaced and stabilized via H-bonding with the phosphate’s oxygen. In the lowest energy cluster (conformations of cluster 3), the mitosene forms H-bonding with both the adducted guanine and the opposite cytosine, hence keeping some interaction between complementary strands. This conformational analysis justifies why 10 exhibits a lower melting temperature (~ 53.1°C versus ~ 55.3°C) than the native duplex DNA, but a higher melting temperature than the dA monoadduct 11.
In the case of the dA monoadduct (11), common structural features within the four clusters are: 1) that the mitosene is positioned in the major groove and 2) that base pairing between the adducted adenine and the opposite thymine is disrupted (Figure S15). In some conformations, higher degree of base-pair irregularity is observed due to the mitosene’s presence. Specifically, cluster-3 conformations display misalignment of two consecutive base-pairs in the mitosene region. Overall disruption of the base-pairing justifies why 11 exhibits a lower melting temperature (~ 46.7°C) relative to the native duplex DNA (~ 55.3°C).
The highest conformational diversity among the four clusters is exhibited by the bisadduct (12, Figure S16). While the mitosene at dG is uniformly positioned in the minor groove and natural base pairing is preserved, the position and structural effects of the mitosene at dA varies. In clusters 1 and 3, the mitosene at dA is situated in the major groove, while in clusters 2 and 4 it is located more centrally between the two strands. In all clusters, base pairing between the adducted adenine and the opposite thymine is disrupted. More specifically, in the lowest energy cluster 2, the thymine is displaced away from both strands, while in cluster 4, two consecutive base-pairs are misaligned and the overall backbone is more distorted. The more pronounced disruption to the standard base-pairing in the region of dA monoadduct explains why 12 exhibits the lowest melting temperature (~46.0°C) of all duplexes studied.
Representative clusters obtained for the interstrand crosslink (13, Figure S17), all display preserved standard base pairing and H-bonding. Stabilizing H-bonding between the mitosene and nearby bases is also observed. The overall backbone appears straighter in the presence of the interstrand crosslink relative to the native duplex. The uniform and undisrupted conformational ensemble of the interstrand crosslink justifies why it exhibits the notably higher melting temperature (~ 75.5°C) relative to the native duplex.
More quantitative conformational features of model systems are provided in table S1: While the helix width is not affected by the presence of the mitosene, all model structures containing the adduct exhibit slightly (by ~ 2Å) extended helical pitch. As expected, the extension is reflected mostly in the major groove in the case of the dA monoadduct and in the minor groove in the case of the dG monoadduct.
Figure 10 and 11 respectively display overall and magnified views of representative structures associated with the lowest energy cluster of each model system and show that the dG monoadduct (10) and the dA monoadduct (11) both disrupt the standard base pairing. However, in the case of 10, there is more stabilizing H-bonding between the mitosene and adjacent base pairs. On the other hand, no change to standard base pairing and H-bonding is observed in the case of the crosslinked 25 mer (13). In the case of the bis-adduct (12), the standard base pairing as well as positioning of the bases is particularly disrupted in the region of the dA monoadduct. The pronounced curving of the backbone and displacement of the bases in the case of 12 provide insight into why its CD spectrum exhibits notably different spectral features with attenuated signal intensity compared to other duplexes studied herein.
Figure 10.

Representative structures associated with the lowest energy cluster for each of the model systems, with bulk model of the mitosene displayed in green.
Figure 11.
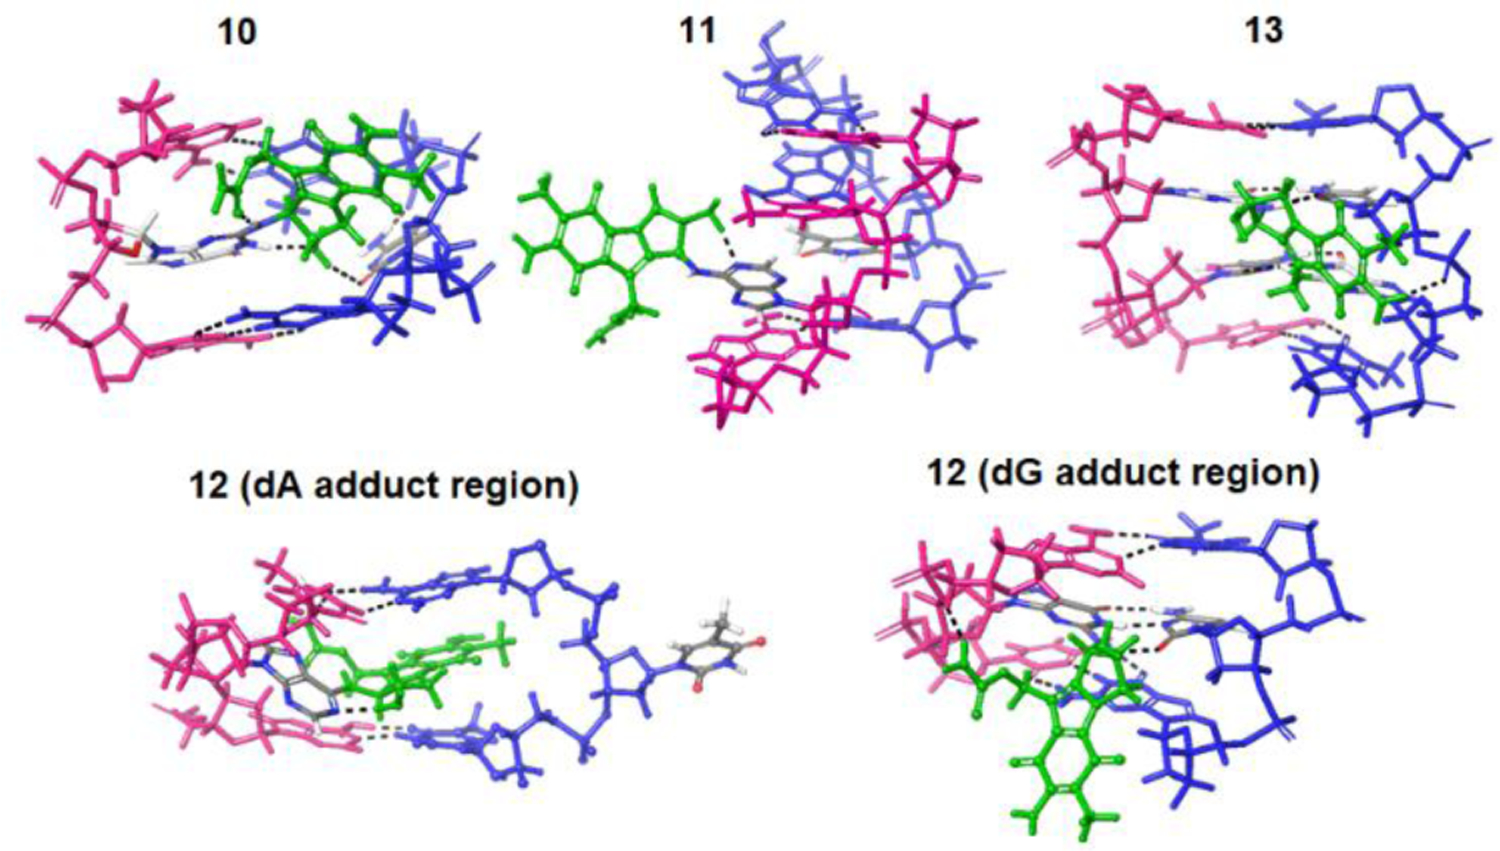
Magnified region surrounding the mitosene for representative structures (lowest energy clusters) of model systems containing the adduct(s).
Conclusion
In conclusion, we have developed a route to access oligonucleotides containing Mitomycin C trans N6-deoxyadenosine adducts at a specific site. The stability, spectral properties and conformational space of these adducts were assessed and compared to that of the trans MC-deoxyguanosine monoadduct and trans dG-MC-dG interstrand crosslink. Access to these substrates will allow us to compare the biological processing of the two types of DNA lesions (N2-deoxyguanosine adducts versus N6-deoxyadenosine adducts) by the cell’s machinery. In particular, we will investigate the role of the adducts’ structure in the signaling and repair mechanisms of these DNA lesions.
Experimental Section
Materials.
MC was generously gifted by Professor Maria Tomasz. Phosphodiesterase I (snake venom diesterase (SVD), Crotalus adamanteus venom, E.C. 3.1.4.1.) and alkaline phosphatase (Escherichia coli, EC 3.1.3.1) were obtained from Worthington Biochemical Corp (Freehold, NJ). Nuclease P1 (penicillium citrinum, EC 3.1.30.1) was from Sigma Life Sciences (St. Louis, MO). Sep-Pak C-18 cartridges were purchased from Waters Corp (Milford, MA). Oligonucleotides were purchased from Midland Certified Reagent (Midland, TX).
Quantitative Analysis.
Quantitation of single stranded oligonucleotides and duplexes was based on UV spectrophotometry using extension coefficients derived from the “Base composition Method”.46,47For calculating the E260 value of crosslinked oligonucleotide duplexes, monoadducts and bis-adduct, the E260 bound mitosene was assumed to be 12000 and added to E260 of the non-crosslinked duplex or single strand. This formula assumes negligible hypochromicity associated with the crosslinked duplex; this is justified by the low hyperchromicity on melting observed in the present work. Extensions coefficient values used were the following: 118.5*103 M−1 cm−1 (ss 5’-TTATTCGTATTA) and (ss 5’-TTATTC5meGTATTA); 231.1*103 M−1 cm−1 (ss 5’-TCCTCCTAATACGAATAATCCTCCT); 266.2*103 M−1 cm−1 (ss 5’-AGGAGGGATTATTCGTATTAGGAGGA) ; 410.5*103 M−1 cm−1 (duplex 5’-TCCTCCTAATACGAATAATCCTCCT); 117.9*103 M−1 cm−1 (ss 5’-ATTATTC5meGTATT); 132.6*103 M−1 cm−1 (ss ATTATTC5meGTATTA); 243*103 M−1 cm−1 (1a or 4a monoadducted oligonucleotide 5’-TCCTCCTAATACGAATAATCCTCCT); 255*103 M−1 cm−1 (1a and 4a bis-adduct 5’-TCCTCCTAATACGAATAATCCTCCT); 422.5*103 M−1 cm−1 (for crosslinked duplex 5’-TCCTCCTAATACGAATAATCCTCCT or monoadducted duplex); 434.5*103 M−1 cm−1 (for bis-adduct duplex 5’-TCCTCCTAATACGAATAATCCTCCT).
Reproducibility.
Syntheses were repeated at least three times independently and average yield is reported with deviation from the mean value represented in brackets.
Identification of Adducts 1a and 4a in Enzymatic Digests.
Adducts 1a and 4a were identified by their UV spectra, retention times and co-elution with authentic standards synthesized previously in our laboratory.[9,35]
Synthesis of mono and bis adducted oligonucleotides (10), (11), (12) and (18).
25-mer oligonucleotides and complimentary 12-mer or 13 mer oligonucleotides (containing, or not, a methylated dC) were mixed in equimolar amounts (66.25 nmol each; 25 A260 unit scale). The mixture was lyophilized. Oligonucleotides were annealed by heating (90°C, 10 min) after the addition of 0.1 M Potassium Phosphate Buffer, pH 7.5 (1.72 mL) and Mitomycin C (2.5 mg, 4.12 µmol) followed by slow cooling. The reaction mixture was then put under ice and deaerated via argon bubbling (30 min, 0°C). Na2S2O4 from a freshly prepared anaerobic solution was added to the mixture (0.5 eq.; 2.06 µmol in 90 µL of potassium phosphate buffer). The reaction mixture was then open to air and allowed to stir for 1 h under ice then chromatographed on a 2.5×56 cm Sephadex G-25 column using 20 mM NH4HCO3 as eluent. Oligonucleotide containing fractions were lyophilized.
The monoalkylation efficiency on the 12, 13 and 25 mer was determined by measuring peak areas from the HPLC chromatogram of the mixtures containing non-alkylated and alkylated oligonucleotides at λ 254 nm.
Synthesis of the trans-Interstrand crosslinked duplex (13).
Lyophilized monoalkylated 25-mer oligonucleotide (15 A260 unit, 0.060 μmol) and a slight excess of complementary strand (22.5 A260 unit, 0.068 μmol) were dissolved in 0.1 M Tris buffer, pH 7.4 (6.8 mL). Oligonucleotides were annealed by heating (90°C, 10 min) followed by slow cooling to 0°C. The mixture was put under ice and deaerated via argon bubbling (30 min). A freshly made and deaerated solution of sodium dithionite (8.2 mM in Tris buffer) was quickly added to the mixture (200 μL, 1.75 μmol). The reaction turned colourless and the mixture was stirred at 0°C with argon slowly bubbling. The mixture was opened to air after 30 min followed by gentle mixing until a consistent purple colour was obtained. The mixture was then chromatographed on a 2.5*56 cm Sephadex G-25 column using 0.02M NH4HCO3 as eluent. Oligonucleotide containing fractions were lyophilized. Enzymatic digestion of the crude mixture consistently showed a conversion from monoadduct to crosslink of 50% (± 2%).
Small scale purification of alkylation reactions products (10), (11), (12) and (18).
Alkylated oligonucleotides from the reaction between the 25-mer and 12 mer oligonucleotides (25 A260 units) were purified on an Agilent 1200 HPLC system using a Phenomenex Clarity Oligo-RP C18 reverse phase column (5 μm, 4.5 mm × 25 cm). Buffer A: 0.1M triethylammonium acetate pH 7.0; Buffer B: Acetonitrile. Flow Rate: 1 mL/min. The temperature was set to 45°C. The elution gradient was: t=0 to t=3 min: 6 to 9% acetonitrile; t=3 min to t=12 min: 9% acetonitrile; t=12 min to t= 32 min: 9 to 13% acetonitrile; t=32 min to t=37 min: 13 to 50% acetonitrile. Oligonucleotide containing fractions were collected manually. The elution times of the 5 oligonucleotides were as follow: non-alkylated 25-mer (21.5 min); non-alkylated 12-mer (22 min); dG-monoalkylated 25-mer (23 min); dA-monoalkylated 25-mer (24 min); bis-alkylated 25-mer (26 min). Alkylated oligonucleotides from the reaction between the 25-mer and 13-mer oligonucleotides (25 A260 units) were purified using the described protocol at 30°C. The elution times of the 4 oligonucleotides were as follow: non-alkylated 25-mer (21.5 min); monoalkylated 25-mer (22.5 min); non-alkylated 13-mer (23.5 min); monoalkylated 13-mer (24 min).
Large Scale Purification of alkylated oligonucleotide (10).
Alkylated oligonucleotides from the reaction between the 25-mer and 12 mer (5’-TTATTC5meGTATTA-3’) oligonucleotides (100 A260 units scale) were purified on an Agilent 1200 HPLC system using a Phenomenex Clarity Oligo-RP C18 reverse phase column (5 μm, 10 mm × 25 cm). Buffer A: 0.1M triethylammonium acetate pH 7.0; Buffer B: Acetonitrile. Flow Rate: 4 mL/min. The temperature was set to 45°C. The elution gradient was: t=0 to t=3 min: 6 to 9% acetonitrile; t=3 min to t=12 min: 9% acetonitrile; t=12 min to t= 32 min: 9 to 13% acetonitrile; t=32 min to t=37 min: 13 to 50% acetonitrile. The elution times of the 5 oligonucleotides were as follow: non-alkylated 25-mer (21.5 min); non-alkylated 12-mer (22 min); dG-monoalkylated 25-mer (23 min); dA-monoalkylated 25-mer (24 min); bis-alkylated 25-mer (26 min).
Purification of trans-crosslinked (13).
The trans-ICL was purified by denaturing PAGE on a 20% acrylamide-bis (19:1) gel containing 7 M urea. In this case, an average of 10 A260 unit of crude material was purified for each run using 1.6 mm preparative comb (gel dimension: 20 cm*20 cm*1.6 mm). The gel was run for 3.5 h at 290 V. Bands were visualized by UV shadowing and excised. The DNA was eluted into TE buffer (10 mM Tris-HCl, 1 mM disodium EDTA, pH 8.0) by the crush and soak method to yield 3.5 A260 unit; 0.008 μmol of pure crosslinked oligonucleotide (20 % yield (± 3%)).
Enzymatic digestion of alkylated oligonucleotides and analysis of DNA Adducts.
Nuclease P1/SVD/AP protocol: 1 A260 unit of oligonucleotide and 1 unit of nuclease P1 were incubated at 37°C for 2 h in 0.8 mL of 20 mM ammonium acetate, pH 5.5; 100 mM MgCl2 (20μL) was added, and the pH was adjusted to 8.2 by addition of 20 μL of 200 mM NaOH. SVD (2 units) and AP (2 units) were added and incubation was continued at 37°C for 2.5 h. Digestion mixtures were directly analyzed by HPLC using an Agilent 1200 HPLC system and a Kromasil C-18 reverse phase column (0.45*25 cm). The elution system was 6–18% acetonitrile in 30 mM potassium phosphate, pH 5.4, in 60 min, 1 mL/min flow rate.
UV melting studies.
UV melting study were performed using a Shimadzu UV 2600 UV-Vis spectrometer at 260 nm (slit width 1 nm). The melting studies were carried out in the temperature range 25–95°C using a scan rate of 1°C min–1. Samples were recorded in the following buffer: 100 mM sodium chloride, 10 mM sodium phosphate monobasic, 0.1mM EDTA pH 7.4. Melting temperatures were determined using the first derivative of the melting curve.
Circular dichroism.
CD spectra were recorded on JASCO J1560 spectropolarimeter at 25.0°C using 1 mL quartz cuvettes with path length of 1 cm. CD spectrometry for the secondary structure predictions were recorded in the wavelength range of 200–450 nm, a bandwidth of 1.00 nm, a data pitch of 0.1 nm and digital integration time of 2 sec. The scanning speed was 100 nm/min with 4 number of accumulations. The CD spectrum of potassium phosphate buffer (10 mM, pH7) was subtracted from each of the recorded spectra also in the same buffer. Excel (version 2019) was used to generate the graphs presented in the manuscript.
Mass spectromotry.
All mass spectrometry experiments were performed on a maXis-II-ETD ESI-Qq-TOF instrument (Bruker Daltonics Inc.) equipped with an off-line nano-ESI source. Off-line nano-electrospray was carried out by using borosilicate emitters (Thermo Scientific Inc.). Mass-spectra of all oligonucleotides (at 3µM concentration) were acquired in positive ion mode. Agilent’s ESI-MS tuning mix was used to calibrate the instrument. To reduce sodium adduction in ESI-MS, we prepared DNA samples in 500 mM ammonium acetate. The instruments parameters were as follows: ion-source voltage 900V; dry N2 gas flow 4L/min at 150°C; nebulizer gas flow kept at 0.1 bar. Bruker’s software “Data Analysis 5.1” was used for de-convolution of all the acquired intact and collision activated dissociation (MS/MS) spectra. Additionally, we used online tool (developed at the RNA Institute of University of Albany) for analysis of DNA fragmentation spectra.[48]
Conformational Survey.
Virtual models of five systems (DS-standard DNA, dA monoadduct, dG monoadduct, interstrand crosslink and bis-adduct) were created via Maestro visualizer within the Schrodinger suite of programs (Schrodinger, LLC, New York, NY, 2021). In order to explore the conformational space, each model system was subjected to 500 ns Molecular Dynamics (MD) trajectory using Desmond software.[49] Each structure was imbedded into a 10 Å orthorhombic solvent box, with TIP3P solvent model, simulating H2O media. The negative charge on phosphates was stabilized with sodium cations (Na+). The MD simulation was run based on OPLS-3e molecular mechanics force field, under standard NPT ensemble.[50] The MD has resulted in an ensemble of conformations that have been grouped into four conformational clusters totaling in 500 conformations. The grouping has been based on the lowest room mean square deviation (RMSD) of DNA backbones for DS-standard and based on the most prevalent positions of the mitosene in the case of model systems with the adduct(s).
Supplementary Material
Figure 6.
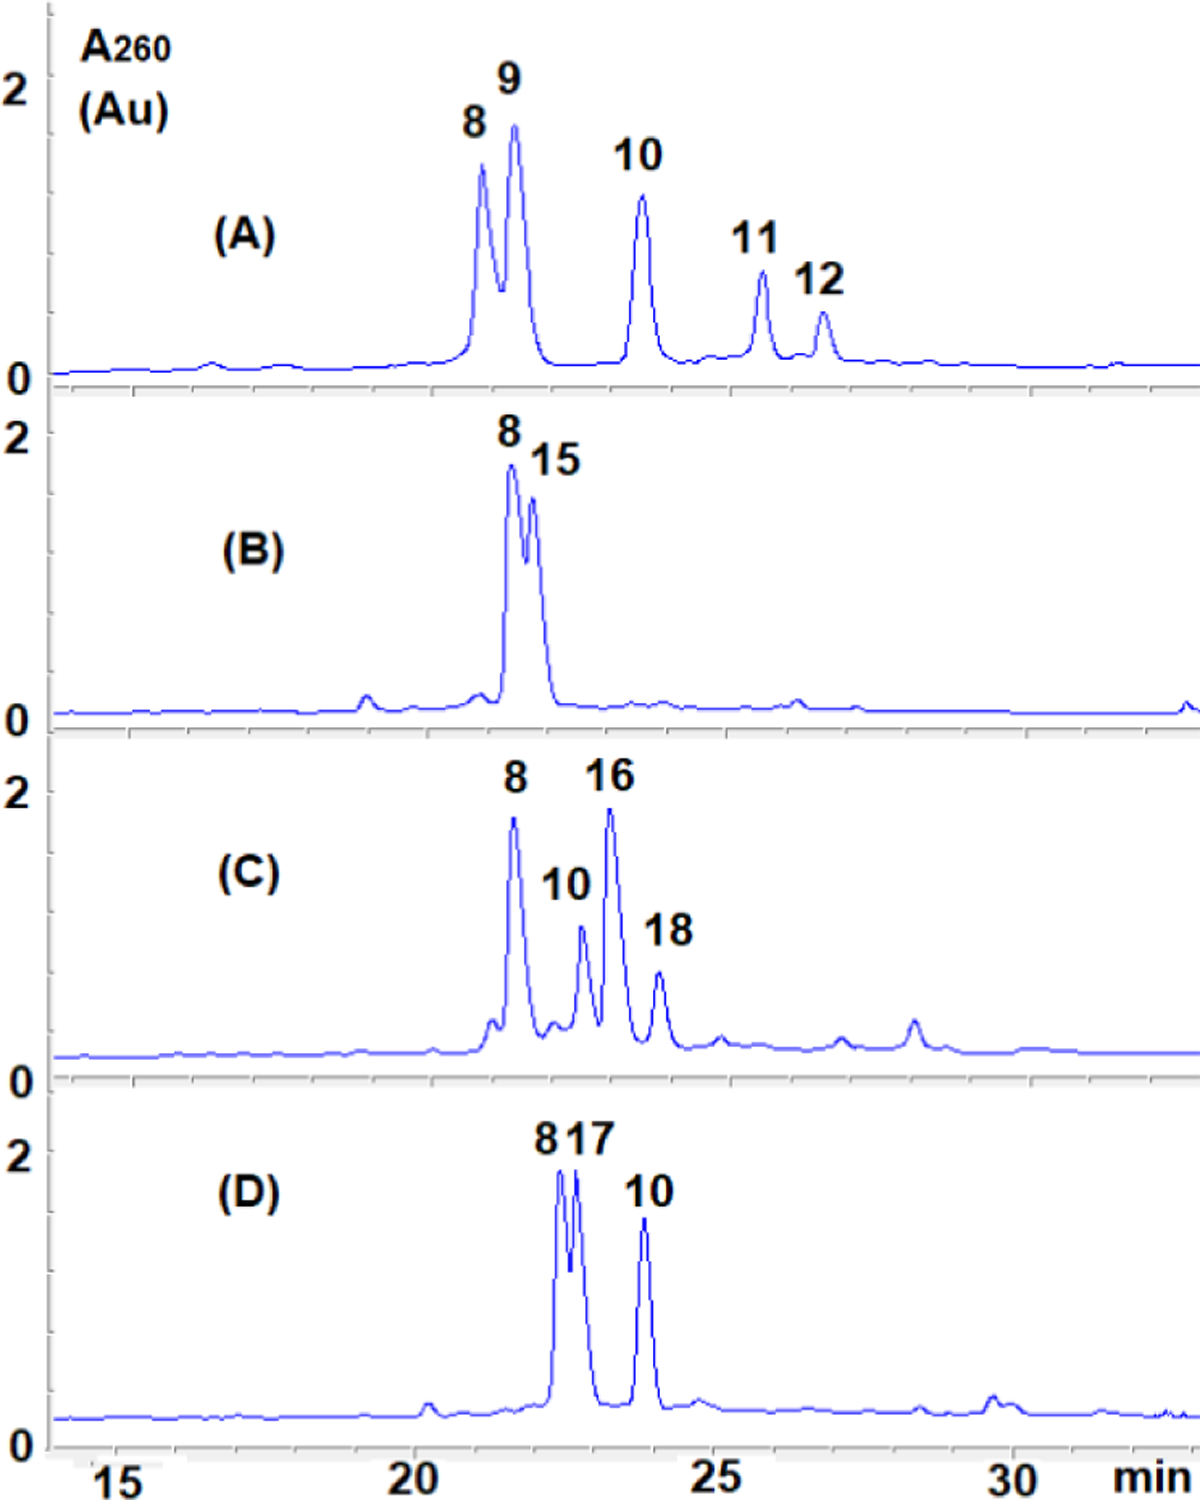
HPLC chromatogram (A260) of products from the reactions between 8 and 9 (A), 8 and 15 (B), 8 and 16 (C), 8 and 17 (D). HPLC analysis performed at 45°C for (A); (B) and (D) and at 30°C for (C).
Acknowledgements
The authors would like to thank the program for initiatives in math and sciences (PRISM) at John Jay College for the purchase of some research equipment. This work was supported by NIH grant 2SC3GM105460–07 to E.C.
Footnotes
Supporting information for this article is given via a link at the end of the document.
References
- [1].Hata T, Hoshi T, Kanamori K, Matsumae A, Sano Y, Shima T, Sugawara R, J. Antibiot 1956, 9, 141–146. [PubMed] [Google Scholar]
- [2].Bradner WT, Cancer Treat. Rev 2001, 27, 35–50. [DOI] [PubMed] [Google Scholar]
- [3].Verweij J, Pinedo H, in Cancer Chemotherapy and Biological Modifiers: Annual 11 (Eds.: Pinedo HM, Chabner BA, Longo DL), Elsevier Science Publishers B.V., Amsterdam, 1990, p. 67. [Google Scholar]
- [4].Chabner BA, Amrein PC, Druker BJ, Michaelson MD, Mitsiades CS, Goss PE, Ryan DP, Ramachandra S, Richardson PJ, Supko JG, Wilson WH, “Antineoplastic Agents” in Goodman & Gilman’s The Pharmacological Basis of Therapeutics (Eds.: Brunton LL, Lazo JS, Parker KL), McGraw-Hill Publishers, New York, 2005, pp. 1315–1403. [Google Scholar]
- [5].Paz MM, Pritsos CA, “The Molecular Toxicology of Mitomycin C” in Advances Molecular Toxicology Vol. 6 (Ed.: Fishbein JC), Elsevier Science Publishers B.V., Amsterdam, 2012, pp. 244–286. [Google Scholar]
- [6].Bass PD, Gubler DA, Judd TC, Williams RM, Chem. Rev 2013, 113, 6816–6863. [DOI] [PMC free article] [PubMed] [Google Scholar]
- [7].Tomasz M, Chem. Biol 1995, 2, 575–579. [DOI] [PubMed] [Google Scholar]
- [8].Zacarias O, Aguilar W, Paz MM, Tsukanov S, Zheng M, Cheng SY, Pradhan P, Champeil E, Chem. Res. Toxicol 2018, 31, 762–771. [DOI] [PMC free article] [PubMed] [Google Scholar]
- [9].Zheng M, Hwang S, Snyder T, Aquilina J, Proni G, Paz MM, Pradhan P , Cheng SY, Champeil E, Bioorg. Chem 2019, 92, 103280–103290. [DOI] [PMC free article] [PubMed] [Google Scholar]
- [10].Palom Y, Lipman R, Musser SM, Tomasz M, Chem. Res. Toxicol 1988, 11, 203–210. [DOI] [PubMed] [Google Scholar]
- [11].Lawley PD, Phillips DH, Mutat. Res 1996, 355, 13–40. [DOI] [PubMed] [Google Scholar]
- [12].Cheng S-Y, Seo J, Huang BT, Napolitano T, Champeil E, Int. J. Oncol 2016, 49, 1815–1824. [DOI] [PMC free article] [PubMed] [Google Scholar]
- [13].Cheng S-Y, Vargas A, Lee J-Y, Clement CC, Champeil E, Chem. Biol. Drug Des 2018, 92, 2022–2034. [DOI] [PMC free article] [PubMed] [Google Scholar]
- [14].Roy U, Mukherjee S, Sharma A, Frank EG, Schärer OD, Nucleic Acids Res 2016, 44, 7281–7291. [DOI] [PMC free article] [PubMed] [Google Scholar]
- [15].Kato N, Kawasoe Y, Williams H, Coates E, Roy U, Shi Y, Beese LS, Schärer OD, Yan H, Gottesman ME, Takahashi TS, Gautier J, Cell Reports 2017, 21, 1375–1385. [DOI] [PMC free article] [PubMed] [Google Scholar]
- [16].Semlow DR, Zhang J, Budzowska M, Drohat AC, Walter JC, Cell 2016,167, 498–511. [DOI] [PMC free article] [PubMed] [Google Scholar]
- [17].Bezalel-Buch R, Cheun YK, Roy U, Schärer OD, Burgers P, Nucleic Acids Res 2020, 48, 8461–8473. [DOI] [PMC free article] [PubMed] [Google Scholar]
- [18].Weng MW, Zheng Y, Jasti VP, Champeil E, Tomasz M, Wang Y, Basu AK, Tang MS, Nucleic Acids Res 2010, 38, 6976–6984. [DOI] [PMC free article] [PubMed] [Google Scholar]
- [19].Kumar S, Lipman R, Tomasz M, Biochemistry 1992, 31, 1399–1407. [DOI] [PubMed] [Google Scholar]
- [20].Aguilar W, Paz MM, Vargas A, Cheng S-Y, Clement CC, Champeil E, Chem. Eur. J 2018, 24, 6030–6035. [DOI] [PMC free article] [PubMed] [Google Scholar]
- [21].Aguilar W, Paz MM, Vargas A, Zheng M, Cheng S-Y, Champeil E, Chem. Eur. J 2018, 24, 13278–13289. [DOI] [PMC free article] [PubMed] [Google Scholar]
- [22].Aguilar W, Zacarias O, Romaine M, Proni G, Petrovic A, Abzalimov R, Paz MM, Champeil E, Chem. Eur. J 2020, 26, 12570–12578. [DOI] [PMC free article] [PubMed] [Google Scholar]
- [23].Champeil E, Paz MM, Ladwa S, Clement CC, Zatorski A, Tomasz M, J. Am. Chem. Soc 2008, 130, 9556–9565. [DOI] [PMC free article] [PubMed] [Google Scholar]
- [24].Subramaniam G, Paz MM, Suresh Kumar G, Das A, Palom Y, Clement CC, Patel DJ, Tomasz M, Biochemistry 2001, 40, 10473–10484. [DOI] [PubMed] [Google Scholar]
- [25].Borowy-Borowski H, Lipman R, Chowdary D, Tomasz M, Biochemistry 1990, 29, 2992–2999. [DOI] [PubMed] [Google Scholar]
- [26].Sastry M, Fiala R, Lipman R, Tomasz M, Patel DJ, J. Mol. Biol 1995, 247, 338–359. [DOI] [PubMed] [Google Scholar]
- [27].Utzat CD, Clement CC. Ramos LA, Das A, Tomasz M, Basu AK, Chem. Res. Toxicol 2005, 18, 213–223. [DOI] [PubMed] [Google Scholar]
- [28].Bose A, Surugihalli C, Pande P, Champeil E, Basu AK, Chem. Res. Toxicol 2016, 29, 933–939. [DOI] [PMC free article] [PubMed] [Google Scholar]
- [29].Hsu GW, Huang X, Luneva NP, Geacintov NE, Beese LS, J. Mol. Biol 2005, 280, 3764–3770. [DOI] [PubMed] [Google Scholar]
- [30].Tomasz M, Lipman R, Lee MS, Verdine GL, Nakanishi K, Biochemistry 1987, 26, 2010–2027. [DOI] [PubMed] [Google Scholar]
- [31].Li VS, Reed M, Zheng Y, Kohn H, Tang M, Biochemistry 2000, 39, 2612–2618. [DOI] [PubMed] [Google Scholar]
- [32].Das A, Tang KS, Gopalakrishnan S, Waring MJ, Tomasz M, Chem. Biol 1999, 6, 461–471. [DOI] [PubMed] [Google Scholar]
- [33].Dannenberg JJ, Tomasz M, J. Am. Chem. Soc 2000, 122, 2062–2068. [Google Scholar]
- [34].Suresh Kumar G, Lipman R, Cummings J, Tomasz M, Biochemistry 1997, 36, 14128–14136. [DOI] [PubMed] [Google Scholar]
- [35].Champeil E, Paz MM, Lukasiewicz E, Kong W, Watson S, Sapse AM, Bioorg. Med. Chem. Lett 2012, 22, 7198–7200. [DOI] [PubMed] [Google Scholar]
- [36].McLuckey SA, Vankerbel GJ, Glish GL, J. Am. Soc. Mass. Spectrom 1992, 3, 60–70. [DOI] [PubMed] [Google Scholar]
- [37].Nakano S-I, Uotani Y, Nakashima S, Anno Y, Fujii M, Sugimoto N, J. Am. Chem. Soc 2003, 125, 8086–8087. [DOI] [PubMed] [Google Scholar]
- [38].Severin PMD, Zou X, Gaub HE, Schulten K, Nucleic Acids Res 2011, 39, 8740–8751. [DOI] [PMC free article] [PubMed] [Google Scholar]
- [39].Cassina V, Manghi M, Slerno D, Tempestini A, Ladarola V, Nardo L, Brioschi S, Mantegazza F, Biochim Biophys Acta Gen Subj 2016, 1860, 1–7. [DOI] [PubMed] [Google Scholar]
- [40].Keller D, in Circular Dichroism and the Conformational Analysis of Biomolecules (Ed.: Fasman GD), Springer-Verlag Publishers, New York, 2001, p 413. [Google Scholar]
- [41].Kypr J, Kejnovska I, Renciuk D, Vorlickova M, Nucleic Acids Res 2009, 37, 1713–1725. [DOI] [PMC free article] [PubMed] [Google Scholar]
- [42].Pradhan P, Jernstrom B, Seidel A, Norden B, Graslund A, Biochemistry 1998, 13, 4664–4673. [DOI] [PubMed] [Google Scholar]
- [43].Warren AJ, Hamilton JW, Chem. Res. Toxicol 1996, 9, 1063–1071. [DOI] [PubMed] [Google Scholar]
- [44].Mustra DJ, Warren AJ, Wilcox DE, Hamilton JW, Chem. Biol. Interact 2007, 168, 159–168. [DOI] [PubMed] [Google Scholar]
- [45].Jash B, Scharf P, Sandmann N, Guerra CF, Megger DA, Müller J J. Chem. Sci 2017, 8, 1337–1343. [DOI] [PMC free article] [PubMed] [Google Scholar]
- [46].https://www.atdbio.com/tools/oligo-calculator. Last accessed 3-26-2021.
- [47].https://www.atdbio.com/content/1/Ultraviolet-absorbance-of-oligonucleotides. Last accessed 3-26-2021
- [48].https://mods.rna.albany.edu/masspec/Mongo-Oligo. Last accessed 4-25-2020.
- [49]. Schrödinger Release 2021–2: Desmond Molecular Dynamics System, D. E. Shaw Research, New York, NY, 2021. Maestro-Desmond Interoperability Tools, Schrödinger, New York, NY, 2021.
- [50].Harder E, Damm W, Maple J, Wu C, Reboul M, Xiang JY, Wang L, Lupyan D, Dahlgren MK, Knight JL, Kaus JW, Cerutti DS, Krilov G, Jorgensen WL, Abel R, Friesner RA, J. Chem. Theory Comput 2016, 12, 281–296. [DOI] [PubMed] [Google Scholar]
Associated Data
This section collects any data citations, data availability statements, or supplementary materials included in this article.