Correction to: Scientific Reports 10.1038/s41598-017-01443-7, published online 09 June 2017
This Article contains errors.
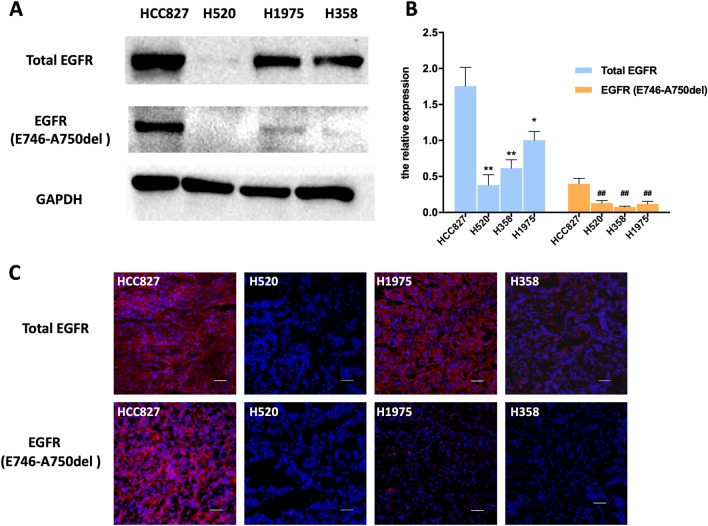
In Figure 5A, the blots for EGFR (E746-A750del) and GAPDH band are incorrect, which affected the quantification in Figure 5B. A corrected version of Figure 5 and its accompanying legend appear below.
Figure 5.
Western blot and immunofluorescence of tumors derived from HCC827, H520, H1975 and H358 cell lines. (A) Representative Western blots of four human NSCLC tissue lysates comparing the extent of EGFR and EGFR-specific E749-A750del mutation expression. GAPDH served as a reference for equal loading. HCC827 tissue has high EGFR and EGFR-specific E749-A750del mutation EGFR (B) Western blot analysis of proteins in total EGFR and EGFR-specific E749-A750del mutation (n = 3). Data are presented as mean ± SD. *P < 0.05 vs. HCC827 group in total EGFR. **P < 0.01 vs. HCC827 group in total EGFR. ##P < 0.01 vs. HCC827 group in EGFR-specific E749-A750del mutation. (C) The immunofluorescence in tumors confirms western blot results. (Red color is from secondary antibody Alexa Fluor®549, and blue color from DAPI for nuclear visualization). All scale bars, 100 μm.
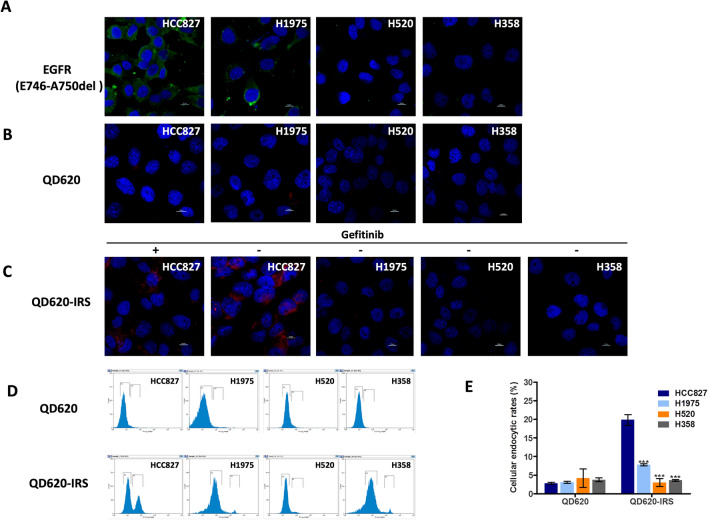
In Figure 7B, the image for the H358 is incorrect. The correct Figure 7 appears below with its accompanying legend.
Figure 7.
Quantitative analysis of QD620-IRS binding affinity by confocal imaging and flow cytometry. (A) Comparison of the expression levels of EGFR specific E749-A750del mutation in HCC827, H520, H1975 and H358 cell lines by immunofluorescence (Green color is from Alexa Fluor®488 secondary antibody, blue color from DAPI). (B) There is little uptake of QD620 in the four cell lines. (C) QD620-IRS uptake in HCC827 cells expressing EGFR 19 exon deleted mutation is considerably higher than in H1975, H520 and H358 cells. The binding of QD620-IRS in HCC827 cells was inhibited by application of gefitinib (100 μmol/L) (red circle is from QD620-IRS and blue color from DAPI). All scale bars 10 μm. (D) Flow cytometric analysis of endocytic rates in HCC827, H1975, H520 and H358 cells incubated with QD620-IRS or QD620 1 h. In (E), error bars indicate the mean ± S.D. of data from three separate experiments. ***P < 0.001 vs. HCC827 group.
This correction does not alter the conclusions of this study.
Contributor Information
Xilin Sun, Email: sunxilin@aliyun.com.
Baozhong Shen, Email: shenbzh@vip.sina.com.


