

Abstract
Background:
2-Hydroxyethyl mercapturic acid (2HEMA, N-acetyl-S-(2-hydroxyethyl)-L-cysteine) is a urinary metabolite of several volatile organic compounds including acrylonitrile and ethylene oxide, which are found in cigarette smoke.
Methods:
We measured 2HEMA concentrations in urine specimens collected during the National Health and Nutrition Examination Survey (2011–2016) from eligible participants aged >12 years (N = 7,416). We developed two multiple linear regression models to characterize the association between cigarette smoking and 2HEMA concentrations wherein the dependent variable was 2HEMA concentrations among participants who exclusively smoked cigarettes at the time of specimen collection and the independent variables included sex, age, race/ethnicity, creatinine, diet, and either cigarettes smoked per day (CPD) or serum cotinine.
Results:
We detected 2HEMA in 85% of samples tested among exclusive cigarette smokers, and only 40% of specimens from non-smokers. When compared to exclusive cigarette smokers who smoked 1–9 CPD, smoking 10–19 CPD was associated with 36% higher 2HEMA (p < 0.0001) and smoking >19 CPD was associated with 61% higher 2HEMA (p < 0.0001). Additionally, 2HEMA was positively associated with serum cotinine.
Conclusions:
This study demonstrates that cigarette smoking intensity is associated with higher urinary 2HEMA concentrations and is likely a major source of acrylonitrile and/or ethylene oxide exposure.
Keywords: N-acetyl-S-(2-hydroxyethyl)-L-cysteine, ethylene oxide, vinyl chloride, acrylonitrile, tobacco smoke exposure, biomonitoring
Introduction
2-Hydroxyethyl mercapturic acid (2HEMA, N-acetyl-S-(2-hydroxyethyl)-L-cysteine) is a common urinary metabolite of several harmful volatile organic compounds (VOCs), including acrylonitrile and ethylene oxide (Darrall et al. 1998, ASTDR 2020). Human inhalation of 16 ppm acrylonitrile for 20–45 min is associated with headache, nausea, and dizziness. Acrylonitrile is carcinogenic in rats at concentrations as low as 10 ppm, but determinations of acrylonitrile’s carcinogenicity in humans has been inconclusive (Kirman et al. 2005, Cole et al. 2008). Ethylene oxide exposure is associated with lymphohematopoietic cancers and breast cancer at concentrations at as low as 10 ppm in rodents (Jinot et al. 2018, ASTDR 2020). The association between occupational human exposure to ethylene oxide and lymphohematopoietic cancer is inconclusive, but the relationship between ethylene oxide exposure and breast cancer is clear and consistent across multiple epidemiological studies (Jinot et al. 2018). Humans may be exposed to acrylonitrile and ethylene oxide from industrial applications such as acrylic fibre production and chemical production, respectively (Mendes et al. 2007, Cole et al. 2008). Additionally, ethylene oxide exposures related to medical equipment sterilisation have recently been documented in the United States (Olaguer et al. 2020, Szwiec et al. 2020). Ethylene oxide may also be a metabolite of the plant hormone ethylene, which is found in fruits, vegetables, and grains. However, associations between potential dietary sources of ethylene oxide and biomarkers of ethylene oxide exposure have not yet been examined (Kirman et al. 2021). In contrast, the relationship between diet and acrylonitrile exposure has been studied, but no associations between diet and acrylonitrile exposure were observed (De Jesús et al. 2021).
Acrylonitrile and ethylene oxide are also present in tobacco smoke at concentrations of 0.9–14.9 μg/cigarette and approximately 7 μg/cigarette, respectively (Darrall et al. 1998, Hoffmann et al. 2001, Pazo et al. 2016, ASTDR 2020). Biomarkers (metabolites and/or haemoglobin adducts) of acrylonitrile (Tavares et al. 1996, Bergmark 1997, Fennell et al. 2000, Schettgen et al. 2002, Zhang et al. 2014, Jain 2015, Chen et al. 2019, De Jesús et al. 2020, Luo et al. 2020) and ethylene oxide (Törnqvist et al. 1986, Tates et al. 1991, Tavares et al. 1994, Bader et al. 1995, Müller et al. 1998, Bono et al. 1999, Fennell et al. 2000, Schettgen et al. 2002, Scherer et al. 2007, Von Stedingk et al. 2011) are also higher among smokers compared to non-smokers. This includes a multiple regression analysis of urinary 2-Cyanoethyl mercapturic acid, an acrylonitrile metabolite, among participants in the National Health and Nutrition Examination Survey (NHANES) 2011–2016 (De Jesús et al. 2021). Urinary 2HEMA concentrations among participants in NHANES III 1988–1994 have been analyzed (Calafat et al. 1999), however, the association between urinary 2HEMA and quantitative measures of cigarette smoking intensity (e.g. cigarettes smoked per day and serum cotinine concentrations) with recent data from the U.S. population is unknown.
In this report, we used two multiple regression models to characterize the association between 2HEMA and cigarette smoking intensity (cigarettes smoked per day and serum cotinine) among cigarette smokers from the 2011–2016 NHANES cycles (National Center for Health Statistics 2021a). Our analyses included diet and cigarette smoke exposure, as well as other variables that have been previously associated with or may affect urinary VOC metabolite concentrations, such as body weight status (Jain and Bernert 2010, Jain 2015, Kenwood et al. 2021) and demographics (Calafat et al. 1999, Jain 2015, Bagchi et al. 2018, Capella et al. 2019, De Jesús et al. 2021, Kenwood et al. 2021, Nieto et al. 2021).
Clinical significance
Cigarette smoking intensity is associated with higher urinary 2HEMA concentrations.
Occupational ethylene oxide and acrylonitrile exposure assessments may be confounded by cigarette smoke exposure.
Materials and methods
Study design and variable definitions
Spot urine samples were collected through NHANES, which is a cross-sectional study that combines physical examination and interviews to assess the health and nutrition of the U.S. population. NHANES uses a complex sample design to select a nationally representative sample of civilian, noninstitutionalized US population (National Center for Health Statistics 2021a). The National Center for Health Statistics (NCHS), U.S. Centers for Disease Control and Prevention (CDC) conducts NHANES. This protocol was approved by the NCHS Research Ethics Review Board (NCHS Research Ethics Review Board (ERB) Approval 2017).
We focused on participants who were exclusive users of cigarette products (termed ‘exclusive cigarette smokers’ in this report), and stratified exclusive cigarette smokers and non-smokers by combining nicotine biomarker data (serum cotinine) with self-reported recent tobacco use (NHANES dataset: SMQRTU), as shown in Figure 1. All exclusive cigarette smokers had serum cotinine concentrations (LBXCOT) > 10 ng/mL (Pirkle et al. 1996), which is approximately 98% specific in differentiating smokers from non-smokers (Benowitz et al. 2009). Participants with serum cotinine concentrations > 10 ng/mL were classified as exclusive cigarette smokers if they used cigarettes in the last five days (responded ‘yes’ to NHANES question ‘Used any tobacco/nicotine product in the past 5 days?’) and ‘yes’ to SMQ690a (cigarette use). We excluded participants who used non-combustible tobacco products because these products would expose participants to nicotine (and thus increase serum cotinine) but not to tobacco smoke. Therefore, we excluded exclusive cigarette smokers who answered ‘yes’ to using chewing tobacco (SMQ690D), snuff (SMQ690E), patch/gum (SMQ690F), e-cigarettes (SMQ690H, NHANES 2013–2016 only), or dissolvables (SMQ690J, NHANES 2013–2016 only) within the last five days. We also excluded users of non-cigarette combustible tobacco products (e.g. cigars and pipes) to standardise the quantity of tobacco smoke exposure among exclusive cigarettes smokers; thus exclusive cigarette smokers answered ‘no’ to smoking other types of tobacco products within the last five days, including pipes (SMQ690B), cigars or little cigars/cigarillos (SMQ690C), or hookahs/water pipes (SMQ690G, NHANES 2013–2016 only). We identified participants as non-smokers if they answered ‘no’ to NHANES question ‘Used any tobacco/nicotine product in the past 5 days?’ and had a serum cotinine concentration ≤ 10 ng/mL.
Figure 1.
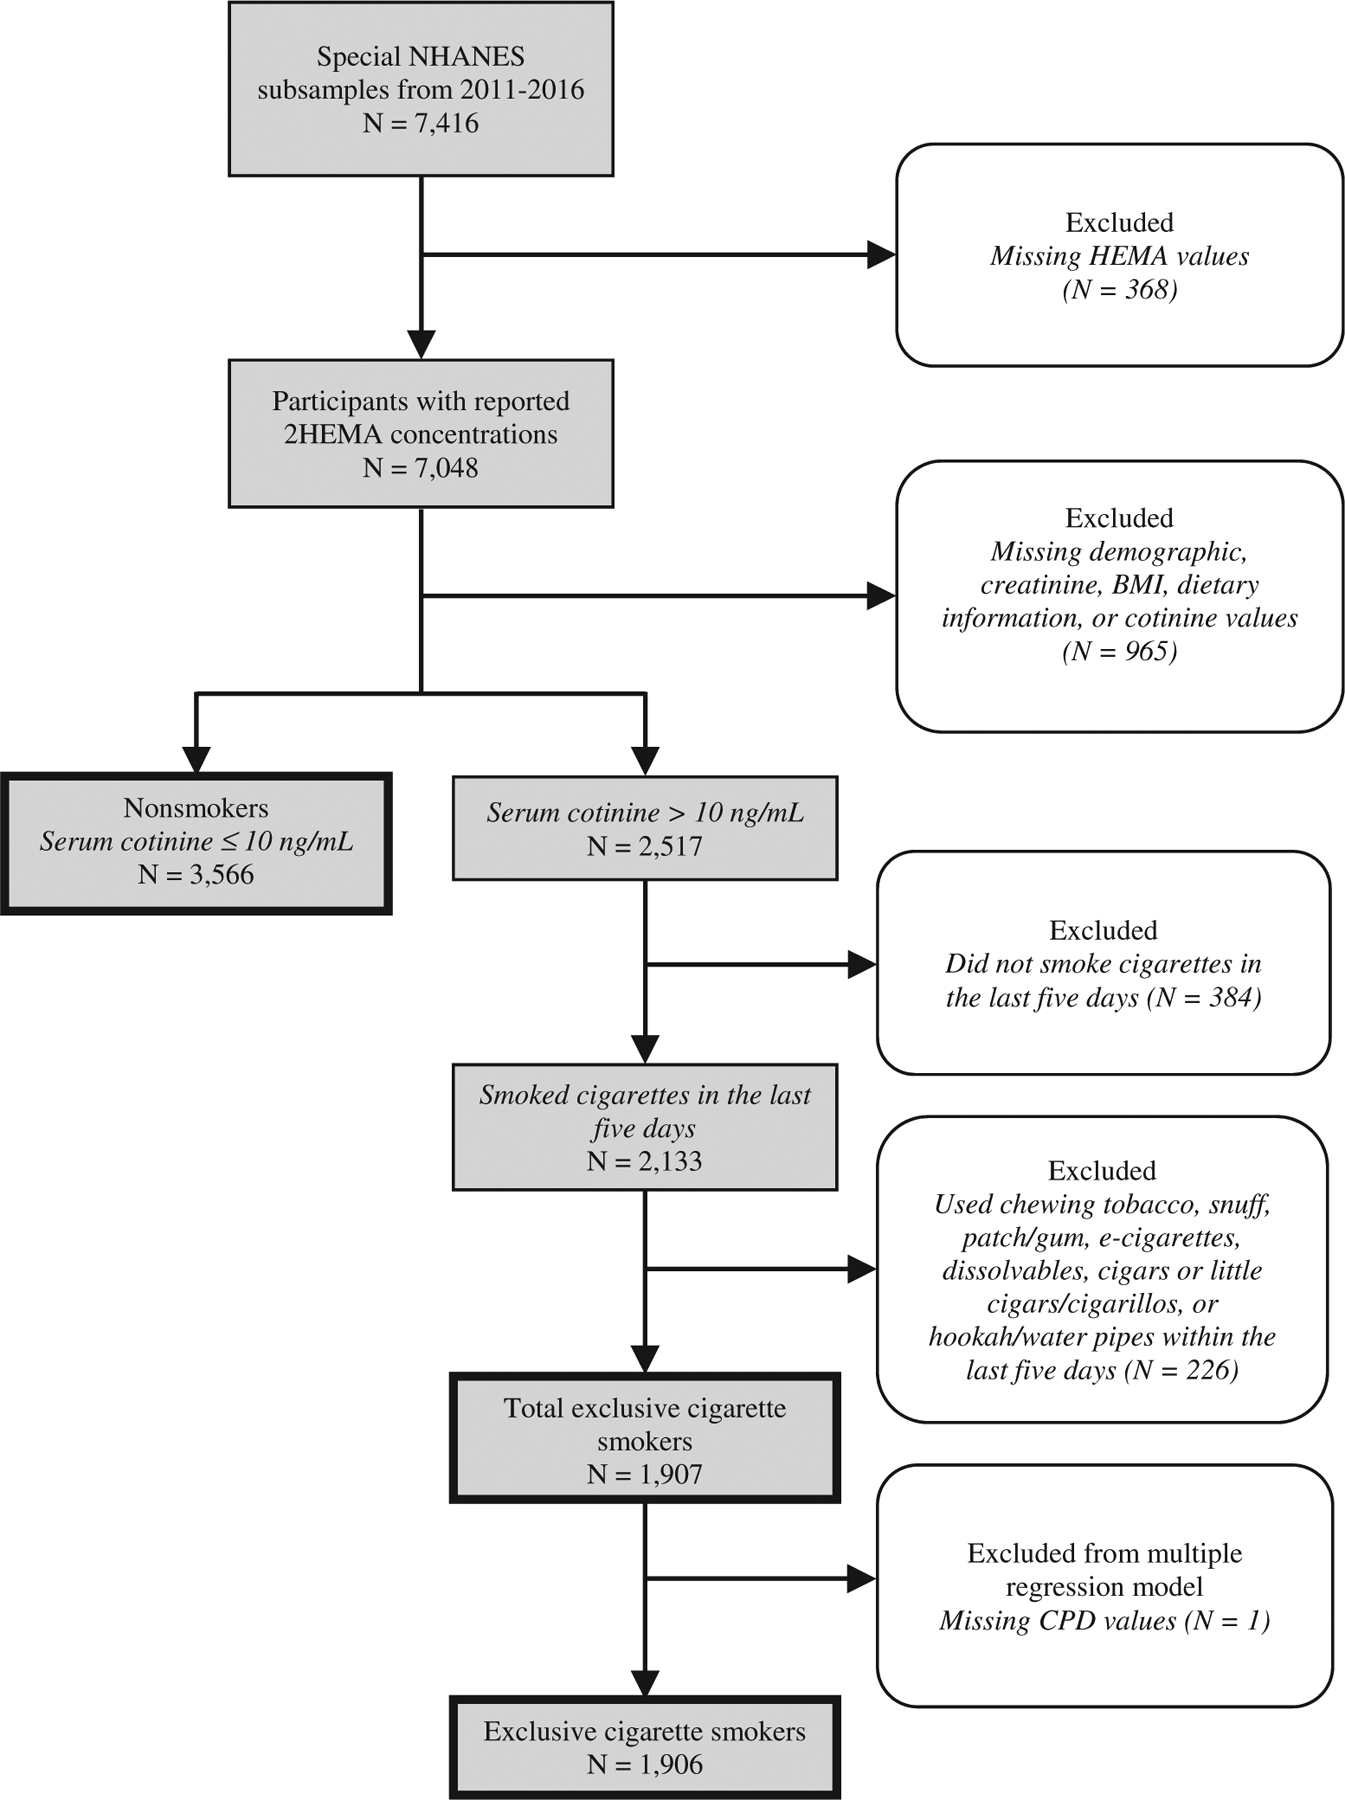
Flow chart of NHANES (2011–2016) samples.
We categorised age into the following ranges: 12–19, 20–39, 40–59, and ≥ 60 years. We calculated weight status based on body mass index (BMI) using measurements taken at the NHANES physical examination. Adults ≥ 20 years have standard definitions for underweight (BMI < 18.5 kg/m2), healthy weight (18.5 ≤ BMI < 25), and overweight/obesity (BMI ≥ 25). We classified participants younger than 20 years based on their BMI percentile for their sex and age: below the 5th percentile (underweight), between the 5th and 85th percentile (healthy weight), and above the 85th percentile (overweight/obesity).
Dietary data for the 24 h recall period were obtained from the NHANES Individual Foods – First Day file (NHANES dataset: DR1IFF). This file lists participant consumption of food, water, and beverages, which includes the mass reported consumed and an eight-digit USDA food code. Standardised hierarchical food groups can be identified from the USDA code, where the first digit represents one of nine major food groups, and each subsequent digit represents subgroups of increasing specificity (US Department of Agriculture 2019). We summed the mass consumed in each food group and represented each participant by a single record describing their dietary intake for the 24 h prior to the day they provided a urine sample as previously described (Bagchi et al. 2018, Biren et al. 2020, De Jesús et al. 2021, Kenwood et al. 2021, Nieto et al. 2021). We apportioned each participant’s dietary intake over nine food groups: milk products; meat and poultry; eggs; legumes, nuts, and seeds; grain products; fruits; vegetables; fats, oils and salad dressings; and sugars, sweets and beverages.
Out of 7,416 participants in the NHANES subsample from NHANES cycles 2011–2012, 2013–2014, and 2015–2016, we measured 2HEMA concentration in 7,048 samples (Figure 1). We also excluded participants with missing demographic, creatinine, BMI, dietary information, or cotinine values. Our criteria resulted in 3,566 non-smokers and 1,907 exclusive cigarette smokers. Finally, we excluded one exclusive cigarette smoker from our multiple regression models due a missing CPD value.
Measurement of urinary 2HEMA
We stored urine samples at −70 °C. We analyzed urine specimens collected during NHANES 2011–12 in 2013, and we analyzed specimens collected from NHANES 2013–14 and 2015–16 in 2018 (National Center for Health Statistics 2021a). Prior to sample preparation, we thawed the samples at room temperature using a thawing station (BioMicroLab, Concord, CA). We then mixed the samples on a rugged rotator (Glas-Col, Terre Haute, IN) for 15 min. We prepared the samples for analysis and measured urinary 2HEMA using ultra-high-performance liquid chromatography with tandem mass spectrometry (LC-MS/MS) as previously described (Alwis et al. 2012) by monitoring m/z 206.2 2 → 77.1 for 2HEMA and 210.2 → 81.1 for 2HEMA-d4. We calculated 2HEMA concentrations (ng/mL) using a standard calibration curve (response factor versus concentration, where the internal standard concentration is 1 ng/mL) with MultiQuant 3.0.3 (Sciex). The analytical limit of detection (LOD) for 2HEMA was 0.79 ng/mL, and we imputed measurements below the LOD by dividing the LOD by the square root of two (Hornung and Reed 1990). We used a quality assessment/quality control and proficiency testing (QA/QC and PT) program to ensure that our analytical results were consistent over time (De Jesús 2012), and our results met the accuracy and precision specifications of the quality control/quality assurance program of the CDC National Center for Environmental Health, Division of Laboratory Sciences (Caudill et al. 2008).
Statistical analysis
We evaluated statistical reliability to ensure all proportions follow the NCHS Data Presentation Standards (Parker et al. 2018), and our analysis considered the complex sampling design of NHANES. We determined the association between urinary 2HEMA (URXHEM) and self-reported cigarettes smoked per day (CPD) over the five days preceding the NHANES physical exam among exclusive cigarette smokers using a multiple linear regression model using SAS 9.4 (SAS Institutes, Cary, NC) which incorporated the complex survey design variable and special smoking subsample weights (WTFSM) as previously described (Biren et al. 2020, Kenwood et al. 2021). We excluded one participant who could not be assigned a CPD category. We expressed 2HEMA concentrations as μg/g creatinine (URXCUR) to normalize for participant hydration (Cone et al. 2009) in addition to ng/mL in our descriptive tables. Conversely, we included creatinine as an independent variable in regression models because creatinine concentrations may vary by demographic groups and body weight status (Barr et al. 2005). We classified exclusive cigarette smokers as having smoked 1–9 CPD, 10–19 CPD, and > 19 CPD. The reference category was participants who smoked 1–9 CPD. The model was fit with natural log transformed 2HEMA as the dependent variable and CPD, age, sex, race, body weight status, urine creatinine, and dietary intake as independent variables.
We performed an additional sample-weighted multiple regression analysis among exclusive cigarette smokers with the same independent variables, but cigarette smoke exposure was measured using serum cotinine instead of CPD (Biren et al. 2020). Serum cotinine is positively associated with CPD (Jain 2014), but unlike CPD, we assumed a linear association between serum cotinine and urinary 2HEMA concentrations. We log-transformed 2HEMA concentrations in both models to normalize the distribution of values, and calculated the percent change in 2HEMA associated with an independent variable using the Equation 1:
| (1) |
We also calculated the % change in 2HEMA associated with an increase of each dietary variable (kg/day) from zero to the 50th percentile of consumption by exponentiating the product of estimated median dietary consumption and the coefficient and treating the estimated quantity as a fixed value. This calculation can be expressed as Equation 2:
| (2) |
Results
Table 1 lists the distributions of the 1,907 exclusive cigarette smokers and 3,566 non-smokers (N = 5,473) in this study by age, sex, race/ethnic group, body weight status, and NHANES cycle. The analytical detection rates for 2HEMA among exclusive cigarette smokers and non-smokers were 85% and 40%, respectively. Figure 2 contains the distributions of 2HEMA concentrations among exclusive cigarette smokers and non-smokers. The median concentration of 2HEMA among exclusive cigarette smokers (2.54 ng/mL) was significantly different compared to non-smokers (< LOD, Wilcoxon rank-sum test, p < 0.0001). Table 2 contains the median sample-weighted urinary 2HEMA concentrations stratified by demographic groups. The creatinine-adjusted and non-adjusted median sample-weighted urinary 2HEMA concentrations among exclusive cigarette smokers were 2.79 μg/g creatinine and 2.54 ng/mL, respectively, and the sample-weighted median concentration of 2HEMA among non-smokers was less than LOD.
Table 1.
Distributions of study participants who were classified as exclusive cigarette smokers and non-smokers by age, sex, race/ethnic group, body weight status, and NHANES cycle for NHANES 2011–2012, 2013–2014, 2015–2016 (N = 5,473).a
| Independent variable | Nb, Exclusive cigarette smokers | Percent (SE)c, exclusive cigarette smokers | Nb, Non-smokers | Percent (SE)c, Non-smokers |
|---|---|---|---|---|
| Sex | ||||
| Male | 1,083 | 51.61 (1.50) | 1,660 | 45.59 (1.07) |
| Female | 824 | 48.39 (1.50) | 1,906 | 54.41 (1.07) |
| Age | ||||
| 12–19 | 32 | 1.66 (0.35) | 118 | 1.92 (0.26) |
| 20–39 | 689 | 38.33 (1.47) | 1,185 | 34.17 (1.35) |
| 40–59 | 756 | 41.99 (1.62) | 1,091 | 34.69 (1.20) |
| ≥60 | 430 | 18.02 (1.27) | 1,172 | 29.21 (1.28) |
| Race/Ethnicity | ||||
| Non-Hispanic White | 899 | 67.11 (3.01) | 1,305 | 66.03 (2.34) |
| Non-Hispanic Black | 505 | 14.38 (1.82) | 677 | 9.33 (1.08) |
| Hispanic | 316 | 11.66 (1.53) | 1,015 | 16.53 (1.72) |
| Other Race/Multi-RacialRacial | 187 | 6.85 (0.91) | 569 | 8.11 (0.69) |
| BMI | ||||
| Underweight | 58 | 3.00 (0.55) | 45 | 0.98 (0.16) |
| Healthy Weight | 624 | 33.19 (1.41) | 994 | 28.60 (1.38) |
| Overweight/ObesityObesity | 1,225 | 63.81 (1.43) | 2,527 | 70.42 (1.42) |
| NHANES Cycle | ||||
| 2011–2012 | 653 | 36.05 (2.29) | 1,116 | 32.52 (1.93) |
| 2013–2014 | 648 | 30.47 (2.06) | 1,213 | 32.67 (1.75) |
| 2015–2016 | 606 | 33.48 (1.85) | 1,237 | 34.82 (2.01) |
Same data as in serum cotinine regression models.
Not sample-weighted.
Sample-weighted.
Figure 2.
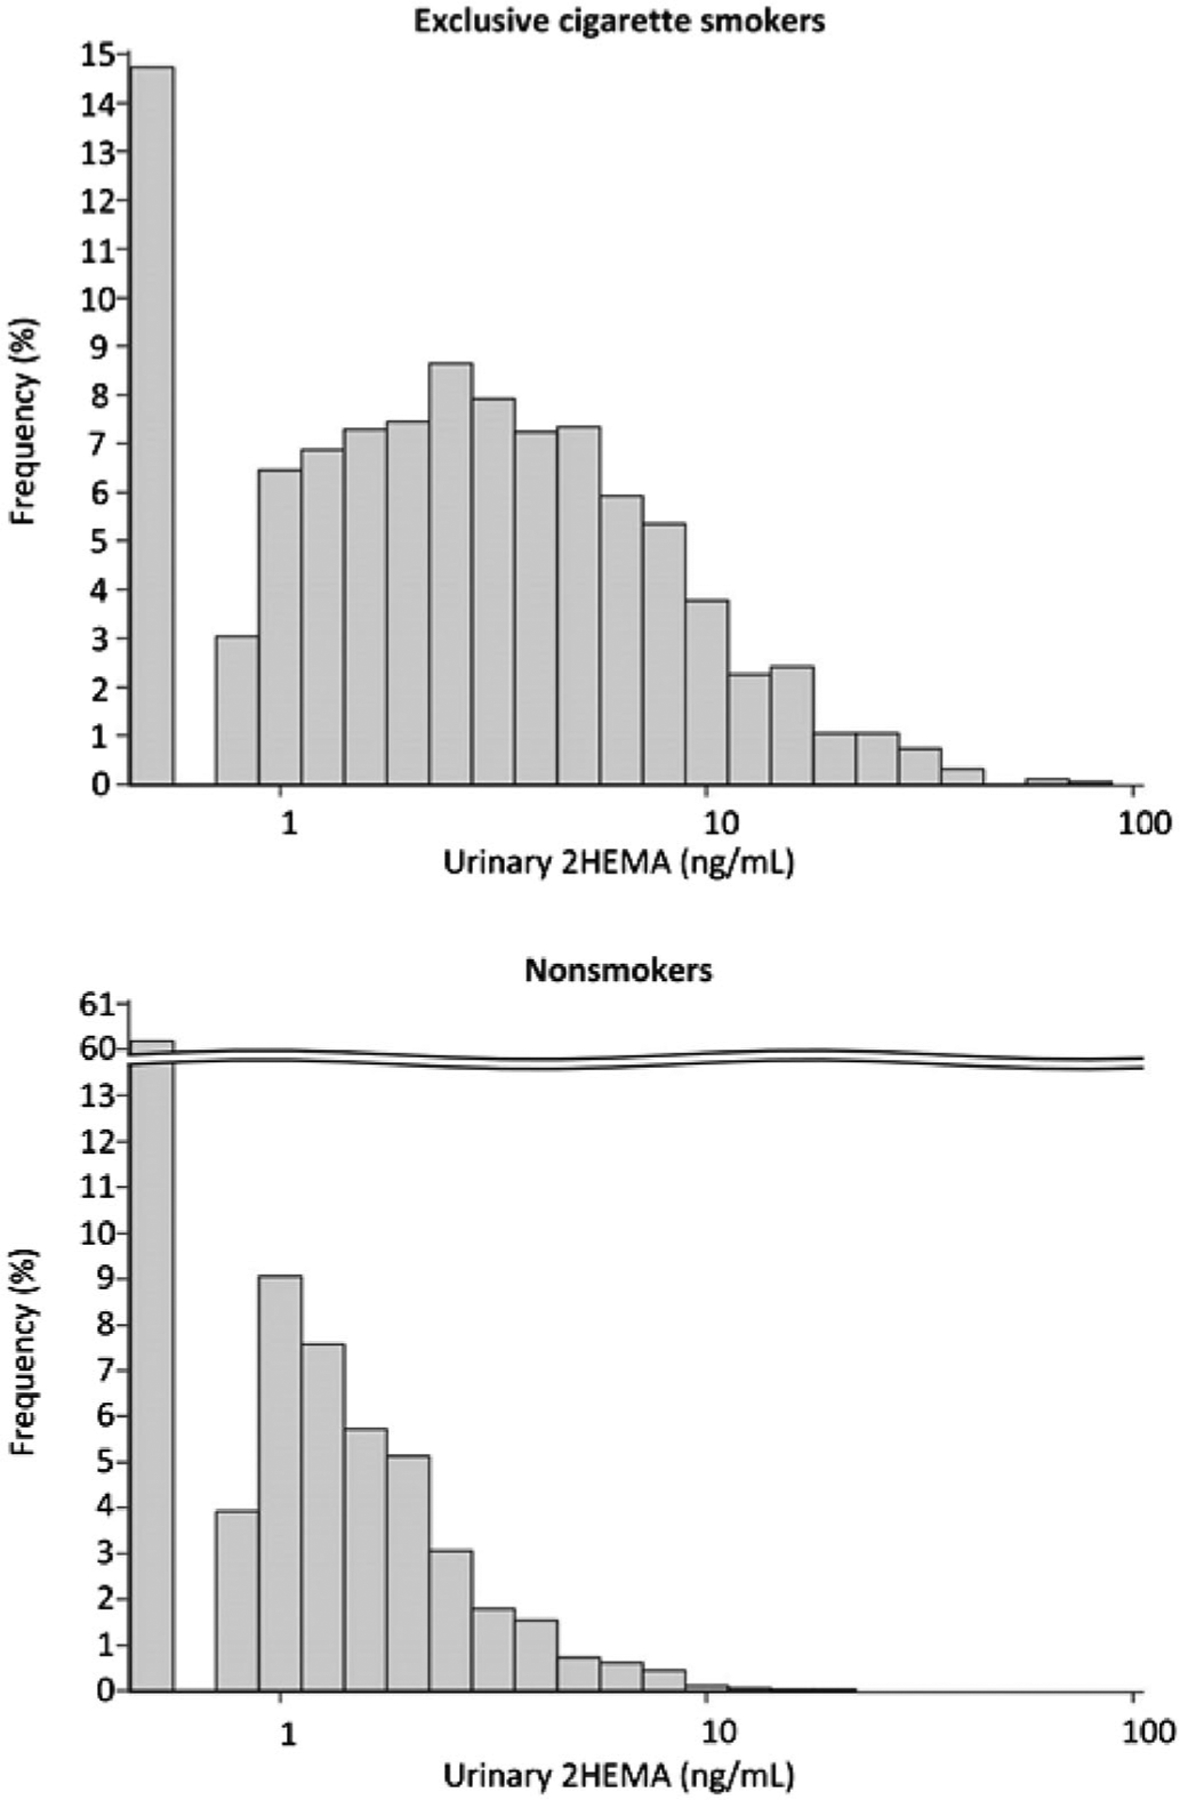
Urinary 2HEMA (ng/mL) distributions among nonsmokers (N = 3,566) and exclusive cigarette smokers (N = 1,907)1. Results < LOD are plotted as LOD/SQRT(2).1Not sample-weighted.
Table 2.
Median sample-weighted urinary 2HEMA concentrations [25th percentile, 75th percentile] among exclusive cigarette smokers from NHANES 2011–2012, 2013–2014, 2015–2016 (N = 5,473).
| Exclusive cigarette smokers | Non-smokers 2HEMA (ng/mL) | ||
|---|---|---|---|
| Demographic | 2HEMA (μg/g creatinine) | 2HEMA (ng/mL)a | |
| All | 2.79 [1.37, 5.39] | 2.54 [1.14, 5.11] | <LOD [<LOD, 1.14] |
| Sex | |||
| Male | 1.99 [1.05, 4.16] | 2.09 [0.948, 4.76] | <LOD [<LOD, 1.09] |
| Female | 3.67 [1.98, 6.41] | 2.87 [1.31, 5.62] | <LOD [<LOD, 1.22] |
| Age | |||
| 12–19 | 1.86 [0.771, 3.97] | 1.97 [0.905, 3.22] | <LOD [<LOD, 1.28] |
| 20–39 | 2.18 [1.24, 4.24] | 2.39 [1.11, 4.69] | <LOD [<LOD, 1.32] |
| 40–59 | 3.43 [1.67, 6.45] | 2.78 [1.26, 5.64] | <LOD [<LOD, 1.10] |
| ≥60 | 2.70 [1.39, 4.78] | 2.08 [0.978, 4.64] | <LOD [<LOD, 0.964] |
| Race/Ethnicity | |||
| Non-Hispanic White | 2.99 [1.60, 5.71] | 2.50 [1.10, 4.91] | <LOD [<LOD, 1.06] |
| Non-Hispanic Black | 2.04 [1.01, 4.18] | 2.72 [1.21, 5.93] | 0.813 [<LOD, 1.58] |
| Hispanic | 2.10 [1.09, 5.07] | 2.51 [1.26, 5.39] | <LOD [<LOD, 1.28] |
| Other Race/Multi-Racial | 2.74 [1.10, 5.10] | 2.49 [1.20, 4.53] | <LOD [<LOD, 1.05] |
| Weight Status | |||
| Underweight | 3.52 [2.03, 7.85] | 2.82 [1.39, 7.92] | <LOD [<LOD, 1.20] |
| Healthy Weight | 3.12 [1.58, 5.96] | 2.33 [1.04, 4.95] | <LOD [<LOD, 1.04] |
| Overweight/Obese | 2.41 [1.29, 4.86] | 2.57 [1.19, 5.14] | <LOD [<LOD, 1.18] |
| NHANES Cycle | |||
| 2011–2012 | 3.28 [1.66, 6.24] | 2.68 [1.18, 5.59] | <LOD [<LOD, 1.25] |
| 2013–2014 | 2.34 [1.17, 4.73] | 2.16 [1.00, 4.74] | <LOD [<LOD, 1.000] |
| 2015–2016 | 2.77 [1.38, 4.76] | 2.73 [1.26, 5.09] | <LOD [<LOD, 1.16] |
Same data as in regression models.
LOD: Limit of Detection = 0.79 ng/mL.
We further characterized the association between tobacco smoke exposure and urinary 2HEMA concentrations among exclusive cigarette smokers using two multiple linear regression models, which assessed cigarette smoking intensity using either cigarettes smoked per day (CPD, Table 3) or serum cotinine (Table 4). The multiple linear regression models controlled for other independent variables such as urinary creatinine, age, sex, race/ethnic group, and diet. We excluded non-smokers because of the relatively low detection rate (40%). Compared to participants who smoked 1–9 CPD, participants who smoked 10–19 CPD had 36% higher 2HEMA (p < 0.0001), and participants who smoked >19 CPD had 62% higher 2HEMA (p < 0.0001, Table 3). 2HEMA was also associated with serum cotinine among exclusive cigarette smokers (0.2% increase in 2HEMA per ng/mL cotinine, p < 0.0001, Table 4). No dietary independent variables were associated with higher urinary 2HEMA in either statistical model, however, consumption of Sugars, Sweets, and Beverages was associated with lower 2HEMA (p = 0.0013, Table 3 and p = 0.0107, Table 4).
Table 3.
Association between % (Δ 2HEMA) and CPD among exclusive cigarette smokers using multiple linear regression analysis of urinary 2HEMA (ng/mL) from NHANES 2011–2012, 2013–2014, 2015–2016 (N = 1,906).a
| Independent variable | Coefficient [95% CI]b | p-Value | Exponentiated slope [95% CI] | % (Δ 2HEMA)c,d,e |
|---|---|---|---|---|
| CPD | ||||
| 1–9 CPD | Reference | |||
| 10–19 CPD | 0.304 [0.192, 0.416] | <0.0001 | 1.36 [1.21, 1.52] | 36% higher |
| >19 CPD | 0.484 [0.344, 0.624] | <0.0001 | 1.62 [1.41, 1.87] | 62% higher |
| Creatinine, Urine [g/L] | 0.619 [0.537, 0.702] | <0.0001 | 1.86 [1.71, 2.02] | 86% higher per g/L creatinine |
| Sex | ||||
| Male | Reference | |||
| Female | 0.411 [0.292, 0.530] | <0.0001 | 1.51 [1.34, 1.70] | 51% higher |
| Age | ||||
| 12–19 | −0.161 [−0.557, 0.236] | 0.42 | 0.852 [0.573, 1.27] | N.S. |
| 20–39 | Reference | |||
| 40–59 | 0.187 [0.0599, 0.315] | 0.0049 | 1.21 [1.06, 1.37] | 21% higher |
| ≥60 | 0.0402 [−0.130, 0.210] | 0.6361 | 1.04 [0.878, 1.23] | N.S. |
| Race/Ethnicity | ||||
| Non-Hispanic White | Reference | |||
| Non-Hispanic Black | −0.0256 [−0.174, 0.123] | 0.7308 | 0.975 [0.840, 1.13] | N.S. |
| Hispanic | 0.173 [9.88E-03, 0.336] | 0.0381 | 1.19 [1.01, 1.40] | 19% higher |
| Other Race/Multi-Racial | −0.0218 [−0.236, 0.193] | 0.839 | 0.978 [0.790, 1.21] | N.S. |
| BMI | ||||
| Underweight | 0.0824 [−0.193, 0.358] | 0.5502 | 1.09 [0.824, 1.43] | N.S. |
| Healthy Weight | Reference | |||
| Overweight/Obesity | −0.112 [−0.256, 0.0313] | 0.1225 | 0.894 [0.775, 1.03] | N.S. |
| Diet (kg/day) | ||||
| Milk Products | 0.0187 [−0.164, 0.201] | 0.8373 | 1.02 [0.849, 1.22] | N.S. |
| Meat, Poultry | 0.0753 [−0.131, 0.282] | 0.4664 | 1.08 [0.877, 1.33] | N.S. |
| Eggs | 0.0564 [−1.03, 1.14] | 0.9173 | 1.06 [0.357, 3.14] | N.S. |
| Legumes, Nuts, Seeds | −0.140 [−0.763, 0.482] | 0.6522 | 0.869 [0.466, 1.62] | N.S. |
| Grain Products | −0.0285 [−0.228, 0.171] | 0.7745 | 0.972 [0.796, 1.19] | N.S. |
| Fruits | −0.177 [−0.389, 0.0353] | 0.1003 | 0.838 [0.678, 1.04] | N.S. |
| Vegetables | 0.0832 [−0.214, 0.380] | 0.5763 | 1.09 [0.807, 1.46] | N.S. |
| Fats, Oils, Salad Dressings | −0.418 [−3.14, 2.30] | 0.7584 | 0.658 [0.0435, 9.98] | N.S. |
| Sugars, Sweets, Beverages | −0.0452 [−0.0717, −0.0187] | 0.0013 | 0.956 [0.931, 0.981] | 4% lower |
| Intercept | −0.163 [−0.375, 0.0488] | 0.1282 | 0.850 [0.688, 1.05] | N/A |
We could not assign one exclusive cigarette smoker to a CPD category.
2HEMA concentrations were natural log transformed.
Calculated by multiplying the expected 2HEMA concentration by the exponentiated coefficient.
% (Δ 2HEMA) associated with each food group was calculated from median consumption.
Adjusted for all independent variables shown in the Table.
N.S.: Not significant.
CPD: Cigarettes per day.
Table 4.
Association between % (Δ 2HEMA) and serum cotinine (ng/mL) using multiple linear regression analysis of 2HEMA (ng/mL) among exclusive cigarette smokers (N = 1,907) in NHANES 2011–2012, 2013–2014, 2015–2016.
| Independent Variable | Coefficient [95% CI]a | p Value | Exponentiated slope [95% CI] | % (Δ 2HEMA)b,c,d |
|---|---|---|---|---|
| Creatinine, Urine [g/L] | 0.628 [0.542, 0.713] | <0.0001 | 1.87 [1.72, 2.04] | 87% higher per g/L creatinine |
| Cotinine, Serum [ng/mL] | 0.0023 [0.0019, 0.0027] | <0.0001 | 1.0023 [1.0019, 1.0027] | 0.2% higher per ng/mL cotinine |
| Sex | ||||
| Male | Reference | |||
| Female | 0.406 [0.300, 0.511] | <0.0001 | 1.50 [1.35, 1.67] | 50% higher |
| Age | ||||
| 12–19 | −0.060 [−0.473, 0.353] | 0.7699 | 0.941 [0.623, 1.42] | N.S. |
| 20–39 | Reference | |||
| 40–59 | 0.159 [0.0441, 0.2732] | 0.0077 | 1.17 [1.05, 1.31] | 17% higher |
| ≥60 | 0.0099 [−0.143, 0.163] | 0.8969 | 1.01 [0.867, 1.18] | N.S. |
| Race/Ethnicity | ||||
| Non-Hispanic White | Reference | |||
| Non-Hispanic Black | −0.233 [−0.377, −0.0877] | 0.0023 | 0.793 [0.686, 0.916] | 21% lower |
| Hispanic | 0.158 [0.0074, 0.3083] | 0.0402 | 1.17 [1.01, 1.36] | 17% higher |
| Other Race/Multi-Racial | −0.0467 [−0.266, 0.173] | 0.6701 | 0.954 [0.767, 1.19] | N.S. |
| BMI | ||||
| Underweight | 0.0068 [−0.251, 0.264] | 0.9579 | 1.01 [0.778, 1.30] | N.S. |
| Healthy Weight | Reference | |||
| Overweight/Obesity | −0.0339 [−0.162, 0.0941] | 0.5969 | 0.967 [0.851, 1.10] | N.S. |
| Dietary intake (kg/day) | ||||
| Milk Products | 0.0095 [−0.168, 0.187] | 0.9143 | 1.01 [0.846, 1.21] | N.S. |
| Meat, Poultry, Fish | 0.0161 [−0.204, 0.236] | 0.884 | 1.02 [0.815, 1.27] | N.S. |
| Eggs | 0.387 [−0.636, 1.409] | 0.4503 | 1.47 [0.530, 4.09] | N.S. |
| Legumes, Nuts, Seeds | −0.144 [−0.739, 0.450] | 0.6273 | 0.866 [0.478, 1.57] | N.S. |
| Grain Products | 0.023 [−0.177, 0.222] | 0.8189 | 1.02 [0.838, 1.25] | N.S. |
| Fruits | −0.148 [−0.360, 0.0647] | 0.1686 | 0.863 [0.698, 1.07] | N.S. |
| Vegetables | 0.107 [−0.216, 0.431] | 0.5079 | 1.11 [0.806, 1.54] | N.S. |
| Fats, Oils, Salad Dressings | −0.245 [−2.802, 2.312] | 0.848 | 0.783 [0.0607, 10.1] | N.S. |
| Sugars, Sweets, Beverages | −0.0367 [−0.0645, −0.0089] | 0.0107 | 0.964 [0.938, 0.991] | 4% lower |
| Intercept | −0.492 [−0.722, −0.263] | <0.0001 | 0.611 [0.486, 0.769] | N/A |
2HEMA concentrations were natural log transformed.
Calculated by multiplying the expected 2HEMA concentration by the exponentiated coefficient (controlling for other independent variables in the model).
% (Δ 2HEMA) associated with each food group was calculated from median consumption.
Adjusted for all independent variables shown in the Table.
N.S.: Not significant.
Both multiple linear regression models included additional variables such as NHANES cycle and demographics. 2HEMA concentrations were higher among females compared to males in both models, and 2HEMA was higher among Hispanics compared to non-Hispanic Whites in both models. Finally, 2HEMA was higher among participants aged 40–59 years compared to 20–39 year-olds in both models.
Discussion
This report characterizes urinary 2HEMA concentrations across exclusive cigarette smokers from NHANES 2011–2016, and these data demonstrate that cigarette smoke exposure is associated with higher urinary 2HEMA. CPD and serum cotinine were associated with higher urinary 2HEMA concentrations, which is in agreement with a previous analysis of acrylonitrile exposure among NHANES 2011–2016 participants using the urinary acrylonitrile biomarker 2-Cyanoethyl mercapturic acid (De Jesús et al. 2021). Together, these studies suggest that cigarette smoking is likely a major source of exposure to acrylonitrile and/or ethylene oxide.
We found that median urinary 2HEMA concentrations among exclusive cigarette smokers compare well with two previous assessments of urinary 2HEMA among smokers in the U.S. population, including NHANES III (1988–1994) (Calafat et al. 1999) and the Population Assessment of Tobacco and Health (PATH, Wave 1, 2013–2014) (De Jesús et al. 2020). The geometric mean concentrations of urinary 2HEMA among smokers in NHANES 1988–1994 (2.8 μg/g creatinine) and PATH (3.11 μg/g creatinine) were similar to the sample-weighted median 2HEMA we found among exclusive cigarette smokers in NHANES 2011–2016 (2.79 μg/g creatinine). Among the potential VOC exposure sources examined in this study (cigarette smoke and diet), cigarette smoke exposure was the only exposure source associated with higher 2HEMA. The consistency of our findings compared to previous assessments of 2HEMA in the U.S. population underscores the reliability of our analytical methods, and the strong association between cigarette smoking intensity and 2HEMA demonstrates the importance of cigarette smoke as a source of VOC exposure.
Both regression models found that 2HEMA was associated with sex and race/ethnicity among exclusive cigarette smokers. 2HEMA was higher among female smokers compared to male smokers, which is in agreement with NHANES 1988–1994 and PATH (Calafat et al. 1999, De Jesús et al. 2020), as well as results for other smoke VOC metabolites (Bagchi et al. 2018, Biren et al. 2020, De Jesús et al. 2020). 2HEMA was also higher among participants who were Hispanic compared to participants who were Non-Hispanic White. Interestingly, the acrylonitrile biomarker 2-Cyanoethyl mercapturic acid is not associated with sex or race/ethnicity among participants in NHANES 2011–2016 (De Jesús et al. 2021). Thus, the associations between 2HEMA and demographics may be due to metabolic differences between these groups or differences in exposures which were not considered in these analyses.
Assessing exposures based on urinary 2HEMA has certain limitations. Specifically, 2HEMA is a metabolite of multiple potentially harmful VOCs including vinyl chloride, which is found in PVC (Brandt-Rauf et al. 2012). However, vinyl chloride is an unlikely primary contributor to higher 2HEMA concentrations among smokers compared to non-smokers because the concentration of vinyl chloride in tobacco smoke is only 8 to 38 ng per cigarette (Todd et al. 2006). In contrast, the mainstream smoke from one cigarette contains 1–15 μg of acrylonitrile and approximately 7 μg of ethylene oxide (Hoffmann et al. 2001, Pazo et al. 2016). Additional precursors of 2HEMA include endogenously biosynthesized and exogenous ethylene due to its metabolism to ethylene oxide (Filser et al. 1993), and mono- and disubstituted ethane derivatives (Vermeulen et al. 1989). Thus, while the primary contributors to higher urinary 2HEMA are likely to be ethylene oxide and acrylonitrile, 2HEMA is an exposure biomarker for multiple potential precursors that may or may not be present in tobacco smoke. This study was also limited by a low non-sample-weighted analytical detection rate among non-smokers (40%). We applied a multianalyte LC-MS/MS method to measure small a volume of urine (50 μL), but more recent multianalyte LC-MS/MS methods developed during this study have a lower LOD (Pluym et al. 2015). Measuring urinary 2HEMA among NHANES participants using a more sensitive multianalyte LC-MS/MS method may result in a higher detection rate among non-smokers, and allow us to determine baseline concentrations of urinary 2HEMA among non-smokers that may largely be due to endogenous ethylene biosynthesis (Kirman et al. 2021) and characterize the association between 2HEMA and diet among non-smokers. However, we did not find any dietary variables that were associated with higher 2HEMA among exclusive cigarette smokers in both statistical models, which suggests that diet is not a major source of exposure to 2HEMA parent chemicals. Interestingly, median consumption of the dietary category Sugars, Sweets, and Beverages was associated with slightly lower 2HEMA concentrations in both regression models; however, the magnitude of this association was relatively minor (4%).
Characterizing the associations between 2HEMA and cigarette smoking is critical for determining the utility of 2HEMA for assessing ethylene oxide exposure related to industrial applications such as medical equipment sterilization. Despite the limitations of this study, this report provides public health researchers a recent and comprehensive population-based assessment of 2HEMA concentrations in the U.S. population, and is the most thorough characterization of the association between 2HEMA and cigarette smoke exposure to date. Ethylene oxide exposure assessments may require rapid response studies of large numbers of potentially exposed people. Such studies could benefit by measuring urinary 2HEMA to understand recent ethylene oxide exposure, as urinary 2HEMA concentrations return to baseline levels within three days (Carmella et al. 2009) compared with measuring stable ethylene oxide haemoglobin adducts, which have a biological half-life dependent on erythrocyte lifespan and reflects exposure over the preceding four months (Kautiainen and Törnqvist 1991, Bono et al. 2005, Yang et al. 2018). This analysis demonstrates that cigarette smoking is associated with higher urinary 2HEMA concentrations and thus could confound long-term and rapid response biomonitoring studies of exposure to other 2HEMA parent chemicals.
Acknowledgements
The authors thank the Volatile Organic Compound Metabolites Team, Tobacco and Volatiles Branch, Centers for Disease Control and Prevention for measuring 2HEMA in urine specimens from NHANES participants. The findings and conclusions in this report are those of the authors and do not necessarily represent the official position of the Centers for Disease Control and Prevention.
Footnotes
Publisher's Disclaimer: Disclaimer: The findings and conclusions in this report are those of the authors and do not necessarily represent the official position of the Centers for Disease Control and Prevention.
Disclosure statement
The authors report no declarations of interest.
Data availability statement
The NHANES data that support the findings of this study are available through the NHANES Questionnaires, Datasets, and Related Documentation (National Center for Health Statistics 2021b). These data are available in the public domain and can be found by searching the variable name (e.g. URXHEM for 2HEMA) through the Variable Keyword Search. We used 2HEMA concentrations from the datafiles UVOCS_G (2011–2012), UVOCS_H (2013–2014), and UVOCS_I (2015–2016).
References
- Alwis KU, et al. , 2012. Simultaneous analysis of 28 urinary VOC metabolites using ultra high performance liquid chromatography coupled with electrospray ionization tandem mass spectrometry (UPLC-ESI/MSMS). Analytica chimica acta, 750, 152–160. [DOI] [PMC free article] [PubMed] [Google Scholar]
- ASTDR. 2020. Toxicological profile for ethylene oxide. ATSDR’s Toxicological Profiles. [Google Scholar]
- Bader M, Lewalter J, and Angerer J, 1995. Analysis of N-alkylated amino acids in human hemoglobin: evidence for elevated N-methylvaline levels in smokers. International archives of occupational and environmental health, 67 (4), 237–242. [DOI] [PubMed] [Google Scholar]
- Bagchi P, et al. , 2018. Crotonaldehyde exposure in U.S. tobacco smokers and nonsmokers: NHANES 2005–2006 and 2011–2012. Environmental research, 163, 1–9. [DOI] [PMC free article] [PubMed] [Google Scholar]
- Barr DB, et al. , 2005. Urinary creatinine concentrations in the U.S. population: implications for urinary biologic monitoring measurements. Environmental health perspectives, 113 (2), 192–200. [DOI] [PMC free article] [PubMed] [Google Scholar]
- Benowitz NL, et al. , 2009. Optimal serum cotinine levels for distinguishing cigarette smokers and nonsmokers within different racial/ethnic groups in the United States between 1999 and 2004. American journal of epidemiology, 169 (2), 236–248. [DOI] [PubMed] [Google Scholar]
- Bergmark E, 1997. Hemoglobin adducts of acrylamide and acrylonitrile in laboratory workers, smokers and nonsmokers. Chemical research in toxicology, 10 (1), 78–84. [DOI] [PubMed] [Google Scholar]
- Biren C, et al. , 2020. Isoprene exposure in the United States based on urinary IPM3: NHANES 2015–2016. Environmental science & technology, 54 (4), 2370–2378. [DOI] [PMC free article] [PubMed] [Google Scholar]
- Bono R, et al. , 1999. Formation of N-(2-hydroxyethyl)valine due to exposure to ethylene oxide via tobacco smoke: a risk factor for onset of cancer. Environmental research, 81 (1), 62–71. [DOI] [PubMed] [Google Scholar]
- Bono R, et al. , 2005. Cotinine and N-(2-hydroxyethyl)valine as markers of passive exposure to tobacco smoke in children. Journal of exposure analysis and environmental epidemiology, 15 (1), 66–73. [DOI] [PubMed] [Google Scholar]
- Brandt-Rauf PW, et al. , 2012. Plastics and carcinogenesis: the example of vinyl chloride. Journal of carcinogenesis, 11, 5. [DOI] [PMC free article] [PubMed] [Google Scholar]
- Calafat AM, et al. , 1999. Reference range concentrations of N-acetyl-S-(2-hydroxyethyl)-L-cysteine, a common metabolite of several volatile organic compounds, in the urine of adults in the United States. Journal of exposure analysis and environmental epidemiology, 9 (4), 336–342. [DOI] [PubMed] [Google Scholar]
- Capella KM, et al. , 2019. Ethylbenzene and styrene exposure in the United States based on urinary mandelic acid and phenylglyoxylic acid: NHANES 2005–2006 and 2011–2012. Environmental research, 171, 101–110. [DOI] [PMC free article] [PubMed] [Google Scholar]
- Carmella SG, et al. , 2009. Effects of smoking cessation on eight urinary tobacco carcinogen and toxicant biomarkers. Chemical research in toxicology, 22 (4), 734–741. [DOI] [PMC free article] [PubMed] [Google Scholar]
- Caudill SP, Schleicher RL, and Pirkle JL, 2008. Multi-rule quality control for the age-related eye disease study. Statistics in medicine, 27 (20), 4094–4106. [DOI] [PubMed] [Google Scholar]
- Chen M, et al. , 2019. Longitudinal stability in cigarette smokers of urinary biomarkers of exposure to the toxicants acrylonitrile and acrolein. PLoS one, 14 (1), e0210104–13. [DOI] [PMC free article] [PubMed] [Google Scholar]
- Cole P, Mandel JS, and Collins JJ, 2008. Acrylonitrile and cancer: a review of the epidemiology. Regulatory toxicology and pharmacology: RTP, 52 (3), 342–351. [DOI] [PubMed] [Google Scholar]
- Cone EJ, et al. , 2009. Normalization of urinary drug concentrations with specific gravity and creatinine. Journal of analytical toxicology, 33 (1), 1–7. [DOI] [PubMed] [Google Scholar]
- Darrall KG, et al. , 1998. Determination of benzene and associated volatile compounds in mainstream cigarette smoke. The analyst, 123 (5), 1095–1101. [DOI] [PubMed] [Google Scholar]
- De Jesús VR, 2012. Laboratory procedure manual: Volatile Organic Compounds (VOCs) metabolites [online]. The National Center for Health Statistics. Available from: https://wwwn.cdc.gov/nchs/data/nhanes/2013-2014/labmethods/UVOC_H_MET.pdf [Accessed 20 Jul 2021]. [Google Scholar]
- De Jesús VR, et al. , 2020. Urinary biomarkers of exposure to volatile organic compounds from the population assessment of tobacco and health study wave 1 (2013–2014). International journal of environmental research and public health, 17 (15), 1–12. [DOI] [PMC free article] [PubMed] [Google Scholar]
- De Jesús VR, et al. , 2021. Characterization of acrylonitrile exposure in the United States based on urinary n-acetyl-S-(2-cyanoethyl)-l-cysteine (2CYEMA): NHANES 2011–2016. Journal of exposure science & environmental epidemiology, 31 (2), 377–385. [DOI] [PMC free article] [PubMed] [Google Scholar]
- Fennell TR, et al. , 2000. Hemoglobin adducts from acrylonitrile and ethylene oxide in cigarette smokers: effects of glutathione s-transfer-ase T1-null and M1-null genotypes. Cancer epidemiology biomarkers and prevention, 9 (7), 705–712. [PubMed] [Google Scholar]
- Filser JG, et al. , 1993. Pharmacokinetics of ethylene in man; body burden with ethylene oxide and hydroxyethylation of hemoglobin due to endogenous and environmental ethylene. Archives of toxicology, 67 (3), 230–230. [DOI] [PubMed] [Google Scholar]
- Hoffmann D, Hoffmann I, and El-Bayoumy K, 2001. The less harmful cigarette: a controversial issue. A tribute to Ernst L. Wynder. Chemical research in toxicology, 14 (7), 767–790. [DOI] [PubMed] [Google Scholar]
- Hornung RW, and Reed LD, 1990. Estimation of average concentration in the presence of nondetectable values. Applied occupational and environmental hygiene, 5 (1), 46–51. [Google Scholar]
- Jain RB, and Bernert JT, 2010. Effect of body mass index and total blood volume on serum cotinine levels among cigarette smokers: NHANES 1999–2008. Clinica chimica acta, 411 (15–16), 1063–1068. [DOI] [PubMed] [Google Scholar]
- Jain RB, 2014. Trends in serum cotinine concentrations among daily cigarette smokers: data from NHANES 1999–2010. The science of the total environment, 472, 72–77. [DOI] [PubMed] [Google Scholar]
- Jain RB, 2015. Distributions of selected urinary metabolites of volatile organic compounds by age, gender, race/ethnicity, and smoking status in a representative sample of U.S. adults. Environmental toxicology and pharmacology, 40 (2), 471–479. [DOI] [PubMed] [Google Scholar]
- Jinot J, et al. , 2018. Carcinogenicity of ethylene oxide: key findings and scientific issues. Toxicology mechanisms and methods, 28 (5), 386–396. [DOI] [PMC free article] [PubMed] [Google Scholar]
- Kautiainen A, and Törnqvist M, 1991. Monitoring exposure to simple epoxides and alkenes through gas chromatographic determination of hemoglobin adducts. International archives of occupational and environmental health, 63 (1), 27–31. [DOI] [PubMed] [Google Scholar]
- Kenwood BM, et al. , 2021. Characterization of US population levels of urinary methylcarbamoyl mercapturic acid, a metabolite of N,N-dime-thylformamide and methyl isocyanate, in the National Health and Nutrition Examination Survey (NHANES) 2005–2006 and 2011–2016. Environmental science and pollution research, 28 (13), 16781–16791. [DOI] [PMC free article] [PubMed] [Google Scholar]
- Kirman CR, et al. , 2005. Cancer dose-response assessment for acrylonitrile based upon rodent brain tumor incidence: use of epidemio-logic, mechanistic, and pharmacokinetic support for nonlinearity. Regulatory toxicology and pharmacology: RTP, 43 (1), 85–103. [DOI] [PubMed] [Google Scholar]
- Kirman CR, et al. , 2021. Ethylene oxide review: characterization of total exposure via endogenous and exogenous pathways and their implications to risk assessment and risk management. Journal of toxicology and environmental health. Part B, critical reviews, 24 (1), 1–29. [DOI] [PubMed] [Google Scholar]
- Luo X, et al. , 2020. Urinary cyanoethyl mercapturic acid, a biomarker of the smoke toxicant acrylonitrile, clearly distinguishes smokers from nonsmokers. Nicotine & tobacco research, 22 (10), 1744–1747. [DOI] [PMC free article] [PubMed] [Google Scholar]
- Mendes GCC, Brandão TRS, and Silva CLM, 2007. Ethylene oxide sterilization of medical devices: a review. American journal of infection control, 35 (9), 574–581. [DOI] [PubMed] [Google Scholar]
- Müller M, et al. , 1998. Ethylene oxide-protein adduct formation in humans: influence of glutathione-S-transferase polymorphisms. International archives of occupational and environmental health, 71 (7), 499–502. [DOI] [PubMed] [Google Scholar]
- National Center for Health Statistics. 2021a. National Health and Nutrition Examination Survey [online]. The National Center for Health Statistics. Available from: https://www.cdc.gov/nchs/nhanes/index.htm. [Google Scholar]
- National Center for Health Statistics. 2021b. NHANES questionnaires, data-sets, and related documentation [online]. Available from: https://wwwn.cdc.gov/nchs/nhanes/search/default.aspx.
- NCHS Research Ethics Review Board (ERB) Approval. 2017. National Center for Health Statistics, Centers for Disease Control and Prevention. Available from: https://www.cdc.gov/nchs/nhanes/irba98.htm#:~:text=NCHSResearchEthicsReviewBoard%28ERB%29Approval%2A%2A,2017Contentsource%3A [Accessed 10 Jul 2020].
- Nieto A, et al. , 2021. Exposure to 1,3-butadiene in the U.S. population: National Health and Nutrition Examination Survey 2011–2016. Biomarkers: biochemical indicators of exposure, response, and susceptibility to chemicals, 26 (4), 371–383. [DOI] [PMC free article] [PubMed] [Google Scholar]
- Olaguer EP, et al. , 2020. Ethylene oxide exposure attribution and emissions quantification based on ambient air measurements near a sterilization facility. International journal of environmental research and public health, 17 (1), 42. [DOI] [PMC free article] [PubMed] [Google Scholar]
- Parker JD, et al. , 2018. Vital and health statistics national center for health statistics data presentation standards for proportions. The national center for health statistics, 2 (175), 1–14. [PubMed] [Google Scholar]
- Pazo DY, et al. , 2016. Mainstream smoke levels of volatile organic compounds in 50 U.S. domestic cigarette brands smoked with the ISO and Canadian intense protocols. Nicotine & tobacco research, 18 (9), 1886–1894. [DOI] [PMC free article] [PubMed] [Google Scholar]
- Pirkle JL, et al. , 1996. Exposure of the US population to environmental tobacco smoke: the third national health and nutrition examination survey, 1988 to 1991. JAMA, 275 (16), 1233–1240. [PubMed] [Google Scholar]
- Pluym N, et al. , 2015. Analysis of 18 urinary mercapturic acids by two high-throughput multiplex-LC-MS/MS methods. Analytical and bioanalytical chemistry, 407 (18), 5463–5476. [DOI] [PubMed] [Google Scholar]
- Scherer G, et al. , 2007. Relationship between machine-derived smoke yields and biomarkers in cigarette smokers in Germany. Regulatory toxicology and pharmacology, 47 (2), 171–183. [DOI] [PubMed] [Google Scholar]
- Schettgen T, et al. , 2002. Hemoglobin adducts of ethylene oxide, propylene oxide, acrylonitrile and acrylamide-biomarkers in occupational and environmental medicine. Toxicology letters, 134 (1–3), 65–70. [DOI] [PubMed] [Google Scholar]
- Szwiec E, Friedman L, and Buchanan S, 2020. Levels of ethylene oxide biomarker in an exposed residential community. International journal of environmental research and public health, 17 (22), 8646–8647. [DOI] [PMC free article] [PubMed] [Google Scholar]
- Tates AD, et al. , 1991. Biological and chemical monitoring of occupational exposure to ethylene oxide. Mutation research, 250 (1–2), 483–497. [DOI] [PubMed] [Google Scholar]
- Tavares R, et al. , 1996. Monitoring of exposure to acrylonitrile by determination of N-(2-cyanoethyl)valine at the N-terminal position of haemoglobin. Carcinogenesis, 17 (12), 2655–2660. [DOI] [PubMed] [Google Scholar]
- Tavares R, et al. , 1994. Transplacental exposure to genotoxins. Evaluation in haemoglobin of hydroxyethylvaline adduct levels in smoking and non-smoking mothers and their newborns. Carcinogenesis, 15 (6), 1271–1274. [DOI] [PubMed] [Google Scholar]
- Todd GD, et al. , 2006. Toxicological profile for vinyl chloride. Agency for Toxic Substances and Disease Registry. Available from: https://wwwn.cdc.gov/TSP/ToxProfiles/ToxProfiles.aspx?id=282&tid=51. [PubMed] [Google Scholar]
- Törnqvist M, et al. , 1986. Tissue doses of ethylene oxide in cigarette smokers determined from adduct levels in hemoglobin. Carcinogenesis, 7 (9), 1519–1521. [DOI] [PubMed] [Google Scholar]
- US Department of Agriculture. 2019. Food and Nutrient Database for Dietary Studies (FNDDS) [online]. Food Surveys Research Group, Beltsville Human Nutrition Research Center. Available from: https://data.nal.usda.gov/dataset/food-and-nutrient-database-dietary-studies-fndds. [Google Scholar]
- Vermeulen NPE, et al. , 1989. N-acetyl-S-(2-hydroxyethyl)-L-cysteine as a potential tool in biological monitoring studies? A critical evaluation of possibilities and limitations Archives of toxicology, 63 (3), 173–184. [DOI] [PubMed] [Google Scholar]
- Von Stedingk H, et al. , 2011. Analysis of hemoglobin adducts from acryl-amide, glycidamide, and ethylene oxide in paired mother/cord blood samples from Denmark. Chemical research in toxicology, 24 (11), 1957–1965. [DOI] [PubMed] [Google Scholar]
- Yang M, et al. , 2018. High-throughput, simultaneous quantitation of hemoglobin adducts of acrylamide, glycidamide, and ethylene oxide using UHPLC-MS/MS ?. Journal of chromatography. B, analytical technologies in the biomedical and life sciences, 1086, 197–205. [DOI] [PubMed] [Google Scholar]
- Zhang X, et al. , 2014. Simultaneous determination of five mercapturic acid derived from volatile organic compounds in human urine by LC-MS/MS and its application to relationship study. Journal of chromatography b, 967, 102–109. [DOI] [PubMed] [Google Scholar]
Associated Data
This section collects any data citations, data availability statements, or supplementary materials included in this article.
Data Availability Statement
The NHANES data that support the findings of this study are available through the NHANES Questionnaires, Datasets, and Related Documentation (National Center for Health Statistics 2021b). These data are available in the public domain and can be found by searching the variable name (e.g. URXHEM for 2HEMA) through the Variable Keyword Search. We used 2HEMA concentrations from the datafiles UVOCS_G (2011–2012), UVOCS_H (2013–2014), and UVOCS_I (2015–2016).