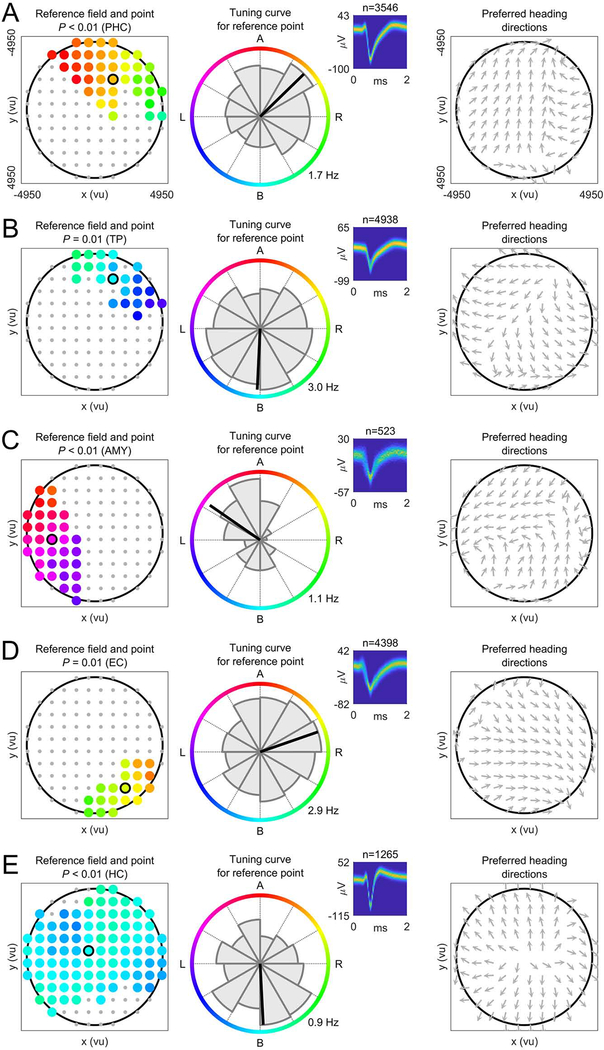
Figure 2. Egocentric bearing cells encode egocentric directions towards local reference points.
(A to E) Example EBCs. Left column, EBC plot showing the reference field (colored dots) and the reference point (colored dot with black circle). Coloring, preferred egocentric bearing towards each location of the reference field (see colored circle in the middle column). Gray dots, candidate reference points without significant tuning. P-value, significance from cluster-based permutation test. Middle column, tuning curve showing how the cell’s firing rate varies as a function of egocentric bearing towards the reference point (maximum firing rate at bottom right). Colored circle indicates egocentric bearing. Inset, spike shapes as density plot (number above inset indicates spike count); yellow, maximum; blue, 0. Right column, vector-field map showing the cell’s preferred allocentric heading direction across the environment (gray arrows). Large black circles, environmental boundary. A (B; L; R), reference point ahead (behind; to the left; to the right) of the subject. ms, milliseconds; μV, microvolt. AMY, amygdala; EC, entorhinal cortex; HC, hippocampus; PHC, parahippocampal cortex; TP, temporal pole.

