Abstract
Background and Aims
Cholangiocarcinoma (CCA) is characterized by high resistance to chemotherapy and poor prognosis. Several oncogenic pathways converge on activation of extracellular signal‐regulated kinase 5 (ERK5), whose role in CCA has not been explored. The aim of this study was to investigate the role of ERK5 in the biology of CCA.
Approach and Results
ERK5 expression was detected in two established (HuCCT‐1 and CCLP‐1) and two primary human intrahepatic CCA cell lines (iCCA58 and iCCA60). ERK5 phosphorylation was increased in CCA cells exposed to soluble mediators. In both HuCCT‐1 and CCLP‐1 cells, ERK5 was localized in the nucleus, and exposure to fetal bovine serum (FBS) further increased the amount of nuclear ERK5. In human CCA specimens, ERK5 mRNA expression was increased in tumor cells and positively correlated with portal invasion. ERK5 protein levels were significantly associated with tumor grade. Growth, migration, and invasion of CCA cells were decreased when ERK5 was silenced using specific short hairpin RNA (shRNA). The inhibitory effects on CCA cell proliferation, migration and invasion were recapitulated by treatment with small molecule inhibitors targeting ERK5. In addition, expression of the angiogenic factors VEGF and angiopoietin 1 was reduced after ERK5 silencing. Conditioned medium from ERK5‐silenced cells had a lower ability to induce tube formation by human umbilical vein endothelial cells and to induce migration of myofibroblasts and monocytes/macrophages. In mice, subcutaneous injection of CCLP‐1 cells silenced for ERK5 resulted in less frequent tumor development and smaller size of xenografts compared with cells transfected with nontargeting shRNA.
Conclusions
ERK5 is a key mediator of growth and migration of CCA cells and supports a protumorigenic crosstalk between the tumor and the microenvironment.
Abbreviations
- BrdU
bromodeoxyuridine
- CCA
cholangiocarcinoma
- CM
conditioned medium
- EGFR
epidermal growth factor receptor
- EMT
epithelial‐to‐mesenchymal transition
- ERK5
extracellular signal‐regulated kinase 5
- FBS
fetal bovine serum
- HUVEC
human umbilical vein endothelial cell
- iCCA
intrahepatic cholangiocarcinoma
- IHC
immunohistochemistry
- miR
microRNA
- MTT
3‐(4,5‐dimethylthiazol‐2‐yl)‐2,5‐diphenyltetrazolium bromide
- NHC
normal human cholangiocyte
- shERK5
shRNA targeting ERK5
- shNT
nontargeting short hairpin RNA
- shRNA
short hairpin RNA
- TME
tumor microenvironment
Cholangiocarcinoma (CCA) is a fatal tumor characterized by late diagnosis, poor prognosis, and low response to available therapies.( 1 ) Its incidence, at least for the intrahepatic form (iCCA) is markedly increasing, especially in Western countries.( 2 ) The aggressive properties of this tumor are associated with the development of an abundant desmoplastic stroma, containing a high amount of cancer‐associated fibroblasts and extracellular matrix.( 3 ) Development of CCA and tumor‐stroma interactions are regulated by a complex network of soluble mediators, interacting with specific receptors.( 3 , 4 , 5 ) Among them, the epidermal growth factor receptor (EGFR) plays an important role in the biology of cancer,( 6 ) including CCA.( 7 , 8 ) EGFR and other mediators activate different members of the mitogen‐activated protein kinase family,( 9 ) including extracellular signal‐regulated kinase 5 (ERK5).( 10 , 11 ) ERK5 shares approximately 50% homology with ERK1/2, whereas its unique C‐terminal tail contains a nuclear localization signal that allows nuclear translocation, a critical event for cell proliferation.( 12 ) ERK5 induces biological responses relevant for tumor development and progression,( 12 ) and its activation is increased in highly aggressive forms of breast and prostate cancer,( 13 , 14 ) suggesting that targeting ERK5 could be a promising strategy to block tumor growth and spreading.( 12 ) Our group has recently shown that ERK5 supports HCC development and growth.( 15 ) Here, we show that ERK5 expression and activation regulate the malignant phenotype of CCA cells, modulate the crosstalk between cancer cells and the tumor microenvironment (TME), and favor the development and growth of CCA in mouse xenografts.
Materials and Methods
Database of Patients With CCA
The GSE26566 series matrix containing expression values from Illumina human Ref‐8 v2.0 expression BeadChip arrays (transcript [gene] version) of 104 patients with CCA was downloaded from the Gene Expression Omnibus dataset.( 16 ) The samples were obtained and processed in accordance to institutional review board approval and with individual written patient consent.( 16 ) No donor organs were obtained from executed prisoners or other institutionalized persons. Further information is provided in the Supporting Information.
Immunohistochemistry
Immunohistochemistry (IHC) was performed on tissue microarrays (US Biomax, Inc., http://www.biomax.us) of formalin‐fixed, paraffin‐embedded specimens of CCA samples using the molecular medicine facility, as detailed elsewhere( 15 ) and in the Supporting Information.
Immunoblotting Analysis and Nuclear Extraction
Total cell lysates, nuclear extracts, and immunoblotting were performed as detailed elsewhere( 15 ) and in the Supporting Information.
Cell Proliferation, Cell Survival, and Cell Cycle Analysis
Bromodeoxyuridine (BrdU) incorporation, 3‐(4,5‐dimethylthiazol‐2‐yl)‐2,5‐diphenyltetrazolium bromide (MTT) assay, and cell cycle experiments were performed as described elsewhere.( 5 , 15 ) Further information is provided in the Supporting Information.
RNA Isolation and Real‐Time Quantitative PCR
Total RNA was isolated using the RNeasy kit (QIAGEN Sciences) according to the manufacturer’s recommendations. Relative gene expression was calculated as 2−ΔCt (ΔCt = Ct of the target gene minus Ct of glyceraldehyde 3‐phosphate dehydrogenase).( 5 ) Further information is provided in the Supporting Information.
RNA Interference Transfection Assay
RNA interference was performed as described.( 15 ) Further information is provided in the Supporting Information.
Migration and Invasion Assays
Migration of CCA cells was assayed using modified Boyden chambers, essentially as described elsewhere.( 5 ) Further information is provided in the Supporting Information.
Human Umbilical Vein Endothelial Cell Assay
Human umbilical vein endothelial cell (HUVEC; kindly provided by Prof. Mario Del Rosso, Experimental Pathology, University of Florence) were seeded onto Matrigel in various media, according to the experimental protocol described in the Supporting Information.
Xenograft CCA Model of in Mice
CCLP‐1 cells were transfected with short hairpin RNA (shRNA) targeting ERK5 (shERK5) or with a nontargeting sequence (shNT). Details of the in vivo model are reported in the Supporting Information.
Statistical Analysis
Statistical analysis of the data was performed by two‐tailed Student t test, analysis of variance, or Fisher’s exact test, as appropriate. For transcriptomic data, Mann‐Whitney two‐tailed analysis was used. For IHC analysis, continuous, normally distributed data were compared using two‐tailed t test and analysis of variance. For non‐normally distributed data, Mann‐Whitney test was used. The association between categorical data was determined using a chi‐square test and Fisher’s exact test, as appropriate. To measure the strength of association, the Cramér’s V coefficient was calculated. All analyses were performed in IBM SPSS (version 25). P values lower than or equal to 0.05 were considered significant.
Results
ERK5 Expression and Activation in CCA Cells and in Patients With CCA
We first tested the expression and activation of ERK5 in CCA cells. In two established (HuCCT‐1 and CCLP‐1) and two primary iCCA cell lines (iCCA 58 and 60), ERK5 was consistently expressed at the protein and mRNA level (Fig. 1A,B), the latter being higher in CCA cells than in normal human cholangiocytes (NHC) (Fig. 1B). Exposure of CCA cells to mitogens increased ERK5 phosphorylation on activation‐specific residues, although fetal bovine serum (FBS) was less effective in primary cells (Fig. 1C). In both HuCCT‐1 and CCLP‐1 cells, ERK5 was localized in the nucleus, and exposure to FBS further increased the amount of nuclear ERK5 (Fig. 1D). Transcriptomic analysis showed that ERK5 mRNA expression was higher in CCA samples compared with matched nontumor liver tissue (Fig. 1E).
FIG. 1.
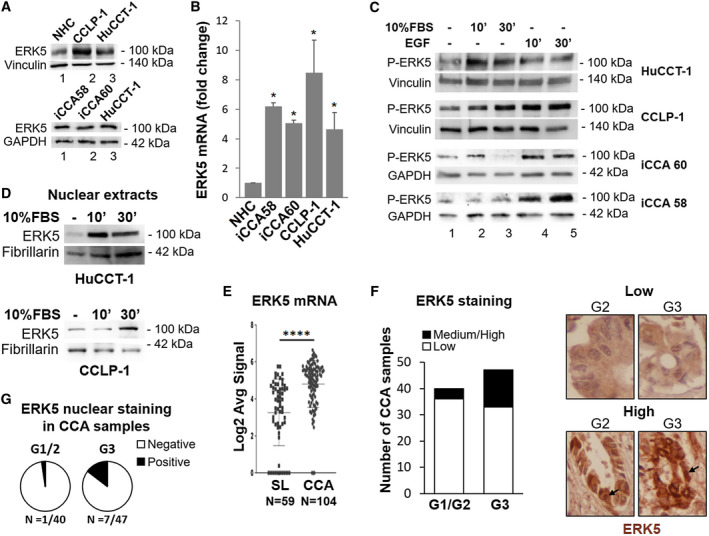
ERK5 expression and activation by mitogens in iCCA cells and in patients with CCA. (A) Lysates of different iCCA cells were subjected to immunoblot analysis for ERK5. Expression of ERK5 protein in NHC, CCLP‐1, and HuCCT‐1 cells (upper panel) and in patient‐derived iCCA cells (lower panel). Equal gel loading was assessed by vinculin or glyceraldehyde 3‐phosphate dehydrogenase (GAPDH) blotting. Molecular weight markers are indicated on the right. (B) Total RNA from NHC and iCCA cells was analyzed for ERK5 gene expression by quantitative PCR. RNA expression is represented as fold increase over NHC, normalized on GAPDH values (n = 3). *P ≤ 0.05 vs. NHC. (C) Twenty‐four–hour serum‐starved iCCA cells were incubated in presence or absence of 10% FBS or 100 ng/mL EGF, as indicated, for different times. Immunoblot analysis was performed with an antibody recognizing phosphorylated (p)‐threonine‐glutamate‐tyrosine ERK5. Equal loading of the gel was assessed by vinculin or GAPDH expression. (D) Nuclear proteins were subjected to immunoblot analysis for ERK5. Equal loading was assessed by fibrillarin blotting. (E) ERK5 mRNA expression in human CCA tissues (n = 104) compared with surrounding matched normal liver tissue (SL) (n = 59) using transcriptome data of patients with CCA.( 26 ) ****P < 0.0001. (F) ERK5 protein levels in human iCCA tissue microarray (TMA) by IHC. The staining intensity was graded from low to high by a pathologist. Representative images of low and high intensity immunostaining for ERK5. (G) Pie charts of the percentages of TMA specimens with positive or negative nuclear ERK5 staining. Abbreviations: Log2, base 2 logarithm; Avg, average.
We then explored the possible correlation between ERK5 expression and clinical characteristics of patients with CCA, dividing the patients in two groups with high or low ERK5 mRNA levels. Higher ERK5 expression was not associated with reduced overall survival. Similar data were obtained analyzing The Cancer Genome Atlas (TCGA) PanCancer Atlas dataset from cBioPortal for Cancer Genomics (https://www.cbioportal.org). However, with the same dataset used to generate Fig. 1E, high ERK5 mRNA expression was significantly associated with portal invasion (P < 0.001). We also evaluated the expression of ERK5 in CCA specimens by IHC and its possible association with tumor features. ERK5 protein levels were significantly associated with tumor grade (Cramér’s V = 0.31; P = 0.021, Fig. 1F). In addition, we found a positive correlation between nuclear localization of ERK5 and CCA grade, although it did not reach statistical significance (Cramér’s V = 0.21; P = 0.065, Fig. 1G).
These data indicate that ERK5 is overexpressed in cultured CCA cells and in human CCA and may be activated in vitro by exposure to soluble mediators.
ERK5 Regulates CCA Cell Growth
We then studied the role of ERK5 in the biological responses of CCA cells performing genetic knockdown with specific shRNA (Fig. 2). In ERK5‐silenced CCA cells, mitogen‐dependent cell growth was reduced (Fig. 2A,B), although EGF did not induce CCLP‐1 proliferation (data not shown). Accordingly, in HuCCT‐1 cells, ERK5 depletion reduced DNA synthesis in response to FBS or EGF (Fig. 2C). In ERK5‐depleted cells, cell viability was decreased in both HuCCT‐1 and CCLP‐1 cells, as indicated by MTT analysis (Fig. 2D,E). Consistently, ERK5 knockdown was associated with increased expression of the cyclin‐dependent kinase inhibitor p27 and with decreased expression of proliferating cell nuclear antigen (Fig. 2F).
FIG. 2.
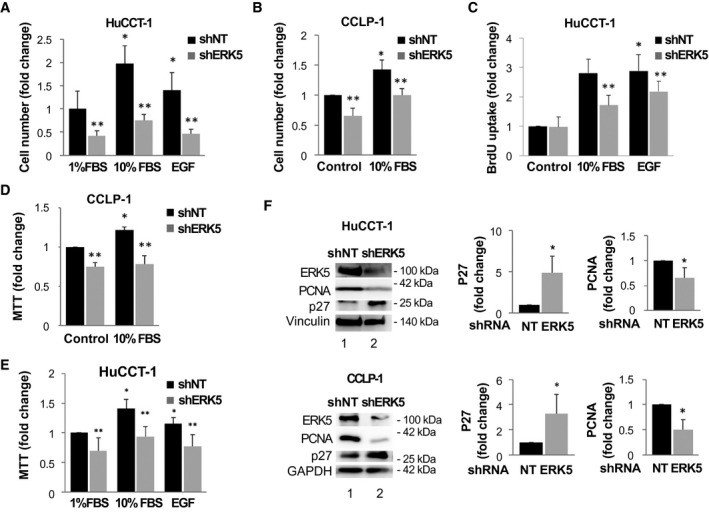
Effects of ERK5 silencing on iCCA cell proliferation. (A) ERK5 knockdown (shERK5) or nontargeting shRNA‐transfected (shNT) HuCCT‐1 cells were starved for 24 hours and incubated in presence of FBS or 100 ng/mL EGF, as indicated. Cell growth was evaluated after 48 hours by cell count and is represented as fold increase over 1% FBS/shNT. *P ≤ 0.05 versus shNT/1% FBS, **P ≤ 0.05 versus paired shNT (n = 4). (B) ERK5 knockdown (shERK5) or nontargeting shRNA‐transfected (shNT) CCLP‐1 cells were starved for 24 hours and incubated in absence or presence of 10% FBS, as indicated. Cell growth was evaluated after 48 hours by cell count and is represented as fold increase over control shNT. *P ≤ 0.05 versus shNT/control, **P ≤ 0.05 versus paired shNT (n = 4). (C) shNT or shERK5‐transfected HuCCT‐1 cells were starved for 24 hours and then incubated in presence or absence of 10% FBS or 100 ng/mL EGF for 24 hours. BrdU incorporation is represented as fold increase over control condition. *P ≤ 0.05 versus shNT/control, **P ≤ 0.05 versus paired shNT control (n = 4). (D) shNT or shERK5‐transfected CCLP‐1 cells were starved for 24 hours and then incubated in presence of 10% FBS. MTT analysis was conducted after 48 hours. *P ≤ 0.05 versus shNT/control, **P ≤ 0.05 versus paired shNT (n = 4). (E) ERK5 knockdown (shERK5) or nontargeting shRNA‐transfected (shNT) CCLP‐1 cells were starved for 24 hours and then incubated in absence or presence of 10% FBS or 100 ng/mL EGF. MTT analysis was conducted after 48 hours. *P ≤ 0.05 versus shNT/control, **P ≤ 0.05 versus paired shNT (n = 4). (F) HuCCT‐1 and CCLP‐1 cells were silenced for ERK5 using specific shRNA (shERK5) or with shNT. Immunoblotting with antibodies recognizing ERK5, p27, or proliferating cell nuclear antigen (PCNA) was performed. Equal loading of the gel was assessed by vinculin or glyceraldehyde 3‐phosphate dehydrogenase (GAPDH) expression. Densitometries of p27 and PCNA expression were measured (n = 4) and are shown in the graphs. *P ≤ 0.05 versus shNT/control. Abbreviation: NT, nontargeting.
The inhibitory effects of ERK5 knockdown on cell growth were recapitulated using the ERK5 inhibitor XMD8‐92( 17 ) (Fig. 3). In HuCCT‐1 cells, XMD8‐92 dose‐dependently reduced the cell number in culture (Fig. 3A) and BrdU incorporation (Fig. 3B). Similar inhibitory effects of XMD8‐92 on cell proliferation were observed in CCLP‐1 cells (Fig. 3C). In both cell lines, treatment with XMD8‐92 reduced the percentage of cells in the S phase (Fig. 3D,E) with a block in G0‐G1 or G2‐M phase in HuCCT‐1 and CCLP‐1, respectively.
FIG. 3.
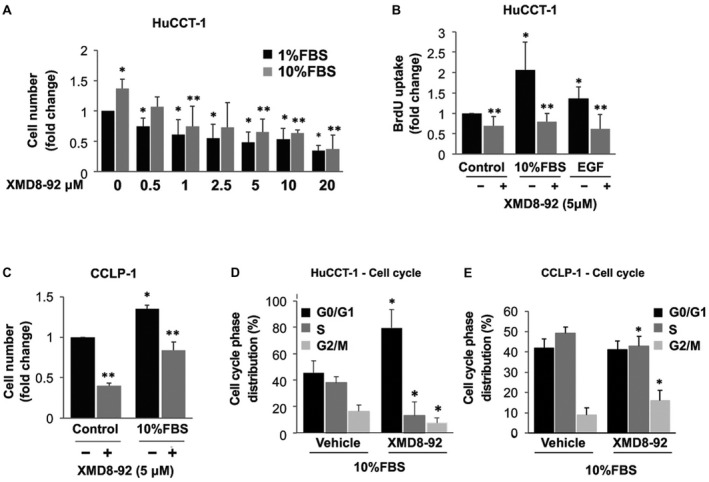
Effects of pharmacological inhibition of ERK5 on iCCA cell proliferation. (A) Twenty‐four–hour starved HuCCT‐1 cells were incubated in presence of 1% or 10% FBS with a 30 minute pretreatment with different doses of the ERK5 inhibitor XMD8‐92 or vehicle. After 48 hours, cells were collected and counted. Cell growth is represented as fold increase over 1% FBS/vehicle. *P ≤ 0.05 versus 1% FBS, **P ≤ 0.05 versus 10% FBS (n = 3). (B) Twenty‐four–hour starved HuCCT‐1 cells were incubated in absence or presence of 10% FBS or 100 ng/mL EGF with or without a 30‐minute pretreatment with 5 µM XMD8‐92. BrdU incorporation was evaluated after 24 hours and is represented as fold increase over control condition. *P ≤ 0.05 versus control. **P ≤ 0.05 versus relative paired control (n = 4). (C) Twenty‐four–hour starved CCLP‐1 cells were incubated in the absence or presence of 10% FBS with a 30‐minute pretreatment with 5 µM of XMD8‐92 or vehicle. After 72 hours, cells were collected and counted. Cell growth is represented as fold increase over control. *P ≤ 0.05 versus control, **P ≤ 0.05 versus paired control (n = 3). (D,E) Twenty‐four–hour starved HuCCT‐1 and CCLP‐1 cells were pretreated with 5 µM XMD8‐92 or vehicle for 30 minutes. Then, 10% FBS was added, and cells were incubated for an additional 24 hours (HuCCT‐1) or 48 hours (CCLP‐1). Cell cycle phase distribution was determined by flow cytometry. Data in the graphs are mean ± SD (n = 3). *P ≤ 0.05 versus paired control.
Because XMD8‐92 has been shown to be a dual ERK5/BRD4 inhibitor,( 18 ) we also tested the effects of AX15836, another ERK5 inhibitor. However, in agreement with previous reports, AX15836 did not modify CCA cell proliferation (data not shown), likely due to paradoxical ERK5 activation.( 18 , 19 )
ERK5 Involvement in CCA Cell Motility
CCLP‐1 and HuCCT‐1 cells that were silenced for ERK5 showed reduced migration compared with shNT cells (Fig. 4A,B). In addition, pharmacological inhibition of ERK5 using either XMD8‐92 or AX15836 inhibited EGF‐induced migration in HuCCT‐1, CCLP‐1, and CCA primary cells (iCCA60) (Fig. 4C‐E). In keeping with the observed reduced motility, phosphorylation of myosin light chain‐2 and of paxillin, which is related to cytoskeletal remodeling, were reduced in ERK5‐depleted cells (Fig. 4F).
FIG. 4.
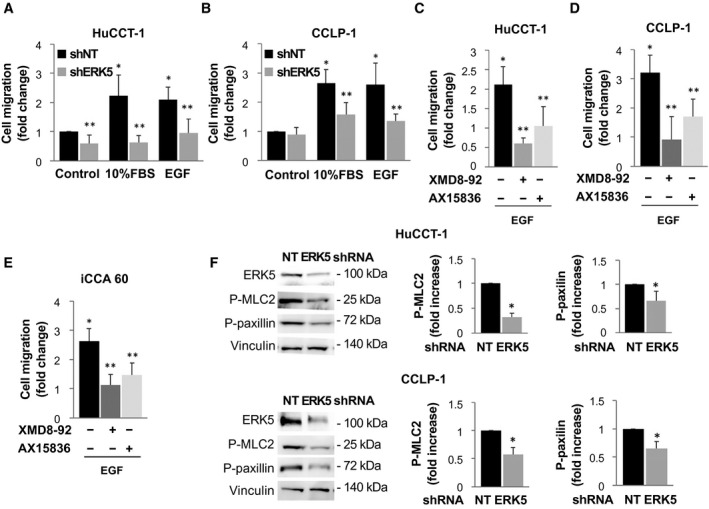
ERK5 regulates iCCA cell migration. (A,B) ERK5 knockdown (shERK5) or nontargeting shRNA‐transfected (shNT) cells were serum deprived for 24 hours and incubated in presence or absence of 10% FBS or 100 ng/mL EGF, as indicated. The number of migrated cells is represented as fold increase over shNT/control. *P ≤ 0.05 vs. shNT/control; **P ≤ 0.05 vs. paired shERK5 (n = 4). (C‐E) Twenty‐four–hour starved iCCA cells were incubated in presence or absence of 100 ng/mL EGF with or without a 30‐minute pretreatment with 5 µM XMD8‐92 or 2 µM AX15836. The number of migrated cells is represented as fold increase over paired control incubated in the absence of EGF. *P ≤ 0.05 versus control. **P ≤ 0.05 versus the relative paired control (n = 4). (F) Lysates from shNT or shERK5‐transfected HuCCT‐1 and CCLP‐1 cells were subjected to immunoblotting with antibodies recognizing ERK5, phosphorylated (p)‐myosin light cain 2 (MLC2), or p‐paxillin. Equal protein loading was assessed by vinculin. Densitometries of p‐MLC2 and p‐paxillin expression (n = 4) are shown in the graphs. *P ≤ 0.05 versus shNT control. Abbreviation: NT, nontargeting.
Similar results were obtained when the ability of HuCCT‐1 or CCLP‐1 cells to invade through a basement membrane‐like matrix was tested (Fig. 5A‐D). These data indicate that ERK5 plays a key role in migration and invasion of CCA cells.
FIG. 5.
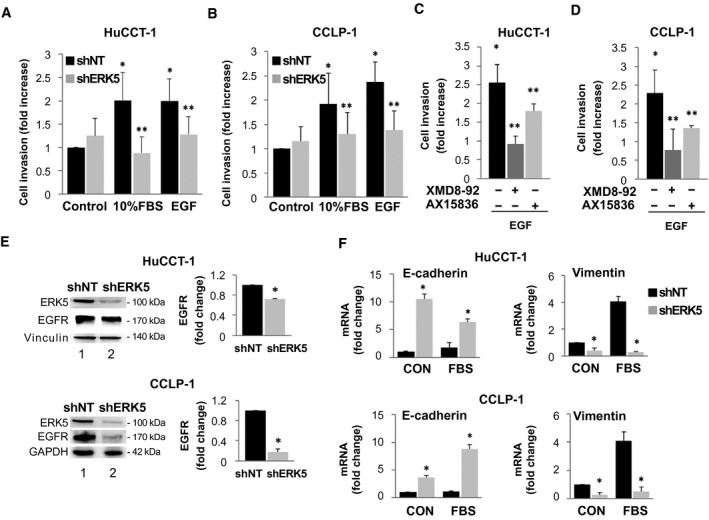
ERK5 modulates invasion of HuCCT‐1 and CCLP‐1 cells and EGFR and EMT genes expression. (A) ERK5 knockdown (shERK5) or nontargeting shRNA‐transfected (shNT) HuCCT‐1 cells were serum deprived for 24 hours and incubated in presence or absence of 10% FBS or 100 ng/mL EGF, as indicated. The number of migrated cells is represented as fold increase over shNT/control. *P ≤ 0.05 vs. shNT/control; **P ≤ 0.05 vs. paired shNT (n = 4). (C,D) Twenty‐four–hour starved cells were incubated in presence or absence of 100 ng/mL EGF, with or without a 30‐minute pretreatment with 5 µM XMD8‐92 or 2 µM AX15836. The number of migrated cells is represented as fold increase over paired control incubated in the absence of EGF. *P ≤ 0.05 versus control. **P ≤ 0.05 versus relative paired control (n = 4). (E) shNT and shERK5 HuCCT‐1 and CCLP‐1 cell lysates were used for immunoblot performed with antibodies recognizing ERK5 or EGFR. Equal loading of the gel was assessed by vinculin or glyceraldehyde 3‐phosphate dehydrogenase (GAPDH) expression. Densitometries of EGFR expression in HuCCT‐1 and CCLP‐1 cells were measured (n = 4) and are shown in the graphs. *P ≤ 0.05 versus shNT. (F) shNT or shERK5‐transfected cells were serum starved for 24 hours and then incubated with or without 10%FBS for 24 hours. Total RNA was extracted and analyzed for E‐cadherin or vimentin gene expression. RNA expression is represented as fold increase over shNT control, normalized on GAPDH values (n = 3). *P ≤ 0.05 vs. paired shNT. Abbreviation: CON, control.
In both CCLP‐1 and HuCCT‐1 cells, ERK5 knockdown resulted in a marked decrease in the expression of EGFR, which could contribute to the reduction of motility/invasiveness of cells exposed to cognate ligands after ERK5 silencing (Fig. 5E). Because EGFR is involved in epithelial‐to‐mesenchymal transition (EMT) in CCA,( 20 ) we tested the effects of ERK5 knockdown on the EMT program. Reduced ERK5 was associated with an increase in the epithelial marker E‐cadherin and a decrease in several mesenchymal markers, including vimentin (Fig. 5F; Supporting Fig. S1), indicating that ERK5 is involved in the promotion of EMT in CCA cells.
Role of ERK5 in the Crosstalk Between CCA Cells and Other Cells of the TME
We then evaluated the effects of ERK5 silencing on the interaction between CCA cells and other cellular components of the TME (Fig. 6). First, we investigated the effects of genetic inhibition of ERK5 on the expression of soluble mediators relevant for angiogenesis. Immunoblot analysis showed that both angiopoietin‐1 and VEGF were less expressed after transfection of shERK5 in HuCCT‐1 or CCLP‐1 cells (Fig. 6A,B; Supporting Fig. S2). To further explore the relevance of ERK5 for the angiogenic process in CCA, we tested the ability of conditioned medium (CM) from ERK5‐silenced or control CCA cells to induce tube formation in HUVEC. Capillary‐like structures formed by HUVEC in the presence of CM from cells depleted of ERK5 were less organized and significantly shorter, providing functional data for a role of ERK5 as a positive modulator of angiogenesis in this setting (Fig. 6).
FIG. 6.
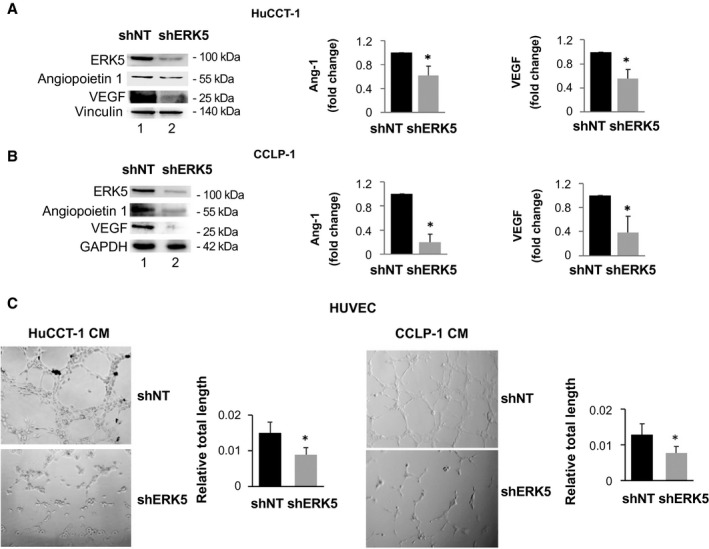
ERK5 expression modulates the expression of proangiogenic factors in CCA cells. (A,B) ERK5 knockdown (shERK5) or nontargeting shRNA‐transfected (shNT) cell lysates were used for immunoblotting with antibodies recognizing ERK5, angiopoietin (Ang) 1, or VEGF. Equal protein loading was assessed by vinculin or glyceraldehyde 3‐phosphate dehydrogenase (GAPDH) expression. Densitometries of HuCCT‐1 and CCLP‐1 angiopoietin 1 and VEGF expressions were measured (n = 4) and are shown in the graphs. *P ≤ 0.05 versus shNT. (C) CM was collected from 6 x 10⁵ shNT or shERK5 CCLP‐1 cells, incubated in complete medium for 24 hours, and used for HUVEC tube formation assay. Pictures representative of results obtained with shNT CMs and shERK5 CMs are shown. Tube formation was quantified using ImageJ. *P ≤ 0.05 versus shNT (n = 3).
We then evaluated the effects of ERK5 modulation in CCA cells on the migration of other cells of the TME (Fig. 7). As reported,( 21 ) CM from both HuCCT‐1 and CCLP‐1 cells induced a marked increase in the migration of human hepatic stellate cells, and this action was significantly lower when medium was collected from ERK5‐silenced cells (Fig. 7A,B). ERK5 knockdown also limited the ability of CM from CCA cells to induce the migration of the monocytic cell line THP‐1 in baseline condition or after their differentiation to macrophages (Fig. 7A,B). Together with data on angiogenesis, these results indicate a relevant role of ERK5 in the crosstalk between CCA cells and cells from the TME.
FIG. 7.
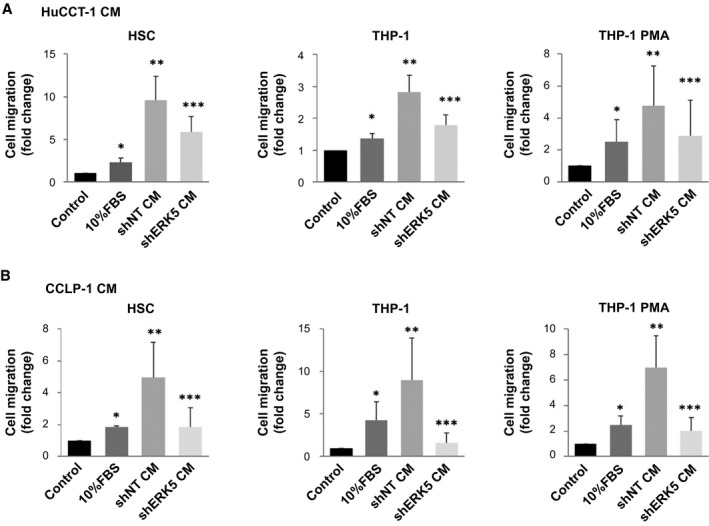
CM from ERK5‐silenced cells less effectively recruits myofibroblasts and monocytic cells. (A,B) CM was collected from 6 × 10⁵ shNT or shERK5 HuCCT‐1 and CCLP‐1 cells, incubated in complete medium for 24 hours, and used for migration assay. Twenty‐four–hour starved HSCs, THP‐1, and PMA‐derived THP‐1 cells were incubated in presence or absence of 10% FBS or different CMs, as indicated. The number of migrated cells is represented as fold increase over control. *P ≤ 0.05 vs. control, **P ≤ 0.05 vs. 10% FBS, ***P ≤ 0.05 vs. shNT CM (n = 3). Abbreviation: PMA, phorbol 12‐myristate 13‐acetate.
ERK5 and Tumor Development In Vivo
Based on the strong in vitro data indicating the involvement of ERK5 in the features of CCA cells relevant for tumor progression, we evaluated the possible impact of the inhibition of this kinase in an in vivo model of CCA. To this aim, we performed subcutaneous xenografts in nude mice using CCLP‐1 cells silenced for ERK5 or cells transfected with shNT. Both the volume and weight of tumors developed in mice injected with control cells were markedly and significantly higher than those of mice receiving ERK5‐silenced cells (Fig. 8A,B). Additionally, palpable tumors developed in 6 out of 8 mice (75%) injected with control cells as compared with only 1 out of 7 (14%) of mice receiving ERK5‐silenced cells (Fig. 8C). These results were confirmed using Vevo analysis (Fig. 8D). We could not obtain any information on possible differences in oxygen saturation between the two groups because this parameter was not measurable in ERK5 shRNA tumors due to their low size (data not shown). Analogously, we could not provide molecular characterization of xenografts, because tumors generated by injection of ERK5‐silenced cells were too small to recover any material for further analysis. To obtain additional information from this experiment, we analyzed the possible occurrence of lung metastases, which were absent in both the control and ERK5‐silenced groups (data not shown). The impact of ERK5 on the biology of CCA is summarized in Fig. 8E.
FIG. 8.
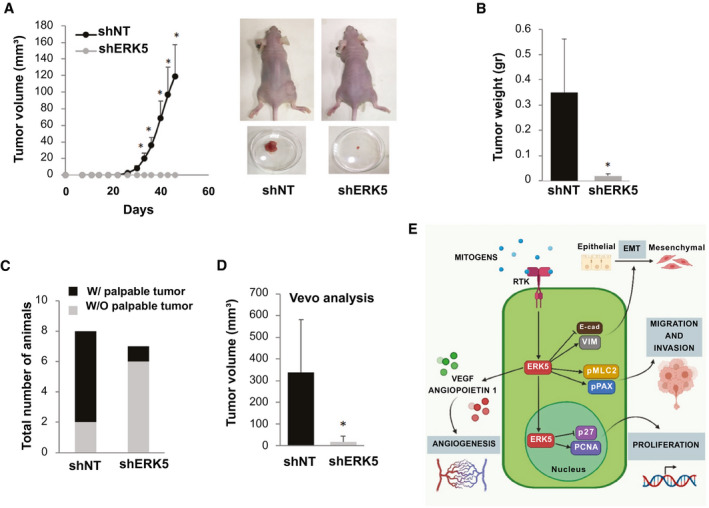
Effect of ERK5 silencing on CCLP‐1 xenograft tumor formation. (A) Tumor volumes were measured in mice injected with shNT‐ or shERK5‐transfected CCLP‐1 cells. Tumor volumes are expressed as mean ± SEM (n = 8 in the shNT group and n = 7 in the shERK5 group). Pictures of representative mice showing tumors at the end of the experiment. (B) Tumors were collected and weighted after sacrifice. *P ≤ 0.05 vs. shNT group. (C) Rate of tumor development after injection of shNT or shERK5 CCLP‐1 cells. Data are presented as the number of animals with (black portion) or without (gray portion) appearance of a palpable tumor. *P ≤ 0.05 vs. shNT group. (D) Tumor volumes measured in mice injected with shNT or shERK5 CCLP‐1 cells, as established by Vevo analysis. *P ≤ 0.05 vs. shNT group. (E) Scheme summarizing the role of ERK5 in CCA cell biology. Abbreviations: E‐cad, E‐cadherin; pMLC, phosphorylated myosin light chain 2; pPAX, phosphoylated paxillin; RTK, receptor tyrosine kinase; VIM, vimentin; W/, with; W/O, without.
Discussion
CCA is a highly fatal and aggressive tumor with limited therapeutic options. Based on the urgent need for approaches to treatment, we investigated the role of ERK5 in the biology of CCA in view of its potential as a drug target in this malignancy. Here, we identify ERK5 as a key player in the biology of CCA, providing evidence that this kinase supports the proliferation of CCA in vitro and in vivo as well as migration and invasiveness of CCA cells. Additionally, we found that ERK5 regulates the interaction of CCA cells with cells of the TME critical for CCA progression. Importantly, the results of genetic interference could be recapitulated using pharmacological inhibitors of ERK5, highlighting the potential translatability of this study to a preclinical setting.
ERK5 expression was present and up‐regulated in iCCA cells, including established lines and patient‐derived cells. These in vitro results were strengthened by the analysis of transcriptomic datasets from surgically resected human CCA specimens, which showed increased expression of ERK5 in tumor versus surrounding nontumor tissue. Although the ultimate mechanism(s) responsible for ERK5 up‐regulation in CCA remain to be established, studies have shown that down‐regulation of microRNAs (miR) known to suppress ERK5 expression, including miR‐143, and miR‐145 occurs in different types of cancer.( 22 ) Additionally, miR‐200b, which is reduced in patients with CCA, targets ERK5,( 23 ) and miR‐329, which acts as a tumor suppressor gene in CCA cells, may inactivate the mitogen‐activated protein kinase (MAPK) signaling pathway, including ERK5.( 24 ) In contrast, although ERK5 amplification has been described in a subset of patients with HCC,( 25 ) alterations in copy number of MAPK7 have not been reported in CCA. Nonetheless, this event appears very unlikely, on the basis of data available in the c‐BioPortal for Cancer Genomics, where only 1 out of 35 (2.9%) patients had an increased copy number, using the TCGA Firehose Legacy dataset. Additional support to the role of this kinase in the progression of CCA is provided by the observation that ERK5 protein levels and/or nuclear localization, an index of kinase activation, correlate with tumor grade and portal invasion.
At a functional level, both EGF and FBS were found to activate ERK5 in CCA cell lines, and mitogenic responses to these factors were markedly reduced following genetic and pharmacologic inhibition of ERK5, indicating the relevance of this kinase in mediating cell proliferation. In addition, p27, a cell cycle inhibitor reported to be regulated by ERK5,( 26 , 27 , 28 ) was up‐regulated in ERK5‐depleted cells, suggesting that cell cycle arrest may contribute to the inhibition of proliferation. This was supported by data on the effects of the ERK5 inhibitor, XMD8‐92, which induced arrest of the cell cycle as well as the reduction of the number of CCA cells in the S phase. These effects were in agreement with BrdU analysis, indicating a reduction of DNA synthesis in cells stimulated with mitogens in the presence of ERK5 inhibition or depletion.
Data on EGF‐mediated cell proliferation discussed above are in agreement with observations indicating that the EGFR is involved in the biology of CCA.( 7 , 8 ) In addition, EGFR has been recently shown to be implicated in EMT,( 20 ) an effect that favors cell invasiveness. In this respect, on EGF stimulation, ERK5‐silenced cells were less motile and invasive, and this phenotype was recapitulated by ERK5 pharmacologic inhibition. Moreover, ERK5 silencing resulted in down‐regulated expression of the EGFR, possibly contributing to explain the reduced invasiveness in response to EGF. Furthermore, our results showing a reduction of mesenchymal markers in ERK5‐depleted cells are in keeping with a report supporting a role of ERK5 in the promotion of EMT in CCA.( 23 ) Taken together, our findings indicate that the protumor effects of EGFR in CCA are mediated, at least in part, by activating ERK5. It is worth pointing out that in migration and invasion experiments, both XMD8‐92 and AX15836 elicited similar effects, recapitulating all the results obtained with ERK5‐silenced cells. On the other hand, AX15836 was ineffective in reducing CCA cell proliferation. This is in line with reports showing that this compound does not affect cell proliferation apparently due to a paradoxical activation of ERK5 that results in its nuclear translocation and activation of target genes.( 18 , 19 ) On the other hand, our data support the hypothesis that a decrease in ERK5 kinase activity, properly blocked by either XMD8‐92 or AX15836, is sufficient to reduce the signaling cascade involving cytoplasmic/cytoskeletal proteins, which regulate CCA migration and invasion.
ERK5 knockdown in a CCA xenograft mouse model confirmed a key role of this kinase in the growth of CCA cells, in vivo. For this proof‐of‐concept experiment, we decided to employ a more specific genetic approach rather than a pharmacologic approach, because all the available inhibitors developed so far are only partially specific for ERK5 or may induce paradoxical activation of this kinase.( 18 , 19 ) Indeed, mice injected with cells silenced for ERK5 developed tumors less frequently, and their volume was lower than that measured in mice receiving shNT cells. The development of very small tumors in mice injected ERK5‐depleted cells did not allow us to perform additional molecular analyses on the tissue.
CCA is deeply embedded in a fibrous and inflammatory stroma, and therapies targeting components of the TME are currently under scrutiny in CCA and other types of cancer.( 29 ) We found that ERK5 modifies the secretome of CCA cells, modulating the interaction between these cells and other components of the TME. In particular, we showed that CM collected from ERK5‐depleted CCA cells contains lower amounts of the angiogenic factors angiopoietin‐1 and VEGF and results in reduced tube formation in HUVEC. In addition, although the regulatory role of ERK5 on VEGF has been described,( 30 ) we also found a link between ERK5 and angiopoietin‐1. ERK5 was also found to potentially affect the myofibroblastic and inflammatory components of the TME. Migration of human myofibroblastic stellate cells as well as human monocytes was reduced when these cells were exposed to CM from ERK5‐silenced CCA cells with respect to that from control cells. The above findings are very important in light of accumulating evidence showing the relevance of an interplay between cells of the TME and the malignant biliary epithelial counterpart in CCA development and progression.( 3 , 7 ) In addition, our data are in agreement with the known involvement of ERK5 in the recruitment of inflammatory cells to the TME( 31 ) because depletion of ERK5 in CCA cells reduced the recruitment of monocytes. Based on our results, ERK5 emerges as a key protein involved in the crosstalk between CCA cells and TME.
In conclusion, the data from this study indicate that ERK5 promotes the biology of CCA cells both in vivo and in vitro. The existence of effective ERK5 inhibitors underscores the potential translatability of this study to the clinical setting.
Author Contributions
A.G. conceived and designed the study, performed the experiment, analyzed the data, and wrote the manuscript. G.L. performed the western blot experiments, RT‐PCR experiments, and HUVEC assays. A.C. cultured the cells and performed BrdU assays. C.R., B.P., G.D.M, S.M., and I.T. performed the in vivo experiments. C.C. performed analysis of the in vivo and patients’ data. M.P., N.N., and A.T. performed western blot experiments. S.D.M. and D.A. provided iCCA primary cells. J.M.B. provided NHC. T.L. and A.A. performed Vevo analysis. A.T. performed HUVEC assay analysis. L.D. and J.B.A. provided and analyzed human CCA transcriptomic data. L.D.T. analyzed human CCA IHC. E.R. participated in study design and interpretation of the results, provided selected shRNA, performed cell cycle experiments, and wrote the manuscript. F.M. provided funding, supervised the study, and wrote the manuscript.
Supporting information
Supplementary Material
Acknowledgment
We thank AJ Demetris MD, Department of Pathology, University of Pittsburgh, Pittsburg, PA, for having provided us with the HuCCT‐1 and CCLP‐1 cells and Alessia Taddei (University of Florence) for technical support.
Supported by AIRC grant IG‐17786 (to F. M.) and IG‐21349 (to E. R.) by the University of Florence and by Fondazione Cassa di Risparmio di Pistoia e Pescia. G. L. was supported in part by a fellowship of Fondazione AIRC. J. M. B. was funded by the Spanish Carlos III Health Institute (ISCIII) (FIS PI15/01132, PI18/01075, and Miguel Servet Program CON14/00129 and CPII19/00008) cofinanced by “Fondo Europeo de Desarrollo Regional” (FEDER), Department of Health of the Basque Country (2017111010), “Euskadi RIS3” (2020333010), BIOEF (Basque Foundation for Innovation and Health Research: EiTB Maratoia BIO15/CA/016/BD), Department of Industry of the Basque Country (Elkartek: KK‐2020/00008), “Fundación Científica de la Asociación Española Contra el Cáncer” (AECC Scientific Foundation), and EU COST‐Action 18122 (Euro‐Cholangio‐NET to J. M. B., D. A., and J. B. A.). J. B. A. was supported by the European Union’s Horizon 2020 research and innovation program under the Marie Skłodowska‐Curie grant agreement no. 801481.
Potential conflict of interest: Nothing to report.
Contributor Information
Alessandra Gentilini, Email: fabio.marra@unifi.it, Email: alessandra.gentilini@unifi.it.
Fabio Marra, Email: fabio.marra@unifi.it.
References
Authors names in bold designate shared co‐first authorship.
- 1. Blechacz B. Cholangiocarcinoma: current knowledge and new developments. Gut Liv 2017;11:13‐26. [DOI] [PMC free article] [PubMed] [Google Scholar]
- 2. Banales JM, Cardinale V, Carpino G, Marzioni M, Andersen JB, Invernizzi P, et al. Expert consensus document: cholangiocarcinoma: current knowledge and future perspectives consensus statement from the European Network for the Study of Cholangiocarcinoma (ENS‐CCA). Nat Rev Gastroenterol Hepatol 2016;13:261‐280. [DOI] [PubMed] [Google Scholar]
- 3. Fabris L, Perugorria MJ, Mertens J, Björkström NK, Cramer T, Lleo A, et al. The tumour microenvironment and immune milieu of cholangiocarcinoma. Liver Int 2019;39(Suppl 1):63‐78. [DOI] [PMC free article] [PubMed] [Google Scholar]
- 4. Gentilini A, Pastore M, Marra F, Raggi C. The role of stroma in cholangiocarcinoma: the intriguing interplay between fibroblastic component, immune cell subsets and tumor epithelium. Int J Mol Sci 2018;19:2885. [DOI] [PMC free article] [PubMed] [Google Scholar]
- 5. Gentilini A, Caligiuri A, Raggi C, Rombouts K, Pinzani M, Lori G, et al. CXCR7 contributes to the aggressive phenotype of cholangiocarcinoma cells. Biochim Biophys Acta Mol Basis Dis 2019;1865:2246‐2256. [DOI] [PubMed] [Google Scholar]
- 6. Lindsey S, Langhans SA. Epidermal growth factor signaling in transformed cells. Int Rev Cell Mol Biol 2015;314:1‐41. [DOI] [PMC free article] [PubMed] [Google Scholar]
- 7. Brivio S, Cadamuro M, Fabris L, Strazzabosco M. Molecular mechanisms driving cholangiocarcinoma invasiveness: an overview. Gene Expr 2018;18:31‐50. [DOI] [PMC free article] [PubMed] [Google Scholar]
- 8. Yoon JH, Gwak GY, Lee HS, Bronk SF, Werneburg NW, Gores GJ. Enhanced epidermal growth factor receptor activation in human cholangiocarcinoma cells. J Hepatol 2004;41:808‐814. [DOI] [PubMed] [Google Scholar]
- 9. Cicenas J, Zalyte E, Rimkus A, Dapkus D, Noreika R, Urbonavicius S. JNK, p38, ERK, and SGK1 inhibitors in cancer. Cancers (Basel) 2017;10:1. [DOI] [PMC free article] [PubMed] [Google Scholar]
- 10. Lee KS, Park JH, Lim HJ, Park HY. HB‐EGF induces cardiomyocyte hypertophy via an ERK5‐MEF2A‐COX2 signaling pathway. Cell Signal 2011;23:1100‐1109. [DOI] [PubMed] [Google Scholar]
- 11. Rovida E, Navari N, Caligiuri A, Dello Sbarba P, Marra F. ERK5 differentially regulates PDGF‐induced proliferation and migration of hepatic stellate cells. J Hepatol 2008;48:107‐115. [DOI] [PubMed] [Google Scholar]
- 12. Stecca B, Rovida E. Impact of ERK5 on the hallmarks of cancer. Int J Mol Sci 2019;20. [DOI] [PMC free article] [PubMed] [Google Scholar]
- 13. Esparis‐Ogando A, Diaz‐Rodriguez E, Montero JC, Yuste L, Crespo P, Pandiella A. Erk5 participates in neuregulin signal transduction and is constitutively active in breast cancer cells overexpressing ErbB2. Mol Cell Biol 2002;22:270‐285. [DOI] [PMC free article] [PubMed] [Google Scholar]
- 14. McCracken SRC, Ramsay A, Heer R, Mathers ME, Jenkins BL, Edwards J, et al. Aberrant expression of extracellular signal‐regulated kinase 5 in human prostate cancer. Oncogene 2008;27:2978‐2988. [DOI] [PubMed] [Google Scholar]
- 15. Rovida E, Di Maira G, Tusa I, Cannito S, Paternostro C, Navari N, et al. The mitogen‐activated protein kinase ERK5 regulates the development and growth of hepatocellular carcinoma. Gut 2015;64:1454‐1465. [DOI] [PubMed] [Google Scholar]
- 16. Andersen JB, Spee B, Blechacz BR, Avital I, Komuta M, Barbour A, et al. Genomic and genetic characterization of cholangiocarcinoma identifies therapeutic targets for tyrosine kinase inhibitors. Gastroenterology 2012;142:1021‐1031. [DOI] [PMC free article] [PubMed] [Google Scholar]
- 17. Yang Q, Deng X, Lu B, Cameron M, Fearns C, Patricelli MP, et al. Pharmacological inhibition of BMK1 suppresses tumor growth through promyelocytic leukemia protein. Cancer Cell 2010;18:258‐267. [DOI] [PMC free article] [PubMed] [Google Scholar]
- 18. Lin ECK, Amantea CM, Nomanbhoy TK, Weissig H, Ishiyama J, Hu YI, et al. ERK5 kinase activity is dispensable for cellular immune response and proliferation. Proc Natl Acad Sci U S A 2016;18:11865‐11870. [DOI] [PMC free article] [PubMed] [Google Scholar]
- 19. Lochhead PA, Tucker JA, Tatum NJ, Wang J, Oxley D, Kidger AM, et al. Paradoxical activation of the protein kinase‐transcription factor ERK5 by ERK5 kinase inhibitors. Nat Commun 2020;13:1383. [DOI] [PMC free article] [PubMed] [Google Scholar]
- 20. Clapéron A, Mergey M, Nguyen Ho‐Bouldoires TH, Vignjevic D, Wendum D, Chrétien Y, et al. EGF/EGFR axis contributes to the progression of cholangiocarcinoma through the induction of an epithelial‐mesenchymal transition. J Hepatol 2014;61:325‐332. [DOI] [PubMed] [Google Scholar]
- 21. Cadamuro M, Nardo G, Indraccolo S, Dall'Olmo L, Sambado L, Moserle L, et al. Platelet‐derived growth factor‐D and Rho GTPases regulate recruitment of cancer‐associated fibroblasts in cholangiocarcinoma. Hepatology 2013;58:1042‐1053. [DOI] [PMC free article] [PubMed] [Google Scholar]
- 22. Akao Y, Nakagawa Y, Naoe T. MicroRNAs 143 and 145 are possible common onco‐microRNAs in human cancers. Oncol Rep 2006;16:845‐850. [PubMed] [Google Scholar]
- 23. Zhang D, Li H, Jiang X, Cao L, Wen Z, Yang X, et al. Role of AP‐2α and MAPK7 in the regulation of autocrine TGF‐β/miR‐200b signals to maintain epithelial‐mesenchymal transition in cholangiocarcinoma. J Hematol Oncol 2017;10:170. [DOI] [PMC free article] [PubMed] [Google Scholar]
- 24. Hu ZG, Zheng CW, Su HZ, Zeng YL, Lin CJ, Guo ZY, et al. MicroRNA‐329‐mediated PTTG1 downregulation inactivates the MAPK signaling pathway to suppress cell proliferation and tumor growth in cholangiocarcinoma. J Cell Biochem 2019;120:9964‐9978. [DOI] [PubMed] [Google Scholar]
- 25. Zen K, Yasui K, Nakajima T, Zen Y, Zen K, Gen Y, et al. ERK5 is a target for gene amplification at 17p11 and promotes cell growth in hepatocellular carcinoma by regulating mitotic entry. Genes Chromosomes Cancer 2009;48:109‐120. [DOI] [PubMed] [Google Scholar]
- 26. Rovida E, Spinelli E, Sdelci S, Barbetti V, Morandi A, Giuntoli S, et al. ERK5/BMK1 is indispensable for optimal colony‐stimulating factor 1 (CSF‐1)‐induced proliferation in macrophages in a Src‐dependent fashion. J Immunol 2008;180:4166‐4172. [DOI] [PubMed] [Google Scholar]
- 27. Perez‐Madrigal D, Finegan KG, Paramo B, Tournier C. The extracellular‐regulated protein kinase 5 (ERK5) promotes cell proliferation through the down‐regulation of inhibitors of cyclin dependent protein kinases (CDKs). Cell Signal 2012;24:2360‐2368. [DOI] [PubMed] [Google Scholar]
- 28. Tusa I, Gagliardi S, Tubita A, Pandolfi S, Urso C, Borgognoni L, et al. ERK5 is activated by oncogenic BRAF and promotes melanoma growth. Oncogene 2018;37:2601‐2614. [DOI] [PMC free article] [PubMed] [Google Scholar]
- 29. Sirica AE, Gores GJ, Groopman JD, Selaru FM, Strazzabosco M, Wei Wang X, et al. Intrahepatic cholangiocarcinoma: continuing challenges and translational advances. Hepatology 2019;69:1803‐1815. [DOI] [PMC free article] [PubMed] [Google Scholar]
- 30. Hayashi M, Fearns C, Eliceiri B, Yang Y, Lee JD. Big mitogen‐activated protein kinase 1/extracellular signal‐regulated kinase 5 signaling pathway is essential for tumor‐associated angiogenesis. Cancer Res 2005;65:7699‐7706. [DOI] [PubMed] [Google Scholar]
- 31. Finegan KG, Perez‐Madrigal D, Hitchin JR, Davies CC, Jordan AM, Tournier C. ERK5 is a critical mediator of inflammation‐driven cancer. Cancer Res 2015;75:742‐753. [DOI] [PMC free article] [PubMed] [Google Scholar]
Associated Data
This section collects any data citations, data availability statements, or supplementary materials included in this article.
Supplementary Materials
Supplementary Material


