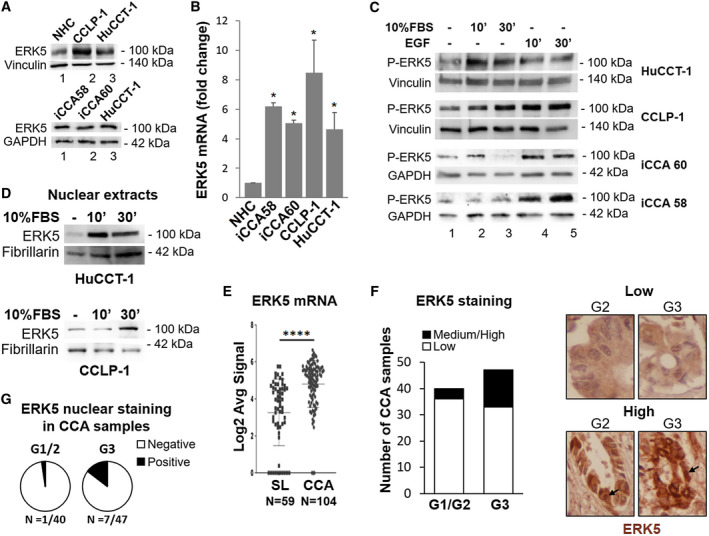
FIG. 1.

ERK5 expression and activation by mitogens in iCCA cells and in patients with CCA. (A) Lysates of different iCCA cells were subjected to immunoblot analysis for ERK5. Expression of ERK5 protein in NHC, CCLP‐1, and HuCCT‐1 cells (upper panel) and in patient‐derived iCCA cells (lower panel). Equal gel loading was assessed by vinculin or glyceraldehyde 3‐phosphate dehydrogenase (GAPDH) blotting. Molecular weight markers are indicated on the right. (B) Total RNA from NHC and iCCA cells was analyzed for ERK5 gene expression by quantitative PCR. RNA expression is represented as fold increase over NHC, normalized on GAPDH values (n = 3). *P ≤ 0.05 vs. NHC. (C) Twenty‐four–hour serum‐starved iCCA cells were incubated in presence or absence of 10% FBS or 100 ng/mL EGF, as indicated, for different times. Immunoblot analysis was performed with an antibody recognizing phosphorylated (p)‐threonine‐glutamate‐tyrosine ERK5. Equal loading of the gel was assessed by vinculin or GAPDH expression. (D) Nuclear proteins were subjected to immunoblot analysis for ERK5. Equal loading was assessed by fibrillarin blotting. (E) ERK5 mRNA expression in human CCA tissues (n = 104) compared with surrounding matched normal liver tissue (SL) (n = 59) using transcriptome data of patients with CCA.( 26 ) ****P < 0.0001. (F) ERK5 protein levels in human iCCA tissue microarray (TMA) by IHC. The staining intensity was graded from low to high by a pathologist. Representative images of low and high intensity immunostaining for ERK5. (G) Pie charts of the percentages of TMA specimens with positive or negative nuclear ERK5 staining. Abbreviations: Log2, base 2 logarithm; Avg, average.
