

Abstract
Background
Calcium‐activated potassium channels (KCa) are a specific type of potassium channel activated by intracellular calcium concentration changes. This group of potassium channels plays fundamental roles ranging from regulating neuronal excitability to immune cell activation. Many human diseases such as schizophrenia, hypertension, epilepsy, and cancers have been linked to mutations in this group of potassium channels. Although the KCa channels have been extensively studied electrophysiologically and pharmacologically, their spatiotemporal gene expression during embryogenesis remains mostly unknown.
Results
Using zebrafish as a model, we identified and renamed 14 KCa genes. We further performed phylogenetic and syntenic analyses on vertebrate KCa genes. Our data revealed that the number of KCa genes in zebrafish was increased, most likely due to teleost‐specific whole‐genome duplication. Moreover, we examined zebrafish KCa gene expression during early embryogenesis. The duplicated ohnologous genes show distinct and overlapped gene expression. Furthermore, we found that zebrafish KCa genes are expressed in various tissues and organs (somites, fins, olfactory regions, eye, kidney, and so on) and neuronal tissues, suggesting that they may play important roles during zebrafish embryogenesis.
Conclusions
Our phylogenetic and developmental analyses shed light on the potential functions of the KCa genes during embryogenesis related to congenital diseases and human channelopathies.
Keywords: calcium‐activated potassium ion channels, in situ hybridization, KCa channels, KCNMA, KCNMB, KCNN, KCNT, phylogeny, whole genome duplication (WGD), zebrafish
Key Findings
Fourteen zebrafish KCa genes were identified through phylogenetic and syntenic analyses.
Vertebrate KCa gene numbers are increased due to the whole genome duplications from the invertebrate to vertebrate transition.
The teleost species possess more KCa genes due to another round of whole‐genome duplication before the split of this lineage. Some of the paralogues were lost in zebrafish and other teleost species.
The zebrafish KCa genes were expressed in both neural and non‐neural tissues during early embryogenesis, suggesting they may have an essential function in regulating embryonic development.
1. INTRODUCTION
Potassium ion channels play critical roles in regulating fundamental physiological processes, from membrane potential maintainance, neuronal action potential firing, to hormone secretion, cellular volume control, cell migration, cell cycle, cell death, and cancers. 1 , 2 There are 78 potassium channel coding genes in the human genome. Based on protein sequence similarity, the number of their transmembrane domains (T), pore‐forming domain/loop (P), and gating mechanism, potassium channels can be classified into four groups: voltage‐gated potassium channels (Kv, 6T&1P), inwardly‐rectifying potassium channels (Kir, 2T&1P), two‐pore domain potassium channels (K2P, 4T&2P), and calcium‐activated potassium channels (KCa, 6T&1P). 1 , 3
Calcium‐activated potassium ion channels (KCa) are a specific type of potassium channel activated by intracellular calcium as a ligand to hyperpolarize cell membrane potential by changing potassium permeability. 4 , 5 This group of potassium channels plays fundamental roles ranging from regulating neuronal excitability to immune cell activation. 4 , 6 They are also known to cause various diseases when mutated, such as schizophrenia, hypertension, and epilepsy. 5 Based on single‐channel conductance, KCa channels are generally further classified into three subgroups: large (BK, 300‐200pS), intermediate (IK, 39‐32pS), and small conductance (SK, 14‐4pS) channels. 3 , 4 All the KCa channels exist as tetramers of α‐subunits in the plasma membrane. In humans, SK α subunits are encoded by the KCNN1, KCNN2, and KCNN3 genes, and IK α subunits are encoded by the KCNN4 gene. 7 , 8 , 9 The SK and IK channels share similar protein domains and a calmodulin binding‐domain (S0) at their C‐terminus. 3 , 4 In contrast, the BK α subunit has one additional transmembrane domain at its N‐terminus and a calcium bowl (RCK1‐RCK2) at its C‐terminus that directly detects changes to calcium ion levels. 3 , 4
BK channel function can be modulated by auxiliary proteins referred to as beta and gamma units. These proteins do not actually form ion pores in the cell membrane for potassium ions but can be either inhibitory or excitatory regarding channel conductance regulation. 10 In humans, the BK α subunits are encoded by the KCNMA1 (SLO1, KCa1.1) gene, β and γ subunits are products of KCMNB1‐KCNNB4 genes and LRRC genes, respectively. 10 In addition to the BK channel, there are three structurally similar potassium channels: KCNT1 (SLO2.2/SLACK), KCNT2 (SLO2.1/SLICK), and KCNU1 (SLO3) in the human genome. However, the first two can also be activated by sodium and chloride, and the last one by protons. 10 , 11 This group of genes plays a diverse and important role in physiology and human diseases. 2 , 4 , 10 , 12
Although the KCa channels have been extensively studied for electrophysiological and pharmacological properties, their gene expression during embryogenesis remains largely unknown. Here, we systematically cloned KCa genes from zebrafish, performed phylogenetic analysis, and examined their gene expression during early embryogenic development. We found that the KCa gene family was expanded through teleost whole‐genome duplication (WGD) events. The KCa genes are expressed in both neuronal and somatic tissues in early fish embryos, suggesting they play important roles in vertebrate embryogenesis.
2. RESULTS
2.1. The kcnn1 gene was duplicated in zebrafish and teleost
To better understand KCa gene functions during embryogenesis, we chose zebrafish due to its prominent advantages such as tractable genetics, rapid, and transparent external embryonic development. To identify zebrafish KCa genes, we first searched for all the zebrafish small and intermediate conductance KCa channels by BLAST in the current zebrafish reference genome, GRCz11, in Ensembl, using human KCa genes as baits. Consistent with the ZFIN collection, we found there is only one kcnn2, kcnn3, and kcnn4 genes in the zebrafish genome (Table 1). However, there are two kcnn1 genes (kcnn1a and kcnn1b). To clarify the zebrafish gene identifies, we built a phylogeny with human, mouse, and zebrafish gene protein sequences (Figure 1A). Both zebrafish kcnn1a and kcnn1b genes were grouped with the human and mouse KCNN1 genes (Figure 1A). It is well known that teleost genomes underwent a WGD event. 13 , 14 , 15 , 16 Thus, these two kcnn1 genes likely resulted from the teleost WGD event. To test this, we performed a phylogenetic analysis with a few more teleost species and tetrapod representatives. Indeed, teleost Kcnn1 forms two clades (Kcnn1a and Kcnn1b, Figure 1B), suggesting that the two genes likely originated from the WGD event. 15 , 16 The spotted gar separated from other teleosts before the WGD and it only has one kcnn1 gene. Interestingly, it was grouped with kcnn1b genes with a low supporting value, suggesting that the teleost kcnn1b sequences might evolve slower from ancestor sequences than kcnn1a genes.
TABLE 1.
Zebrafish KCa genes and their human orthologues
| Subgroup by conductance | Zebrafish gene name | Previous gene name | ENSEMBL ID | Human gene name | Human gene other names |
|---|---|---|---|---|---|
| BK | kcnma1a | slo1a; si:ch211‐9f22.2 | ENSDARG00000079840 | KCNMA1 | Slo, Slo1, BK, K Ca 1.1 |
| BK | kcnma1b | slo1b | ENSDARG00000110727 | KCNMA1 | Slo, Slo1, BK, K Ca 1.1 |
| kcnmb2a | zgc:101842 | ENSDARG00000006568 | KCNMB2 | ||
| kcnmb2b | si:ch211‐247n2.1 | ENSDARG00000001712 | KCNMB2 | ||
| Kcnmb3 | si:ch211‐38m6.7 | ENSDARG00000063129 | KCNMB3 | ||
| SK | kcnn1a | si:rp71‐39b20.3 | ENSDARG00000091306 | KCNN1 | SK Ca 1, K Ca 2.1 |
| SK | kcnn1b | si:ch211‐200a16.1, sk1 | ENSDARG00000023546 | KCNN1 | SK Ca 1, K Ca 2.1 |
| SK | kcnn2 | si:dkey‐76p7.5 | ENSDARG00000014939 | KCNN2 | SK Ca 2, K Ca 2.2 |
| SK | kcnn3 | si:dkey‐45h18.1 | ENSDARG00000019753 | KCNN3 | SK Ca 3, K Ca 2.3 |
| IK | kcnn4 | si:dkeyp‐84f3.3 | ENSDARG00000086091 | KCNN4 | IK Ca 1, K Ca 3.1 |
| kcnt1a | kcnt1 | ENSDARG00000079484 | KCNT1 | Slack, Slo2.2, K Ca 4.1 | |
| kcnt1b | si:dkey‐21e5.1 | ENSDARG00000104868 | KCNT1 | Slack, Slo2.2, K Ca 4.1 | |
| kcnt2a | zmp:0000000780 | ENSDARG00000075812 | KCNT2 | Slick, Slo2.1 K Ca 4.2 | |
| kcnt2b | CR392045.1 | ENSDARG00000113064 | KCNT2 | Slick, Slo2.1 K Ca 4.2 |
FIGURE 1.
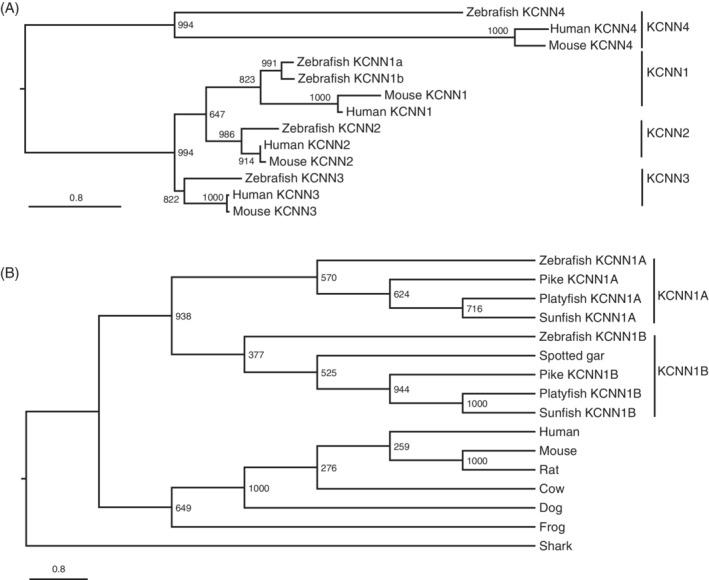
The kcnn1 gene (SK) was duplicated in zebrafish and teleosts. A, Maximum likelihood phylogeny of zebrafish, human, and mouse KCNN genes. Two zebrafish kcnn1 genes were grouped with human and mouse KCNN1 genes. Branch lengths are proportional to expected replacements per site. B, Maximum likelihood phylogeny of vertebrate KCNN1 proteins with representative vertebrate species. In addition to zebrafish, all analyzed teleost species also have two kcnn1a genes. Both phylogenetic trees were inferred with JTT model plus gamma distances using PhyML program. Numbers around each node indicate bootstrap values based on 1000 replicates
2.2. Zebrafish small and intermediate KCa channel genes are expressed distinctly during early embryogenesis
As gene spatial expression may provide insights into where the genes function, we examined gene expression patterns using whole‐mount in situ hybridization. At 12hpf (hours post fertilization), kcnn1a is expressed in the whole body, with higher expression in the posterior area. It is also expressed at the posterior lateral plate mesoderm (Figure 2A, E). At 24hpf, the posterior expression recesses, and kcnn1a is expressed mainly in the brain and anterior neural tube (Figure 2B, F). Cross‐section revealed that it is expressed in the brain telencephalon and the neural tube's lateral side (Figure 2B′,F′). Once the fish embryo reaches 48hpf and 72hpf, the kcnn1a expression is limited to the neurons in various parts of the brain (Figure 2C,D,G,H,C′,C″,G′).
FIGURE 2.
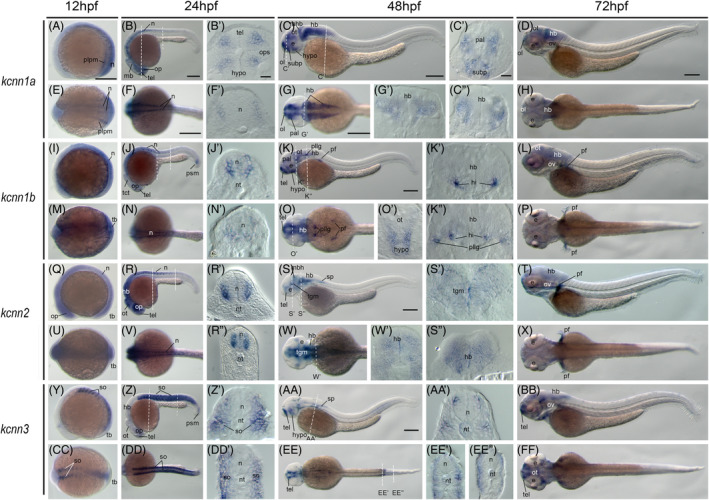
Gene expression of small‐conductance calcium‐activated potassium channel genes in early zebrafish embryos. Whole‐mount in situ hybridization of zebrafish embryos at stages 12hpf (A, E, I, M, Q, U, Y, CC), 24hpf (B, F, J, N, R, V, Z, DD), 48hpf (C, G, K, O, S, W, AA, EE), and 72hpf (D, H, L, P, T, X, BB, FF). Anterior is to the left in all the whole‐mount images, and dorsal is to the top in all transverse sections. Each embryo was imaged from the lateral and dorsal perspective, respectively. A‐D, Lateral view of gene expression of kcnn1a. E‐H, Dorsal view of gene expression of kcnn1a. I‐L, Lateral view of gene expression of kcnn1b. M‐P, Dorsal view of gene expression of kcnn1b. Q‐T, Lateral view of gene expression of kcnn2. U‐X, Dorsal view of gene expression of kcnn2. Y‐BB, Lateral view of gene expression of kcnn3. CC‐FF, Dorsal view of gene expression of kcnn3. The dashed lines indicate the approximate positions of sections. The letters below or around the dashed lines correspond to the section panels. Scale bars are added on the top row of images; 250 μm for whole mount images and 50 μm for tissue sections. e, eye; hb, hind brain; hi, intermediate hypothalamus, hypo, hypothalamus; mb, midbrain; mhb, midbrain‐hindbrain boundary; n, neural tube; nt, notochord; ol, olfactory placodes/organ; op, optic vesicle; ot, optic tectum; ov, otic vesicle; pal, pallium; pf, pectoral fin; pllg, posterior lateral line ganglia; plpm, posterior lateral plate mesoderm; psm, presomitic mesoderm; so, somite; sp, spinal cord; subp, subpallium; tb, tailbud; tel, telencephalon; tgm, tegmentum
The kcnn1b gene has some overlap and distinct expression with the kcnn1a gene. At 12hpf, it has a similar expression pattern with kcnn1a, but is not found expressed in the lateral plate (Figure 2I,M). At 24hpf, it is expressed in the central nervous system and a new domain, presomitic mesoderm (Figure 2J), which later differentiates into paraxial mesoderm. It is also expressed at the neural tube (Figure 2N), but with a broader domain than kcnn1a (Figure 2J′,N′). The difference of kcnn1a and kcnn1b is more evident at the 48hpf stage, at which kcnn1b is in the intermediate hypothalamus, posterior lateral line ganglia, and pectoral fin buds (Figure 2K,K′,K″,O,O′). At 72hpf, kccn1b is limited to the brain region and pectoral fin buds (Figure 2L,P).
Next, we examined the kcnn2 gene, which is ubiquitously expressed in the brain and neural tube at 12hpf stage (Figure 2M,Q). This brain and neural tube expression remains by 24hpf, at which the posterior expression starts to recess (Figure 2R,V). Cross‐section revealed that it is expressed at the lateral sides of the neural tube (Figure 2R′,R″). By the 48hpf stage, its expression is limited to brain regions such as telencephalon, tegmentum, and hindbrain (Figure 2S,S′,S″,W,W′). A new expression domain, pectoral fin bud, emerged at 72hpf (Figure 2T,X).
The kcnn3 gene is mainly expressed in the somites at 12hpf (Figure 2Y,CC). This is different from other kcnn genes. The somite expression is maintained at 24hpf (Figure 2Z,Z′,DD), and it is mainly localized to the dermomyotome in the posterior somites (Figure 2DD′). By 72hpf, kcnn3 neural expression becomes evident (Figure 2AA,EE). In the neural tube, it is expressed at the upper lateral sides. Its somite expression retreats (Figure 2AA,AA′,EE), but can still be detected at the posterior trunk dermomyotome (Figure 2AA,EE′,EE″). In contrast, this somite expression is entirely not detectable by 72hpf. At this stage, it is limited to the brain area (Figure 2BB,FF).
In contrast to other kcnn genes, the intermediate conductance channel gene, kcnn4, is only detected in the distal early tubes of the nephric duct at the 24hpf and 48hpf stage, but not 12hpf (Figure 3A–E,G). This expression recesses by 72hpf (Figure 3F,H), indicating kcnn4 has a temporal function in kidney development.
FIGURE 3.
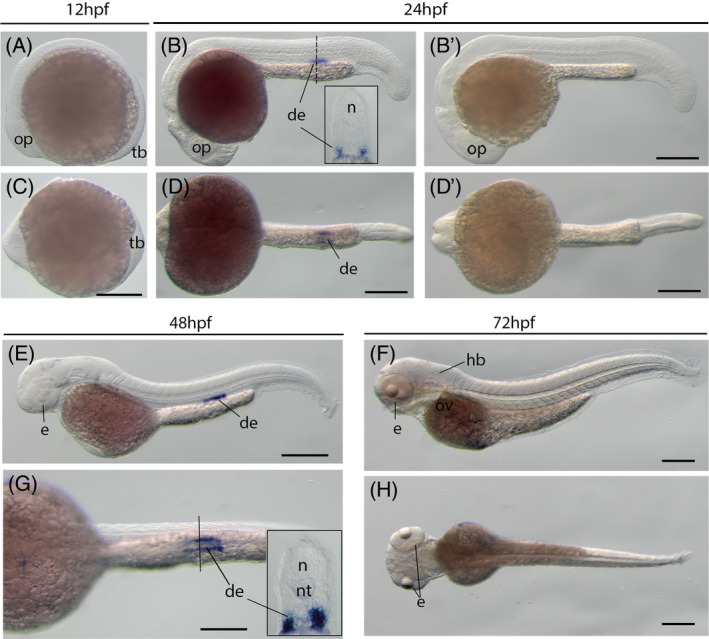
The kcnn4 gene (IK) expression during zebrafish early embryogenesis. Whole‐mount in situ hybridization of zebrafish embryos at stages 12hpf (A,C), 24hpf (B,B′,D,D′), 48hpf (E,G), and 72hpf (F,H). B′ and D′: sense probe controls. Anterior is to the left in all the whole‐mount images, and dorsal is to the top in all transverse sections. A‐D, Lateral view of gene expression of kcnn4. E‐H, Dorsal view of gene expression of kcnn4. The dashed lines indicate the approximate positions of sections. The section images were shown in the insert of corresponding panels. Scale bars: 250 μm for whole mount images. de, distal early tube of the nephric duct; e, eye; hb, hindbrain; n, neural tube; nt, notochord; op, optic vesicle; ov, otic vesicle; tb, tail bud
2.3. Zebrafish has two BK channel genes
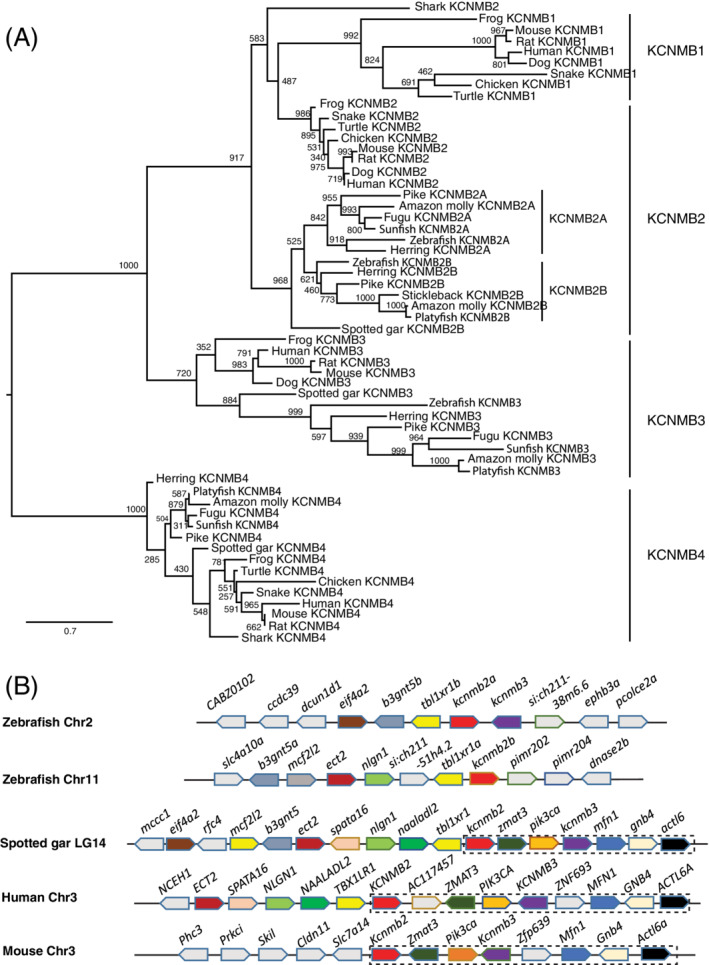
In the current zebrafish genome and NCBI database, we identified two kcnma1 genes: One is listed as kcnma1a ENSDARG00000079840, and the other as KCNMA1 ENSDARG00000110727 in Ensembl. The later one has an identical mRNA, XM_021480452.1, in NCBI (Table 1). We refer to this gene as kcnma1b. To verify these two genes' homology with the tetrapod KCNMA1 gene, we performed phylogenetic analysis (Figure 4A). Our result suggested that these two duplicated paralogous genes resulted from teleost WGD, 17 as they formed distinct clads with other kcnma1 genes from teleost species. This result is consist with a previous report on the teleost kcnma1 gene evolutionary analysis. 18 To further demonstrate these two genes are ohnologs, we conducted syntenic analysis. If they originated from the teleost WGD, they likely share neighbor genes. Indeed, zebrafish kcnma1a shares a conserved synteny (dlg5‐kcnma1‐irmd‐znrf503‐comtd1) with the human, mouse, and spotted gar (Figure 4B). While the kcnma1b gene shares two neighbor genes (dlg5 and anxa11) with kcnma1a (Figure 4B), suggesting that this gene might have evolved faster.
FIGURE 4.
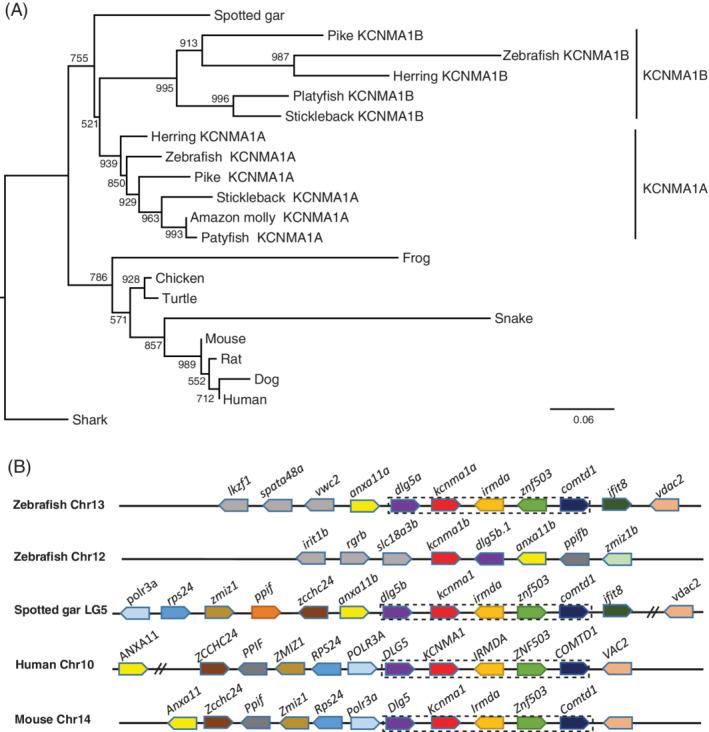
The kcnma1 gene (BK) was duplicated in zebrafish and teleosts. A, Molecular phylogenetic tree generated using ML analysis on vertebrate KCNMA1 proteins as obtained with JTT model plus gamma distribution. Numbers at each node denote bootstrap values based on 1000 replicates. Branch lengths are proportional to expected replacements per site. The tree is rooted with the shark kcnma1 sequence. B, The syntenies of KCNMA1 in four representative vertebrate species. The illustration of the gene and their sizes are not proportional to the length of the distances between genes. KCNMA1 is highlighted in red. The conserved synteny (DLG5‐KCNMA1‐IRMDA‐ZNF503‐COMTD1) is boxed with dashed lines
Next, we examined the expression of the BK genes in zebrafish embryos. The kcnma1a gene is expressed in the somites and hypothalamus at the 12hpf stage. It is also weakly detected at the midbrain and hindbrain areas (Figure 5A,E). By 24hpf, its somite expression remains, and telencephalon and olfactory organ expression become evident (Figure 5B,F). Its somite expression is dominantly restricted to the dermomyotome (Figure 5B,F,insets). This somite expression recesses at 48hpf. At this stage, the kcnma1a gene is mainly found in the brain. It is also detected at the pectoral fin buds (Figure 5C,G). This expression pattern extends to 72hpf (Figure 5D,H). In contrast, the kcnma1b gene expression is located at the anterior somite, hypothalamus, and hindbrain at 12hpf (Figure 5I,M). At 24hpf, it is expressed in all somites and hypothalamus similar to kcnma1a (Figure 5J,N). However, it is also expressed at the floor plate of the neural tube, midbrain, and hindbrain (Figure 5J). By 48hpf and 72hpf, the somite expression retreats, while the neural expression is restricted to the brain region (Figure 5K,O). Both genes are expressed in the otic vesicle at 72hpf. These two genes' expression domains are consistent with a previous report on their function in the zebrafish sensory organs. 19 , 20
FIGURE 5.
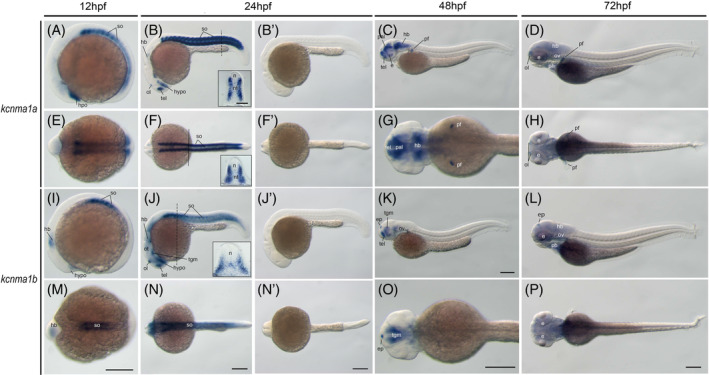
The kcnma1 genes (BK) during zebrafish early embryogenesis. Whole‐mount in situ hybridization of zebrafish embryos at stages 12hpf (A,E,I,M), 24hpf (B,F,J,N,B′,F′,J′,N′), 48hpf (C, G, K, O), and 72hpf (D, H, L, P). Sense riboprobe controls (B′,F′,J′,N′) do not show any specific staining at 24hpf. Anterior is to the left in all the whole‐mount images, and dorsal is to the top in all transverse sections. The dashed lines indicate the positions of sections. The section images were shown in the insert of corresponding panels. A‐D, Lateral view of gene expression of kcnma1a. E‐H, Dorsal view of gene expression of kcnma1a. I‐L, Lateral view of gene expression of kcnma1b. M‐P, Dorsal view of gene expression of kcnma1b. Scale bars are added on the bottom row of images; 250 μm for whole‐mount images and 50 μm for tissue sections. e, eye; ep, epiphysis; hb, hindbrain; hypo, hypothalamus; n, neural tube; nt, notochord; ol, olfactory placodes/organ; op, optic vesicle; ot, optic tectum; ov, otic vesicle; pal, pallium; pf, pectoral fin; ph, pharyngeal arches; so, somite; tb, tailbud; tel, telencephalon; tgm, tegmentum
2.4. Zebrafish beta units of BK channel genes were duplicated
BK channels are known to function as a complex with other proteins. The beta unit is one of the channel modifiers. To better understand the BK gene function in early embryogenesis, we examined the beta unit coding genes. By BLAST search using human genes as bait, we identified two kcnmb2 genes (kcnmb2a, kcnmb2b/si:ch211‐247n2.1) and one kcnmb3 (si:ch211‐38m6.7; Table 1). Interestingly, we did not identify any kcnmb1 and kcnmb4 genes in zebrafish and any other teleosts from current genome databases, suggesting the two genes were lost after the separation of teleost from the rest of the vertebrate lineage after WGDs. 21 , 22 To resolve homologous gene relationships, we chose kcnmb genes from some representative species and conducted a phylogenetic analysis using corresponding protein sequences. All candidate zebrafish kcnmb genes formed four distinct clades with other species (Figure 6A). The two kcnmb2 genes formed sub‐groups within the kcnmb2 clade, suggesting that they are gene duplicates. All analyzed teleost genes were consistent with zebrafish, indicating the two duplicated resulted from the teleost WGD event. To further demonstrate the two kcnmb2 genes are ohnologs, we performed synteny analysis in zebrafish, human, mouse, and spotted gar. A stable synteny (kcnmb2‐zmat3‐pik3ca‐kcnmb3‐mfn1‐gnb4‐actl6a) was identified among spotted gar, human, and mouse (Figure 6B). The zebrafish kcnmb2a is linked with tbl1xr1b and kcnmb3. In contrast, kcnmb2b is linked with tbl1xr1a. These results suggest that there was a gene positional reshuffling after the teleost WGD.
FIGURE 6.
Zebrafish beta unit genes were duplicated. A, Molecular phylogenetic tree generated using ML analysis on vertebrate KCNMB proteins as obtained with JTT model plus gamma distribution. Numbers at each node denote bootstrap values based on 1000 replicates. Branch lengths are proportional to expected replacements per site. Each protein forms a distinct clade. B, The synteny of KCNMB1 in four representative vertebrate species. The illustration of the genes and their sizes are not proportional to the length of the distances between genes. KCNMB2 is highlighted in red. The conserved synteny (KCNMB2‐ZMAT3‐PIK3CA‐KCNMB3‐MFN1‐GNB4‐ACTL6A) is boxed with dashed lines. The zebrafish kcnmb2a is still linked with kcnmb3
We then examined these three kcnmb genes' expression in zebrafish embryos. The kcnmb2a gene is in the brain and anterior neural tube at 12hpf (Figure 7A,E). By 24hpf, it is mainly expressed in the anterior somites (Figure 7B,F). Within each somite, it is expressed mediolaterally to the dermomyotme (Figure 7B′,F′). This somite expression remains at 48hpf. At this stage, it is also expressed in the midbrain, tegmentum (Figure 7C,G). However, it is barely detected once the embryo reaches 72hpf (Figure 7D,H). In contrast to kcnmb2a, the kcnmb2b gene is more ubiquitously expressed in 12hpf fish embryos (Figure 7I,M). This ubiquitous expression remains at 24hpf (Figure 7J,J′,N,N′). After that, it retracts from posterior to anterior, and is expressed in the whole brain and the eye. It is also found at the pectoral fin buds (Figure 7K,O). At 72hpf, its brain expression recesses, and it is mainly detected in the gill arches and pectoral fins (Figure 7L,P). Although the kcnmb3 gene is physically linked with kcnmb2a on zebrafish chromosome 2 (Figure 6B), it has a similar expression pattern to kcnmb2b instead of kcnmb2a (Figure 6Q‐X). From 12hpf to 24hpf, it is ubiquitously expressed in zebrafish embryos with relatively low level in the notochord (Figure 6Q‐V,R′,V′). At 48hpf, it is mainly expressed in the brain region in addition to pectoral fin buds (Figure 6S,W). While, at 72hpf, it is expressed in the gill arches and pectoral fins (Figure 6T,X). Overall, kcnmb2b and kcnmb3 have similar expression pattern at these embryonic stages.
FIGURE 7.
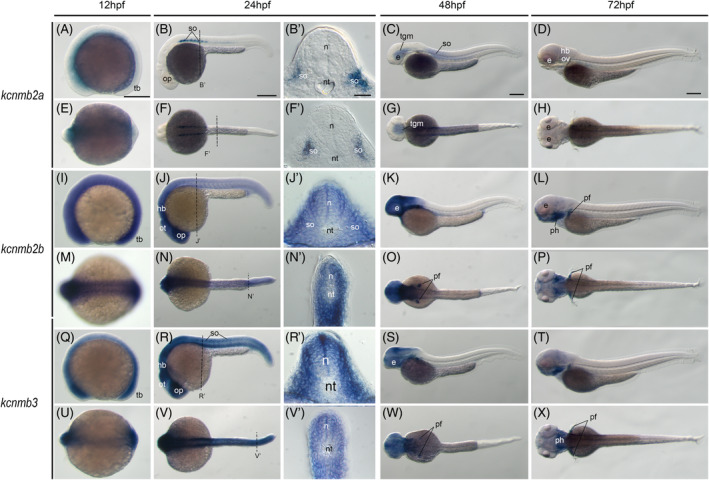
Zebrafish beta unit gene expression patterns during early embryogenesis. Whole‐mount in situ hybridization of zebrafish embryos at stages 12hpf (A,E,I,M,Q,U), 24hpf (B,F,J,N,R,V), 48hpf (C,G,K,O,S,W), and 72hpf (D,H,L,P,T,X). Anterior is to the left in all the whole‐mount images, and dorsal is to the top in all transverse sections. Each embryo was imaged laterally and dorsally, respectively. A‐D, Lateral view of gene expression of kcnmb2a. E‐H, Dorsal view of gene expression of kcnmb2a. I‐L, Lateral view of gene expression of kcnm2b. M‐P, Dorsal view of gene expression of kcnm2b. Q‐T. Lateral view of gene expression of kcnmb3. U‐X. Dorsal view of gene expression of kcnmb3. The dashed lines indicate the approximate positions of sections. The letters below or around the dashed lines correspond to the panels. Scale bars are added on the top row of images; 250 μm for whole mount images and 50 μm for tissue sections. e, eye; hb, hindbrain; n, neural tube; nt, notochord; op, optic vesicle; ot, optic tectum; ov, otic vesicle; pf, pectoral fin; ph, pharyngeal arch; so, somite; tb, tailbud
2.5. Zebrafish have duplicated kcnt genes
The kcnt gene has a similar structure to the kcnma1 gene, but lack the S0 transmembrane domain. 10 , 11 These channels are more sodium activated instead of calcium‐activated. Here, we also searched for kcnt genes in the zebrafish genome. We identified 4 kcnt genes (kcnt1a, kcnt1b, kcnt2a, and kcnt2b) by BLAST (Table 1). Phylogenetic analysis placed these four genes in kcnt1 and kcnt2 clades, respectively. The teleost species has two copies of kcnt1 and kcnt2 (Figure 8), indicating they originated from the teleost‐specific WGD event.
FIGURE 8.
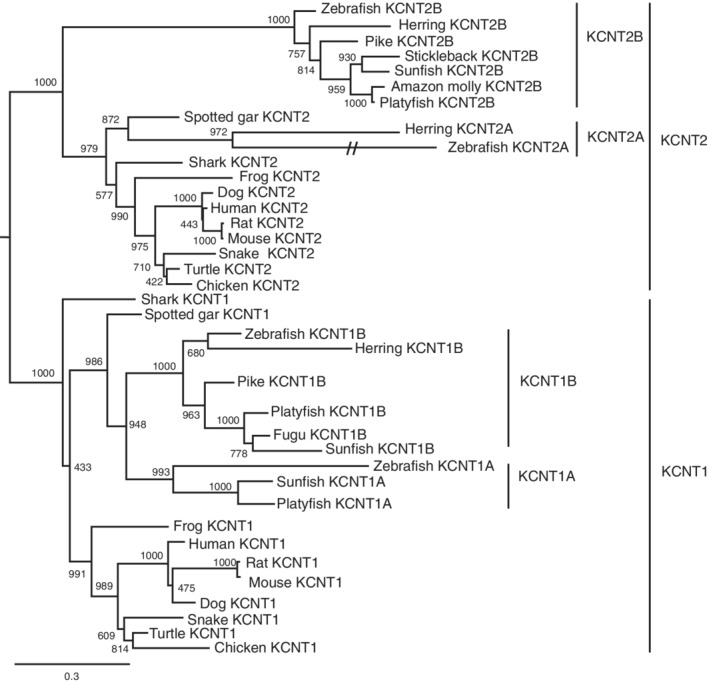
Maximum likelihood phylogenetic analysis of vertebrate KCNT proteins. Molecular phylogenetic tree generated using ML analysis on vertebrate KCNT proteins as obtained with JTT model plus gamma distribution. Numbers at each node denote bootstrap values based on 1000 replicates. Branch lengths are proportional to expected replacements per site. Each protein forms a distinct clade. The dashed lines indicate a long‐branch of the zebrafish Kcnt2a. Teleost species possess both Kcnt1 and Kcnt2 proteins
To better understand their functions during early development, we examined their expression in zebrafish embryos. The kcnt1a gene is not detectable in 12hpf fish embryos (Figure 9A,E). By 24hpf, it is found at the olfactory organ (Figure 9B,B′,B″,F). This pattern is maintained at 48hpf and 72hpf (Figure 9C‐D,G‐H). It is also expressed at the tegmentum and the midbrain at 72hpf (Figure 9D,H). The kcnt1b gene is found at the Kupffer's vesicle (Figure 9I,M) at 12hpf. It starts to be expressed at the hypothalamus, midbrain, hindbrain, and Rohan beard neurons of the neural tube at 24hpf (Figure 9J,J′,N,N′,N″). Whereas its expression is limited to the olfactory organs, subpallium, otic vesicle, and some neural nuclei at 48hpf and 72hfp (Figure 9,K‐L, O‐P).
FIGURE 9.
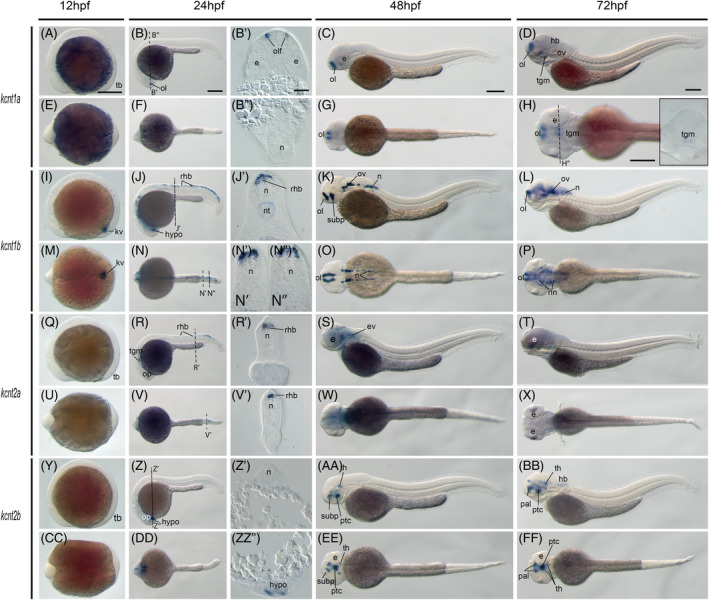
Gene expression patterns of the zebrafish kcnt genes. Whole‐mount in situ hybridization of zebrafish embryos at stages 12hpf (A, E, I, M, Q, U, Y, CC), 24hpf (B, F, J, N, R, V, Z, DD), 48hpf (C, G, K, O, S, W, AA, EE), and 72hpf (D, H, L, P, T, X, BB, FF). Anterior is to the left in all the whole‐mount images, and dorsal is to the top in all transverse sections, except panel B′ and B″. Each embryo was imaged laterally and dorsally, respectively. A‐D, Lateral view of gene expression of kcnt1a. E‐H, Dorsal view of gene expression of kcnt1a. I‐L. Lateral view of gene expression of kcnt1b. M‐P, Dorsal view of gene expression of kcnt1b. Q‐T, Lateral view of gene expression of kcnt2a. U‐X, Dorsal view of gene expression of kcnt2a. Y‐BB, Lateral view of gene expression of kcnt2b. CC‐FF, Dorsal view of gene expression of kcnt2b. The dashed lines indicate the approximate positions of sections. The letters below or around the dashed lines correspond to the panels. Scale bars are added on the top row of images; 250 μm for whole mount images and 50 μm for tissue sections. e, eye; hb, hindbrain; hypo, hypothalamus; kv, Kupffer's vesicle; n, neural tube; nn, neural nucleus; nt, notochord; ol, olfactory placodes/organ; op, optic vesicle; ov, otic vesicle; pal, pallium; ptc,, posterior tuberculum; rhb, rohon beard neurons; subp, subpallium; tb, tailbud; th, thalamus; tgm, tegmentum
The kcnt2a gene is not detected at 12hpf, but at 24hpf it is expressed in the tegmentum and Rohon beard neurons of the neural tube (Figure 9Q‐R,R′,U‐V,V′). By 48hpf, it is mainly found in the brain region and otic vesicle (Figure 9S,W). This expression is maintained at 72hpf (Figure 9T‐X). Similar to kcnt2a, knct2b is also not detected at 12hpf. By 24hpf, is found at the hypothalamus (Figure 9Y‐Z,Z′,Z″,CC‐DD). The kcnt2b gene is expressed at the subpallium, posterior tuberculum, and thalamus at 48hpf (Figure 9AA,EE). This expression pattern remains at 72hpf, but it is also found the hindbrain (Figure 9BB,FF).
3. DISCUSSION
We have identified 14 KCa channel genes in the zebrafish genome and found that some of them were duplicated. Some mammalian orthologues were lost after the split of the teleosts. Moreover, we examined their gene expression during zebrafish early embryogenesis. Most of them showed variable expression patterns through each embryonic stage. Some of them are expressed in non‐neural tissues, suggesting that they might be needed for normal embryonic developmental processes, such as differentiation and patterning.
3.1. Evolution of vertebrate KCa channel genes
The KCa channel genes have been extensively studied in model organisms such as fly and human cells. Their functions are generally evolutionarily conserved. As reported in the literature, there is usually one Kcnn and kcnt gene in invertebrates such as fruit fly. However, there are four KCNN genes (KCNN1‐KCNN4) in most mammalian species. This is a general phenomenon found with many other gene families such as BMP (BMP2, BMP4, BMP16), Hedgehog (SHH, IHH, DHH), and KANK (KANK1‐KANK4) genes. 23 , 24 , 25 The best representatives are the HOX gene clusters. 26 , 27 There is only one hox gene cluster in the fruit fly and other invertebrates, but there are 4 HOX gene clusters in tetrapods (HOXA, HOXB, HOXC, and HOXD). These gene number expansions most likely resulted from the two rounds of WGD around the vertebrates' dawn. 15 , 28 , 29 The two rounds of WGDs are critical for the vertebrate morphological novelties since they led to the expansion of the genetic component for the developmental tool kit. 30 , 31 In addition to the two rounds of vertebrate WGD (2R), there was a third round of WGD (third R) in teleost lineages before the split of spotted gar that happened about 300 million years ago. 13 , 15 , 32 , 33 This teleost specific WGD further increases the gene numbers for teleost. For example, there are seven hox gene clusters in zebrafish. It is worth noting that not all the duplicated genes remain, some duplicated ones were lost or became pseudogenes after the WGD event. 34 , 35 Thus, there could be an odd number of genes in certain gene families.
Based on our genomic and phylogenetic analyses, we propose a model of KCa gene evolution in vertebrates (Figure 10). All the vertebrate KCa genes resulted from the vertebrate WGDs (1R and 2R). After the 2R, two of the slo1 ohnologs and two of the kcnt ohnologs (kcnt3 and kcnt4) were lost, only kcnma1 and kcnu1, kcnt1 and kcnt2 genes were retained in the early vertebrate lineages (Figure 10). All the duplicated kcnn and kcnmb ohnologous genes remains (Figure 10). The teleost‐specific WGD (3R) further reshaped the gene numbers of this group of genes through gene duplication and gene loss. A few genes (kcnma1a & kcnma1b, kcnt2a & kcnt2b, kcnmb2a & kcnmb2b, and kcnn1a & kcnn1b) were duplicated in zebrafish and other teleost species. All the teleost lost the kcnu1 (KCa5.1, Kcnma3, and Slo3) and kcnmb1. Zebrafish also lost kcnmb4, but this gene is present in other teleost species, indicating the KCa gene number could be further modified through speciation after WGDs.
FIGURE 10.
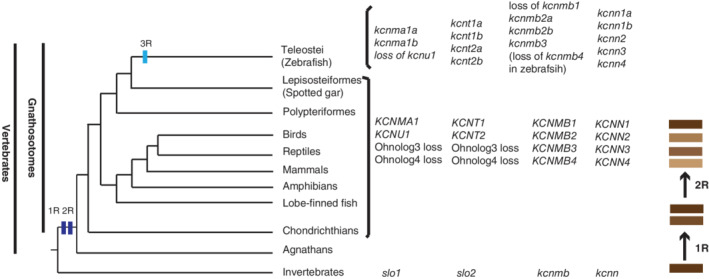
Model of vertebrate KCa genes' evolutionary history. The phylogenetic relationships of vertebrata are based on our col2a1 and kank genes' phylogenetic analyses. 23 , 53 , 54 The branch lengths are not proportional to the time of diversification. The two vertical dark blue bars on the tree indicate the WGD events (R1 and R2) at the origin of the vertebrates. The light blue vertical bar represents the teleost specific WGD. The process of gene duplication and diversification through WGD is illustrated by the brown bars on the far‐right side of the illustration. The representative KCa genes present in the vertebrates that are listed on the right side of these taxa. The presence of these genes may be variable in specific species, as exemplified by the loss of kcnmb4 in zebrafish, but not in other teleost species
3.2. Overlapping but distinct gene expression of the duplicated zebrafish genes
For these retained duplicated genes, they became redundant, and they are expressed in the same type of cell or tissue immediately after WGD. As the protein coding region and regulatory region (enhancers and silencers) evolve at different rates due to the pleiotropic functional constraints on the protein‐coding regions, two scenarios emerge as proposed by the DDC model. 36 (a). Subfunctionalization: The duplicates split the functions of their ancestor gene. (b). Neofunctionalization: one of the copies is expressed at a new cell or tissue type once its regulatory region changed dramatically. Consistent with this theory, our results of the zebrafish kcnn1a and kcnn1b showed similar expression domains during development. For example, both genes are expressed at the brain and neural tubes, but kcnn1a is uniquely expressed at lateral plate mesoderm, and kcnn1b has a distinct presomitic mesoderm expression at 24hpf, and pectoral fin bud expression at 48hpf. Similarly, both kcnma1a and kcnma1b are expressed at somite and dermomyotome at 12hpf and 24hpf, respectively. However, only kcnma1a is found at the fin bud at 48hpf and 72hpf. The two pairs of kcnt1 (kcnt1a and kcnt1b) and kcnt2 (kcnt2a and kcnt2b) are mainly expressed in the neural nucleus, but they do not share many expression domains. Interestingly, kcnt1b and kcnt2a are expressed in the Rohon beard neurons suggesting their ancestor gene might play important roles in this type of neuron. It would be interesting to compare these gene expression patterns from basal vertebrates such as hagfish, lamprey, and sharks.
3.3. KCa channel expression in non‐neuronal tissues during early embryogenesis
While ion channel function in neuronal tissues is widely accepted, other cells and tissues are relatively less appreciated. Here, we show that most of the KCa channel genes are expressed in the developing zebrafish brain and neural tubes/spine. They are also found in various non‐excitatory cells, such as somites, eyes, fins, kidneys, olfactory organs, and other embryonic tissues. Our findings on KCa genes during embryogenesis is consistent with previous reports that some voltage‐gated ion channels are also expressed at specific stages during Xenopus and mammalian embryogenesis. 37 Understanding the distinct expression patterns of these channels during embryonic development could be essential to reveal new mechanisms for human channelopathies and congenital diseases. Accumulating evidence is revealing that ion channels are key players for embryogenesis through bioelectricity, 38 , 39 which is endogenous electrical signaling mediated by the dynamic distribution of charged molecules via channels, pumps, and gap junctions. Mutations of these genes were reported to cause abnormal structural development in multiple species. The kcnk5 and slc12a7a mutant zebrafish develop elongated fins in zebrafish. The kcnj2 gene was found to regulate wing disc and human craniofacial development. 40 , 41 , 42 The CaV1.2 can regulate chondrogenesis during limb development. 43 We recently demonstrated that the ectopic expression of the kcnj13 gene in zebrafish somite could lead to elongated fins in zebrafish. 44 This suggests that the ion channel genes in the non‐excitatory cells could be important for tissue and organ patterning and differentiation during embryogenesis. Along this direction, future functional studies may be pursued to target expression domains. For example, kcnn3 and kcnma1a are also expressed explicitly in the dermomyotome around 24hpf. It will be interesting to know whether they are needed for zebrafish fin patterning as the kcnj13 gene. To address this, we could employ the CRISPR approach to make conventional large knockout 45 or tissue‐specific knockout 46 , 47 to inactivate the two genes and examine fin developmental abnormalities or defects in the future.
4. EXPERIMENTAL PROCEDURES
4.1. Zebrafish strains and husbandry
Zebrafish were raised and maintained following AAALAC approved standards at the Purdue animal housing facility. Experiments were performed according to approved protocols by the Purdue Animal Care and Use Committee (PACUC). All the zebrafish experiments were carried out in wildtype TAB background. Zebrafish were maintained according to the zebrafish book. 48 Zebrafish embryo were staged based on Kimmel staging guide. 49
4.2. Bioinformatics and phylogenetic analysis
Zebrafish KCa channel protein sequences were first identified through searches of the NCBI database using human gene symbols. The un‐annotated protein sequences were identified through BLASTp in Ensembl and NCBI using according human orthologous protein sequences as a query. Representative protein sequences from the major metazoan taxa were selected based on their taxonomic positions. Whenever there were multiple isoforms, the longest sequence was chosen for analysis. The final protein accession numbers and species are listed in the Table S1.
Multiple protein sequences were aligned using MUSLE program. 50 To identify the best evolutionary model for phylogenetic analysis, we carried out a best model test using maximum likelihood (ML) and default parameters in MEGA6. 51 The models with lowest Bayesian Information Criterion (BIC) scores were considered to describe the substitution pattern the best, and JTT + G was chosen. Then, we constructed phylogenetic trees using PhyML3.1. 52 ML phylogenetic analysis was performed using JTT + G with 1000 bootstrap replicates. 53 , 54 The final phylogenetic trees were viewed and generated with FigTree V1.4.2 (http://tree.bio.ed.ac.uk/software/figtree). The syntenic analysis was first carried out in Genomicus browser (version 100.01). Individual gene position was then verified in Ensembl, UCSC genome browser, Synteny Database. 55
4.3. Zebrafish gene cloning
A whole open reading frame was amplified with RT‐PCR using gene‐specific primers for each identified zebrafish KCa channel gene. Primers were designed in ApeE program using default settings. CACC Kozak sequences were added at the 5′d end of forward primer to prepare direct Topo cloning. Total RNAs were exacted from pooled fish embryos composed of about a hundred 1‐3 dpf fish embryos using TRIzol reagent (Thermo Fisher) according to manufactory guidance. After quality checking and quantification by Nanodrop, Reverse transcription was carried out with the SuperScript III First‐Strand Synthesis System (Thermo Fisher) following manual instructions. Phusion High‐Fidelity DNA Polymerase master mix (New England Biolabs) or PrimeSTAR GXL DNA Polymerase (Takara Bio) were chosen for PCR amplification. PCR primers utilized are listed in Table S2. PCR products were then purified with NucleoSpin Gel and PCR Clean‐up Kit (Takara Bio). Purified PCR products of each gene were cloned into the pENTR‐D‐TOPO or pDONR221 vector and transformed into Top10 Escherichia coli cells using the pENTR Directional TOPO Cloning Kit (Thermo Scientific) according to its manual instruction. Correct clones with the right gene orientation and sequences were verified with Sanger sequencing. All the zebrafish KCa gene clones are available through Addgene (Plasmid #164951‐164964).
4.4. Whole‐mount in situ hybridization, cryosection, and imaging
Riboprobe DNA templates were prepared either by PCR (size <2 kbps) or plasmid linearization (size>2 kbps) with an endonuclease at the 5′ end of the protein‐coding region in the pENTR vector. DNA templates were purified with the NucleoSpin Gel and PCR Clean‐up Kit (Takara Bio). Anti‐sense riboprobes were synthesized with T7 RNA polymerase (Thermo Scientific) and DIG RNA Labeling Mix (Roche, 11277073910) by in vitro transcription. Sense riboprobes were synthesized with Sp6 RNA polymerase (Thermo Scientific) and DNA templates that were generated by PCRs (Sp6 promoter was added to the 5 end of gene‐specific forward primers). Synthesized riboprobes were purified with Sigma Spin post‐reaction clean‐up columns (Sigma, S5059). About 1‐2 μL of these probes were added per reaction tube for in situ hybridization.
Whole‐mount in situ hybridizations were performed according to the previous published method with some modifications. 23 , 56 Briefly, zebrafish embryos were collected, maintained, and staged according to the zebrafish development staging guide. 49 Chorions were removed using pronase (Sigma) treatment before fixation. Zebrafish embryos were then fixed with 4% PFA overnight at 4°C and then dehydrated using serial methanol (25%, 50%, 75%, and 100%) with PBST (Phosphate‐buffered saline solution with 0.1% tween‐20). Dehydrated embryos were stored at −20°C until used for experiments. To perform the WISH, fish embryos were rehydrated using the reverse gradient methanol in PBST. Embryos (12‐24hpf) were then bleached with 6% H2O2 in PBT until all tissues were clear. 48 to 72hpf embryos were bleached with 3% H2O2 and 0.5% KOH to remove pigmentation. Fish embryos were permeabilized with proteinase K (10 μg/mL in PBT): 8 to 18hpf, 3 minutes; 24hpf, 5 minutes; 48 hpf, 20 to 30 minutes; 72hpf, 45 to 60 minutes at room temperature. After permeabilization, embryos were washed with PBT and fixed in 4% PFA with 0.2% glutaraldehyde for 3 hours at room temperature to inactivate proteinase K. Next, fish embryos were washed with PBT (2 × 10 minutes) to remove fixatives. Then, fish embryos were incubated in pre‐hybridization solution [50% formamide, 5XSSC (0.75 M NaCl, 75 mM sodium citrate, pH 7.0.), 2% Roche blocking powder, 0.1% Triton‐X, 50 mg/mL heparin, 1 mg/mL Torula yeast RNA, 1 mM EDTA, 0.1% CHAPS, DEPC‐treated ddH2O] overnight at 65°C in hybridization oven with gentle shaking (40 rpm). Riboprobes were added on the second day. Then, embryos were further hybridized for another 48 to 72 hours before washing out unbound riboprobes using 2× SSC and 0.2× SSC (3 × 30 minutes for each solution). Next, fish embryos were washed with KTBT 2× for 10 minutes each (50 mM Tris‐HCl, pH 7.5, 150 mM NaCl, 10 mM KCl, 1.0% Tween‐20) before antigen blocking using 20% sheep serum in KTBT for 3 hours. Anti‐digoxigenin antibody conjugated to alkaline phosphatase (Roche) was added into the blocking solution in a ratio of 1:5000, and embryos were incubated overnight at 4°C with gentle shaking. After 6× 1‐hour washing with KTBT and overnight KTBT incubation at 4°C with gentle shaking, the following day, color reaction was carried out in NTMT solution (100 mM Tris‐HCl, pH 9.5, 50 mM MgCl2, 100 mM NaCl, 0.5% Tween‐20) with 75 mg/mL NBT (Roche), 50 mg/mL BCIP (Roche), and 10% DMF (N,N‐dimethylformamide). Color development was carried out in the dark with gentle rocking. We monitor the color density of each reaction closely. Once the embryos developed suitable color density, the reaction was stopped with NTMT washing. The finished samples were imaged immediately or stored in 4% paraformaldehyde for later imaging.
For histological analysis, posthybridization embryos were equilibrated in 15% sucrose overnight, then 30% sucrose in 20% gelatin, after which they were embedded in 20% gelatin for cryosection (25 μm) on a cryotome. Images were acquired using Axio CamMRc camera on Zeiss Stereo Discovery.V12 and Axio Imager 2 compound microscope. Whole‐mount embryos were imaged in 3% methylcellulose.
CONFLICT OF INTEREST
The authors declare no conflict of interests.
AUTHOR CONTRIBUTIONS
Martin Silic: Formal analysis, Investigation, Methodology, Writing‐review and editing. Maya Black: Investigation, Writing‐review and editing. GuangJun Zhang: Conceptualization, Formal analysis, Funding acquisition, Investigation, Methodology, Supervision, Writing‐original draft, Writing‐review and editing.
Supporting information
Table S1 Protein sequences used for phylogenetic analysis
Table S2 Primer sequences for zebrafish KCa gene cloning
ACKNOWLEDGMENTS
The research was supported by the National Institute of General Medical Sciences of the National Institutes of Health (R35 GM‐124913) to GuangJun Zhang. The content is solely the responsibility of the authors and does not necessarily represent the official views of the funding agents.
Silic MR, Black MM, Zhang GJ. Phylogenetic and developmental analyses indicate complex functions of calcium‐activated potassium channels in zebrafish embryonic development. Developmental Dynamics. 2021;250:1477–1493. 10.1002/dvdy.329
Funding information National Institute of General Medical Sciences of the National Institutes of Health, Grant/Award Number: R35 GM‐124913
REFERENCES
- 1. Huang X, Jan LY. Targeting potassium channels in cancer. J Cell Biol. 2014;206(2):151‐162. 10.1083/jcb.201404136. [DOI] [PMC free article] [PubMed] [Google Scholar]
- 2. Brown BM, Shim H, Christophersen P, Wulff H. Pharmacology of small‐ and intermediate‐conductance calcium‐activated potassium channels. Annu Rev Pharmacol Toxicol. 2020;60:219‐240. 10.1146/annurev-pharmtox-010919-023420. [DOI] [PMC free article] [PubMed] [Google Scholar]
- 3. Kaczmarek LK, Aldrich RW, Chandy KG, Grissmer S, Wei AD, Wulff H. International union of basic and clinical pharmacology. C. Nomenclature and properties of calcium‐activated and sodium‐activated potassium channels. Pharmacol Rev. 2017;69(1):1‐11. 10.1124/pr.116.012864. [DOI] [PMC free article] [PubMed] [Google Scholar]
- 4. Kshatri AS, Gonzalez‐Hernandez A, Physiological Roles GT. Therapeutic potential of Ca(2+) activated potassium channels in the nervous system. Front Mol Neurosci. 2018;11:258. 10.3389/fnmol.2018.00258. [DOI] [PMC free article] [PubMed] [Google Scholar]
- 5. Vergara C, Latorre R, Marrion NV, Adelman JP. Calcium‐activated potassium channels. Curr Opin Neurobiol. 1998;8(3):321‐329. 10.1016/s0959-4388(98)80056-1. [DOI] [PubMed] [Google Scholar]
- 6. Feske S, Wulff H, Skolnik EY. Ion channels in innate and adaptive immunity. Annu Rev Immunol. 2015;33:291‐353. 10.1146/annurev-immunol-032414-112212. [DOI] [PMC free article] [PubMed] [Google Scholar]
- 7. Kohler M, Hirschberg B, Bond CT, et al. Small‐conductance, calcium‐activated potassium channels from mammalian brain. Science. 1996;273(5282):1709‐1714. 10.1126/science.273.5282.1709. [DOI] [PubMed] [Google Scholar]
- 8. Joiner WJ, Wang LY, Tang MD, Kaczmarek LK. hSK4, a member of a novel subfamily of calcium‐activated potassium channels. Proc Natl Acad Sci U S A. 1997;94(20):11013‐11018. 10.1073/pnas.94.20.11013. [DOI] [PMC free article] [PubMed] [Google Scholar]
- 9. Ishii TM, Silvia C, Hirschberg B, Bond CT, Adelman JP, Maylie J. A human intermediate conductance calcium‐activated potassium channel. Proc Natl Acad Sci U S A. 1997;94(21):11651‐11656. 10.1073/pnas.94.21.11651. [DOI] [PMC free article] [PubMed] [Google Scholar]
- 10. Contreras GF, Castillo K, Enrique N, et al. A BK (Slo1) channel journey from molecule to physiology. Channels (Austin). 2013;7(6):442‐458. 10.4161/chan.26242. [DOI] [PMC free article] [PubMed] [Google Scholar]
- 11. Salkoff L, Butler A, Ferreira G, Santi C, Wei A. High‐conductance potassium channels of the SLO family. Nat Rev Neurosci. 2006;7(12):921‐931. 10.1038/nrn1992. [DOI] [PubMed] [Google Scholar]
- 12. Bailey CS, Moldenhauer HJ, Park SM, Keros S, Meredith AL. KCNMA1‐linked channelopathy. J Gen Physiol. 2019;151(10):1173‐1189. 10.1085/jgp.201912457. [DOI] [PMC free article] [PubMed] [Google Scholar]
- 13. Ravi V, Venkatesh B. The divergent genomes of teleosts. Annu Rev Anim Biosci. 2018;6:47‐68. 10.1146/annurev-animal-030117-014821. [DOI] [PubMed] [Google Scholar]
- 14. Lorin T, Brunet FG, Laudet V, Volff JN. Teleost fish‐specific preferential retention of pigmentation gene‐containing families after whole genome duplications in vertebrates. G3 (Bethesda). 2018;8(5):1795‐1806. 10.1534/g3.118.200201. [DOI] [PMC free article] [PubMed] [Google Scholar]
- 15. Meyer A, Schartl M. Gene and genome duplications in vertebrates: the one‐to‐four (−to‐eight in fish) rule and the evolution of novel gene functions. Curr Opin Cell Biol. 1999;11(6):699‐704. 10.1016/s0955-0674(99)00039-3. [DOI] [PubMed] [Google Scholar]
- 16. Postlethwait JH, Woods IG, Ngo‐Hazelett P, et al. Zebrafish comparative genomics and the origins of vertebrate chromosomes. Genome Res. 2000;10(12):1890‐1902. [DOI] [PubMed] [Google Scholar]
- 17. Wolfe K. Robustness—it's not where you think it is. Nat Genet. 2000;25(1):3‐4. 10.1038/75560. [DOI] [PubMed] [Google Scholar]
- 18. Rohmann KN, Deitcher DL, Bass AH. Calcium‐activated potassium (BK) channels are encoded by duplicate slo1 genes in teleost fishes. Mol Biol Evol. 2009;26(7):1509‐1521. 10.1093/molbev/msp060. [DOI] [PMC free article] [PubMed] [Google Scholar]
- 19. Rohmann KN, Tripp JA, Genova RM, Bass AH. Manipulation of BK channel expression is sufficient to alter auditory hair cell thresholds in larval zebrafish. J Exp Biol. 2014;217(14):2531‐2539. 10.1242/jeb.103093. [DOI] [PMC free article] [PubMed] [Google Scholar]
- 20. Cabo R, Zichichi R, Vina E, et al. Calcium‐activated potassium channel SK1 is widely expressed in the peripheral nervous system and sensory organs of adult zebrafish. Neurosci Lett. 2013;555:62‐67. 10.1016/j.neulet.2013.09.026. [DOI] [PubMed] [Google Scholar]
- 21. McGrath CL, Gout JF, Johri P, Doak TG, Lynch M. Differential retention and divergent resolution of duplicate genes following whole‐genome duplication. Genome Res. 2014;24(10):1665‐1675. 10.1101/gr.173740.114. [DOI] [PMC free article] [PubMed] [Google Scholar]
- 22. Pasquier J, Cabau C, Nguyen T, et al. Gene evolution and gene expression after whole genome duplication in fish: the PhyloFish database. BMC Genomics. 2016;17:368. 10.1186/s12864-016-2709-z. [DOI] [PMC free article] [PubMed] [Google Scholar]
- 23. Hensley MR, Cui Z, Chua RFM, et al. Evolutionary and developmental analysis reveals KANK genes were co‐opted for vertebrate vascular development. Sci Rep. 2016;6:27816. 10.1038/srep27816. [DOI] [PMC free article] [PubMed] [Google Scholar]
- 24. Marques CL, Fernandez I, Viegas MN, et al. Comparative analysis of zebrafish bone morphogenetic proteins 2, 4 and 16: molecular and evolutionary perspectives. Cell Mol Life Sci. 2016;73(4):841‐857. 10.1007/s00018-015-2024-x. [DOI] [PMC free article] [PubMed] [Google Scholar]
- 25. Pereira J, Johnson WE, O'Brien SJ, et al. Evolutionary genomics and adaptive evolution of the hedgehog gene family (Shh, Ihh and Dhh) in vertebrates. PLoS One. 2014;9(12):e74132. 10.1371/journal.pone.0074132. [DOI] [PMC free article] [PubMed] [Google Scholar]
- 26. Wagner GP, Amemiya C, Ruddle F. Hox cluster duplications and the opportunity for evolutionary novelties. Proc Natl Acad Sci U S A. 2003;100(25):14603‐14606. 10.1073/pnas.2536656100. [DOI] [PMC free article] [PubMed] [Google Scholar]
- 27. Amores A, Force A, Yan YL, et al. Zebrafish hox clusters and vertebrate genome evolution. Science. 1998;282(5394):1711‐1714. 10.1126/science.282.5394.1711. [DOI] [PubMed] [Google Scholar]
- 28. Dehal P, Boore JL. Two rounds of whole genome duplication in the ancestral vertebrate. PLoS Biol. 2005;3(10):e314. 10.1371/journal.pbio.0030314. [DOI] [PMC free article] [PubMed] [Google Scholar]
- 29. Ohno S. Evolution by Gene Duplication. New York: Springer Science+Business Media, LLC; 1970. [Google Scholar]
- 30. Wagner GP, Lynch VJ. Evolutionary novelties. Curr Biol. 2010;20(2):R48‐R52. 10.1016/j.cub.2009.11.010. [DOI] [PubMed] [Google Scholar]
- 31. Van de Peer Y, Maere S, Meyer A. The evolutionary significance of ancient genome duplications. Nat Rev Genet. 2009;10(10):725‐732. 10.1038/nrg2600. [DOI] [PubMed] [Google Scholar]
- 32. Woods IG, Kelly PD, Chu F, et al. A comparative map of the zebrafish genome. Genome Res. 2000;10(12):1903‐1914. [DOI] [PMC free article] [PubMed] [Google Scholar]
- 33. Brunet FG, Crollius HR, Paris M, et al. Gene loss and evolutionary rates following whole‐genome duplication in teleost fishes. Mol Biol Evol. 2006;23(9):1808‐1816. 10.1093/molbev/msl049. [DOI] [PubMed] [Google Scholar]
- 34. Postlethwait JH. The zebrafish genome in context: ohnologs gone missing. J Exp Zool B Mol Dev Evol. 2007;308(5):563‐577. 10.1002/jez.b.21137. [DOI] [PubMed] [Google Scholar]
- 35. Albalat R, Canestro C. Evolution by gene loss. Nat Rev Genet. 2016;17(7):379‐391. 10.1038/nrg.2016.39. [DOI] [PubMed] [Google Scholar]
- 36. Force A, Lynch M, Pickett FB, Amores A, Yan YL, Postlethwait J. Preservation of duplicate genes by complementary, degenerative mutations. Genetics. 1999;151(4):1531‐1545. [DOI] [PMC free article] [PubMed] [Google Scholar]
- 37. Moody WJ. The development of voltage‐gated ion channels and its relation to activity‐dependent development events. Curr Top Dev Biol. 1998;39:159‐185. 10.1016/s0070-2153(08)60455-x. [DOI] [PubMed] [Google Scholar]
- 38. Bates E. Ion channels in development and cancer. Annu Rev Cell Dev Biol. 2015;31:231‐247. 10.1146/annurev-cellbio-100814-125338. [DOI] [PubMed] [Google Scholar]
- 39. Levin M. Molecular bioelectricity: how endogenous voltage potentials control cell behavior and instruct pattern regulation in vivo. Mol Biol Cell. 2014;25(24):3835‐3850. 10.1091/mbc.E13-12-0708. [DOI] [PMC free article] [PubMed] [Google Scholar]
- 40. Dahal GR, Pradhan SJ, Bates EA. Inwardly rectifying potassium channels influenceDrosophilawing morphogenesis by regulating Dpp release. Development. 2017;144(15):2771‐2783. 10.1242/dev.146647. [DOI] [PMC free article] [PubMed] [Google Scholar]
- 41. Belus MT, Rogers MA, Elzubeir A, et al. Kir2.1 is important for efficient BMP signaling in mammalian face development. Dev Biol. 2018;444:S297‐S307. 10.1016/j.ydbio.2018.02.012. [DOI] [PMC free article] [PubMed] [Google Scholar]
- 42. Adams DS, Uzel SGM, Akagi J, et al. Bioelectric signalling via potassium channels: a mechanism for craniofacial dysmorphogenesis in KCNJ2‐associated Andersen‐Tawil Syndrome. Journal of Physiology‐London. 2016;594(12):3245‐3270. 10.1113/Jp271930. [DOI] [PMC free article] [PubMed] [Google Scholar]
- 43. Atsuta Y, Tomizawa RR, Levin M, Tabin CJ. L‐type voltage‐gated Ca(2+) channel CaV1.2 regulates chondrogenesis during limb development. Proc Natl Acad Sci U S A. 2019;116(43):21592‐21601. 10.1073/pnas.1908981116. [DOI] [PMC free article] [PubMed] [Google Scholar]
- 44. Silic MR, Wu Q, Kim BH, et al. Potassium channel‐associated bioelectricity of the dermomyotome determines fin patterning in zebrafish. Genetics. 2020;215:1084. 10.1534/genetics.120.303390. [DOI] [PMC free article] [PubMed] [Google Scholar]
- 45. Kim BH, Zhang G. Generating stable knockout zebrafish lines by deleting large chromosomal fragments using multiple gRNAs. G3 (Bethesda). 2020;10(3):1029‐1037. 10.1534/g3.119.401035. [DOI] [PMC free article] [PubMed] [Google Scholar]
- 46. Yin L, Maddison LA, Li M, et al. Multiplex conditional mutagenesis using transgenic expression of Cas9 and sgRNAs. Genetics. 2015;200(2):431‐441. 10.1534/genetics.115.176917. [DOI] [PMC free article] [PubMed] [Google Scholar]
- 47. Ablain J, Durand EM, Yang S, Zhou Y, Zon LIA. CRISPR/Cas9 vector system for tissue‐specific gene disruption in zebrafish. Dev Cell. 2015;32(6):756‐764. 10.1016/j.devcel.2015.01.032. [DOI] [PMC free article] [PubMed] [Google Scholar]
- 48. Westerfield M. The Zebrafish Book. A Guide for the Laboratory Use of Zebrafish (Danio Rerio). 4th ed. Eugene: University of Oregon Press; 2000. [Google Scholar]
- 49. Kimmel CB, Ballard WW, Kimmel SR, Ullmann B, Schilling TF. Stages of embryonic development of the zebrafish. Dev Dyn. 1995;203(3):253‐310. 10.1002/aja.1002030302. [DOI] [PubMed] [Google Scholar]
- 50. Edgar RC. MUSCLE: multiple sequence alignment with high accuracy and high throughput. Nucleic Acids Res. 2004;32(5):1792‐1797. 10.1093/nar/gkh340. [DOI] [PMC free article] [PubMed] [Google Scholar]
- 51. Tamura K, Stecher G, Peterson D, Filipski A, Kumar S. MEGA6: molecular evolutionary genetics analysis version 6.0. Mol Biol Evol. 2013;30(12):2725‐2729. 10.1093/molbev/mst197. [DOI] [PMC free article] [PubMed] [Google Scholar]
- 52. Felsenstein J. Inferring Phylogenies. Sunderland: Sinauer; 2004. [Google Scholar]
- 53. Zhang G, Miyamoto MM, Cohn MJ. Lamprey type II collagen and Sox9 reveal an ancient origin of the vertebrate collagenous skeleton. Proc Natl Acad Sci U S A. 2006;103(9):3180‐3185. 10.1073/pnas.0508313103. [DOI] [PMC free article] [PubMed] [Google Scholar]
- 54. Zhang G, Cohn MJ. Hagfish and lancelet fibrillar collagens reveal that type II collagen‐based cartilage evolved in stem vertebrates. Proc Natl Acad Sci U S A. 2006;103(45):16829‐16833. 10.1073/pnas.0605630103. [DOI] [PMC free article] [PubMed] [Google Scholar]
- 55. Catchen JM, Conery JS, Postlethwait JH. Automated identification of conserved synteny after whole‐genome duplication. Genome Res. 2009;19(8):1497‐1505. 10.1101/gr.090480.108. [DOI] [PMC free article] [PubMed] [Google Scholar]
- 56. Hensley MR, Chua RF, Leung YF, Yang JY, Zhang G. Molecular evolution of MDM1, a "Duplication‐Resistant" gene in vertebrates. PLoS One. 2016;11(9):e0163229. 10.1371/journal.pone.0163229. [DOI] [PMC free article] [PubMed] [Google Scholar]
Associated Data
This section collects any data citations, data availability statements, or supplementary materials included in this article.
Supplementary Materials
Table S1 Protein sequences used for phylogenetic analysis
Table S2 Primer sequences for zebrafish KCa gene cloning